A change, it had to come We knew it all along
We were liberated from the fold, that’s all
And the world looks just the same And history ain’t changed
‘Cause the banners, they all flown in the last war
As inflation rapidly accelerated towards the end of 2021, bond yields woke up from their decade plus slumber breathing fire and brimstone. Subsequently, bonds have once again become a worthwhile asset class for the first time since the global financial crisis.
I will explore the historical behaviour and characteristics of bonds. Importantly, I will also discuss how they have reclaimed some of their status as a valuable part of investors’ portfolios.
Riding the Roller-Coaster for the Long Term
Notwithstanding that stocks have periodically caused investors some severe nausea during bear markets, those who have been willing to tolerate such dizzy spells have been well-compensated. In Stocks for the Long Run, Wharton Professor Jeremy Siegel states “over long periods of time, the returns on equities not only surpassed those of all other financial assets but were far safer and more predictable than bond returns when inflation was taken into account.”
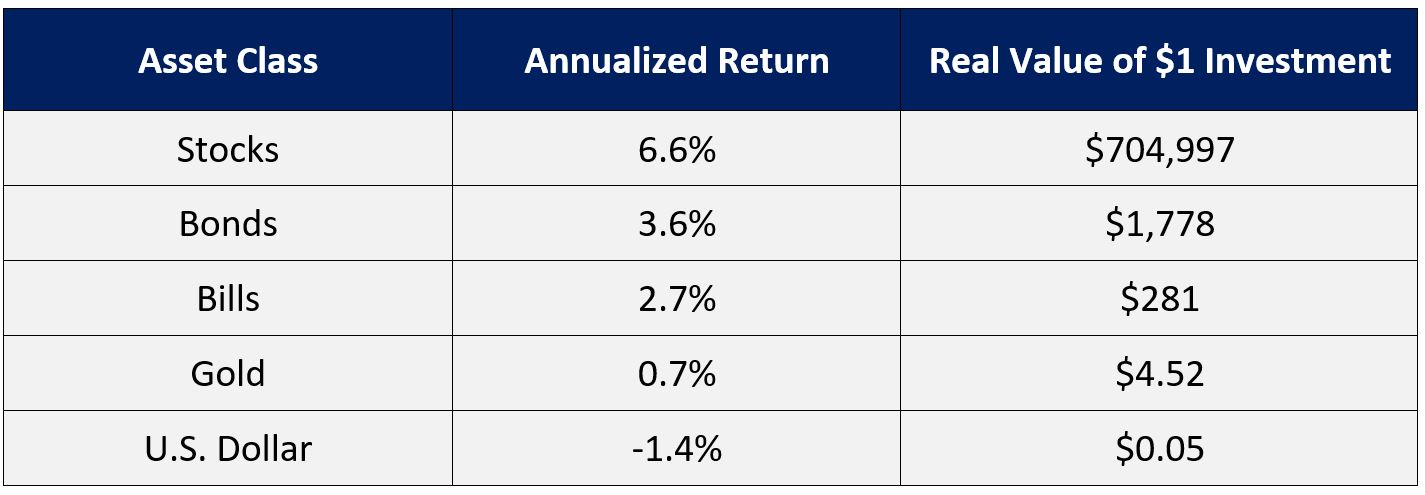
As the following table demonstrates, not only have stocks outperformed bonds, but have also trounced other major asset classes. The effect of this outperformance cannot be understated in terms of its contribution to cumulative returns over the long term. Over extended holding periods, any diversification away from stocks has resulted in vastly inferior performance.
Real Returns: Stocks, Bonds, Bills, Gold and the U.S. Dollar: 1802-2012
With respect to stocks’ main competitor, which are bonds, Warren Buffett stated in his 2012 annual letter to Berkshire Hathaway shareholders:“Bonds are among the most dangerous of assets. Over the past century these instruments have destroyed the purchasing power of investors in many countries, even as these holders continued to receive timely payments of interest and principal … Right now, bonds should come with a warning label.”
The Case for Bonds
Notwithstanding that past performance is not a guarantee of future returns, the preceding table begs the question of why investors don’t simply hold all-stock portfolios. However, there are valid reasons, both psychological and financial, that render such a strategy less than ideal for many people.
The buy-and-hold, 100% stock portfolio is a double-edged sword. If (1) you can stick with it through stomach-churning bear market losses, and (2) have a long-term horizon during which the need to liquidate assets will not arise, then strapping yourself into the roller-coaster of an all-stock portfolio may indeed be the optimal solution. Conversely, it would be difficult to identify a worse alternative for those who do not meet these criteria. Continue Reading…
Are CDRs the better way to hold U.S. investments? What are the pros and cons?
TSInetwork.ca
Canadian Imperial Bank of Commerce (CIBC)’s Canadian Depositary Receipts (CDRs) give investors the opportunity to buy shares and/or fractions of shares in any of a number of U.S. or other foreign companies, in bundles that start out trading at a price of about $20 Cdn. each.
CDRs come with a built-in hedging feature that reduces exchange-rate fluctuations. This feature costs you 0.60% of your investment yearly.
CDRs let you invest small sums in U.S. or other foreign stocks, some of which have exceptionally high per-share prices. (For instance, Nvidia recently was trading for $475.06 a share.) Note, though, that with highly liquid stocks like Nvidia, or the other shares underlying CIBC’s CDRs, investors can easily buy, say, just one or two shares if they want.
CDRs represent shares of U.S. or other foreign companies but are traded on a Canadian stock exchange in Canadian dollars.
CIBC currently offers about 47 CDRs that trade on Cboe Canada (formerly NEO Exchange). Here’s just a few of them:
Alphabet Canadian Depositary Receipts – GOOG
Amazon.com Canadian Depositary Receipts – AMZN
Apple Canadian Depositary Receipts – AAPL
Meta Platforms Canadian Depositary Receipts – META
Microsoft Canadian Depositary Receipts – MSFT
Netflix Canadian Depositary Receipts – NFLX
Nvidia Canadian Depositary Receipts – NVDA
PayPal Canadian Depositary Receipts – PYPL
Starbucks Canadian Depositary Receipts – SBUX
Tesla Canadian Depositary Receipts – TSLA
Visa Canadian Depositary Receipts – VISA
Walt Disney Canadian Depositary Receipts – DIS
Cboe Canada is recognized by the Ontario Securities Commission.
An individual CDR is not intended to equal the cost of a single share. Instead, each new CDR started out trading at around $20 Cdn., representing ownership of one or more shares and/or a fraction of one share of the underlying stock, depending on the stock’s price. As mentioned, shares of many of the largest companies in the world trade at significantly higher prices, although some trade much lower as well.
Dividends paid on the shares underlying CDRs will be passed through to CDR investors in Canadian dollars when received, based on the current foreign exchange rates.
The main negative about CDRs is the Fees
CIBC charges no direct management fees for CDRs. However, the CDRs are hedged against movements of the U.S. dollar relative to the Canadian dollar. That means the Canadian-dollar value of the CDRs rises and falls solely with the movements of the underlying stock.
Of course, hedging has costs: and hedging against changes in the U.S. dollar only works in your favour when the value of the U.S. dollar drops in relation to the Canadian currency. If the U.S. dollar rises while your investment is hedged, that reduces any gain you’d otherwise enjoy, or expands any loss. Continue Reading…
When it comes to stocks, index investing offers many advantages over other investment approaches. However, these advantages don’t always carry over to other asset classes. No investment style should be treated like a religion, indexing included. It pays to think through the reasons for using a given approach to investing.
Stocks
Low-cost broadly-diversified index investing in stocks offers a number of advantages over other investment approaches:
Lower costs, including MERs, trading costs within funds, and capital gains taxes
Less work for the investor
Better diversification, leading to lower-volatility losses
Choosing actively-managed mutual funds or ETFs definitely has much higher costs. For investors who just pick some actively-managed funds and stick with them, the amount of work required can be low, but more often the investor stays on the lookout for better funds, which can be a lot of work for questionable benefit. Many actively-managed funds offer decent diversification. Ironically, the best diversification comes from closet index funds that charge high fees for doing little.
Investors who pick their own stocks to hold for the long term, including dividend investors, do well on costs, but typically put in a lot of work and fail to diversify sufficiently. Those who trade stocks actively on their own tend to suffer from trading losses and poor diversification, and they put in a lot of effort for their poor results. Things get worse with options.
Despite the advantages of pure index investing in stocks, I make two exceptions. The first is that I own one ETF of U.S. small value stocks (Vanguard’s VBR) because of the history of small value stocks outperforming market averages. If this works out poorly for me, it will be because of slightly higher costs and slightly poorer diversification.
One might ask why I don’t make exceptions for other factors shown to have produced excess returns in the past. The reason is that I have little confidence that they will outperform in the future by enough to cover the higher costs of investing in them. Popularity tends to drive down future returns. The same may happen to small value stocks, but they seemed to me to offer enough promise to take the chance.
The second exception I make to pure index investing in stocks is that I tilt slowly toward bonds as the CAPE10 of the world’s stocks grows above 25. I think of this as easing up on stocks because they have risen substantially, and I have less need to take as much risk to meet my goals. It also reduces my portfolio’s risk at a time when the odds of a substantial stock market crash are elevated. But the fact that I think of this measure in terms of risk control doesn’t change the fact that I’m engaged in a modest amount of market timing.
At the CAPE10 peak in late 2021, my allocation to bonds was 7 percentage points higher than it would have been if the CAPE10 had been below 25. This might seem like a small change, but the shift of dollars from high-flying stocks to bonds got magnified when combined with my normal portfolio rebalancing.
Another thing I do as the CAPE10 of the world’s stocks exceeds 20 is to lower my future return expectations, but this doesn’t include any additional portfolio adjustments.
Bonds
It is easy to treat all bonds as a single asset class and invest in an index of all available bonds, perhaps limited to a particular country. However, I don’t see bonds this way. I see corporate bonds as a separate asset class from government bonds, because corporate bonds have the possibility of default. I prefer to invest slightly more in stocks than to chase yield in corporate bonds.
I don’t know if experts can see conditions when corporate bonds are a good bet based on their risk and the additional yield they offer. I just know that I can’t do this. I prefer my bonds to be safe and to leave the risk to my stock holdings.
I also see long-term government bonds as a different asset class from short-term government bonds (less than 5 years). Central banks are constantly manipulating the bond market through ramping up or down on their holdings of different durations of bonds. This manipulation makes me uneasy about holding risky long-term bonds.
Another reason I have for avoiding long-term bonds is inflation risk. Investment professionals are often taught that government bonds are risk-free if held to maturity. This is only true in nominal terms. My future financial obligations tend to grow with inflation. Long-term government bonds look very risky to me when I consider the uncertainty of inflation over decades. Inflation-protected bonds deal with inflation risk, but this still leaves concerns about bond market manipulation by central banks.
Once we eliminate corporate bonds and long-term government bonds, the idea of indexing doesn’t really apply. For a given duration, all government bonds in a particular country tend to all have the same yield. Owning an index of different durations of bonds from 0 to 5 years offers some diversification, but I tend not to think about this much. I buy a short-term bond ETF when it’s convenient, and just store cash in a high-interest savings account when that is convenient.
Overall, I’m not convinced that the solid thinking behind stock indexing carries over well to bond investing. There are those who carve up stocks into sub-classes they like and don’t like, just as I have done with bonds. However, my view of the resulting stock investing strategies, such as owning only some sub-classes or sector rotation, is that they are inferior to broad-based indexing of stocks. I don’t see broad-based indexing of bonds the same way.
Real estate
Owning Real-Estate Investment Trusts (REITs) is certainly less risky than owning a property or two. I’ve chosen to avoid additional real estate investments beyond the house I live in and whatever is held by the companies in my ETFs. So, I can’t say I know much about REITs. Continue Reading…
Since 2008, there has been a major shift from actively managed funds into passive, index-tracking investments. During this time, more than $1 trillion has flowed from actively managed U.S. equity funds into their passive counterparts, which have increased their share of the U.S. investment pie from under 20% to over 40%.
The Efficient Market Theory and Active Management: Why Bother?
The theory underlying passive investing is the efficient-market hypothesis (EMH), which was developed in the 1960s at the Chicago Graduate School of Business. The EMH states that asset prices reflect all available information, causing securities to always be priced correctly, thereby making markets efficient. By extension, it asserts that you cannot achieve higher returns without assuming a commensurate amount of incremental risk, nor can you reduce risk without sacrificing a commensurate amount of return. In essence, the EMH contends that it is impossible to consistently “beat the market” on a risk-adjusted basis. When applied to the decision to hire an active manager rather than a passive index fund, the EMH can be neatly summarized as “why bother?”
It might seem that, as an active manager, I am shooting myself in the foot by pointing out the success of passive investing at the expense of its active counterpart … but bear with me for the punchline.
Bogle’s Folly & Not Backing Down
The first index funds were launched in the early 1970s by American National Bank, Batterymarch Financial Management, and Wells Fargo, and were available only to large pension plans. A few years later, the Vanguard First Index Investment Fund (now the Vanguard S&P 500 Index Fund), was launched as the first index fund available to individual investors. The fund was the brainchild of Vanguard founder Jack Bogle, who believed that it would be difficult for actively managed mutual funds to outperform an index fund once their costs and fees were subtracted from returns. His goal was to offer investors a diversified fund at minimal cost that would give them what he called their “fair share” of the stock market’s return.
In its initial public offering, the fund brought in only $11.3 million. Vanguard’s competitors referred to the fund as “Bogle’s Folly,” stating that investors wanted nothing to do with a fund that, by its very nature, could never outperform the market. To the benefit of the investing public, Bogle did not back down. Vanguard currently manages over $9 trillion in assets, the bulk of which is in index funds and exchange-traded funds. Importantly, approximately half of all assets managed by investment companies in the U.S. are invested in Bogle’s Folly and its descendants.
Bogle permanently changed the investment industry. Any investors can purchase shares of low-cost index funds in almost every global asset class. At Berkshire Hathaway Inc.’s 2017 annual meeting, Buffett estimated that by making low-cost index funds so popular for investors, Bogle “put tens and tens and tens of billions of dollars into their pockets.” According to Buffett, “Jack did more for American investors as a whole than any individual I’ve known.”
The Numbers Don’t Lie: Hype vs. Reality
In most cases, the long-term evidence makes it hard to strongly disagree with the EMH, and by extension to advocate for active over passive management. Specifically, active management has by and large failed to deliver.
According to S&P Global, 78.7% of U.S. active large-cap managers have underperformed the S&P 500 Index over the past five years ending December 31, 2023.
A $10 million investment in the index made at the end of 2018 would be worth $20,724,263 five years later, as compared to an average value for active managers of $18,481,489, representing a shortfall of $2,242,774 vs. the index.
Extrapolating the different rates of return of the index and active managers for another five years, the average shortfall of active managers increases from $2,242,774 to $8,792,966. After 20 years, the difference grows by an additional $59,006,123 to $67,799,089.
The Canadian experience has been similarly damning:
According to S&P Global, 93.0% of Canadian equity managers have underperformed the TSX Composite Index over the past five years ending December 31, 2023.
A $10 million investment in the index made at the end of 2018 would be worth $17,079,526 five years later, as compared to an average value of $15,217,594 for active managers, representing a shortfall of $1,861,932 vs. the index.
Extrapolating the different rates of return of the index and active managers for another five years, the average shortfall of active managers increases from $1,861,932 to $6,013,505. After 20 years, the difference grows by an additional $25,454,288 to $31,467,793.
Given these dire statistics, it is no wonder that swaths of institutional and individual investors have migrated from active management to passive investing. Investors have been getting the message that the proclaimed advantages of active management are more hype than reality.
Acceptable Failure, Unacceptable Failure & Michael Jordan
Legendary basketball superstar Michael Jordan stated, “I can accept failure, everyone fails at something. But I can’t accept not trying.” Relatedly, within the sphere of active management it is imperative to discern between what I refer to as sincere and disingenuous underperformers.
Sincere underperformers try their level best to outperform (an “A” for effort scenario). These active efforts entail expenses that passive funds do not face, such as paying investment professionals to analyze companies with the goal of identifying stocks that will outperform. These extra costs must be passed on to investors, resulting in higher fees than passive vehicles. In contrast, disingenuous underperformers are not truly trying to outperform. Their portfolios more or less replicate their benchmark indexes. Such funds, which are pejoratively referred to as “closet indexers”, are charging active management fees for doing something that investors could do for a fraction of the cost by investing in an index fund or ETF – good work if you can find it!
An academic study titled, “The Mutual Fund Industry Worldwide: Explicit and Closet Indexing, Fees, and Performance,” determined the pervasiveness of closet indexers across a sample of developed countries. Out of the 20 countries included in the study, Canada ranked highest in terms of its percentage of purportedly active mutual fund assets that are actually invested in closet index portfolios. Every year, billions of dollars in fees are unjustifiably being charged to investors.
Don’t Throw the Baby Out with the Bathwater
Although the historical data clearly indicate that the vast majority of managers have underperformed their benchmarks, this is not universally the case. Although few and far between, there are managers who have outperformed, either in simple terms, in risk-adjusted terms, or both.
According to S&P Global, 93.9% of Canadian dividend-focused funds have underperformed over the past five years. In sharp contrast, the algorithmically driven Outcome Canadian Equity Income Fund has outperformed the iShares TSX Dividend Aristocrats Index ETF (symbol CDZ) by 13.1% since its inception nearly six years ago in October 2018. A $10 million investment in the OCEI fund made at its inception would have a value of $$17,731,791 as of the end of last month, as compared to a value of $16,426,492 for the iShares TSX Dividend Aristocrats Index ETF. Importantly, the fund has achieved these higher returns while exhibiting significantly less volatility and shallower losses in declining markets. In combination, the fund’s higher returns and lower volatility have enabled it to achieve a risk-adjusted return (Sharpe ratio) that is 49.9% higher than its benchmark.
Noah Solomon is Chief Investment Officer for Outcome Metric Asset Management Limited Partnership. From 2008 to 2016, Noah was CEO and CIO of GenFund Management Inc. (formerly Genuity Fund Management), where he designed and managed data-driven, statistically-based equity funds.
Between 2002 and 2008, Noah was a proprietary trader in the equities division of Goldman Sachs, where he deployed the firm’s capital in several quantitatively-driven investment strategies. Prior to joining Goldman, Noah worked at Citibank and Lehman Brothers. Noah holds an MBA from the Wharton School of Business at the University of Pennsylvania, where he graduated as a Palmer Scholar (top 5% of graduating class). He also holds a BA from McGill University (magna cum laude).
Noah is frequently featured in the media including a regular column in the Financial Post and appearances on BNN. This blog originally appeared in the August 2024 issue of the Outcome newsletter and is republished here with permission.
Anytime anyone consults a financial advisor, two things typically occur:
The financial advisor tends to recommend their “in-house” products, which often come with high management expense fees ranging from 2-3%
They inquire about your age and then miraculously present a fund tailored to individuals in your age group.
We’ve discussed point #1 in previous posts. Financial advisors invariably promote funds with high expense fees because they receive kickbacks known as trailer fees, which constitute a significant portion of their income. However, it’s important to note that these trailer fees come out of your pocket. It is in the financial advisor’s best interest to consistently suggest products that offer the most generous commissions.
Despite the fact that there are numerous low-cost index funds and ETFs that might be the best options for their clients, financial advisers seldom recommend them because they do not generate commissions. The success of investment advis0rs often depends on their clients’ lack of knowledge.
As for point #2, they are equally inadequate. The typical formula for selecting a stock-and-bond portfolio is to subtract your age from 100%. This implies that if you are 30 years old, your portfolio should consist of 70% stocks and 30% bonds. If you are 50 years old, the recommended allocation is 50% stocks and 50% bonds, and so on.
Is age really the most significant factor? What if I am already a millionaire? What if I am struggling to pay my rent? What if I am in good health? What if I am in poor health? These factors seem to be overlooked, as financial advisers simply refer to tables provided by their employers and assign clients to predetermined brackets from their sales manuals.
Historically, stocks have consistently outperformed bonds as an investment, but investing in bonds can create a false sense of security. In reality, bonds offer reduced volatility, but less volatility does not equate to lower risk. Over the long term, bonds are not less risky than stocks; they are simply less volatile.
The truth is that the more bonds you hold in your portfolio, the more you limit your growth potential. Why would anyone sacrifice their potential for earnings simply because they are older? When you are older and in need of your money the most, that’s precisely when you would want your money to work its hardest for you. Continue Reading…