Tag Archives: asset allocation

Timeless Financial Tips #5: Trust the Evidence

<

Lowrie Financial: Canva Custom Creation


Evidence-Based Investing – Your Best Chance to Hit Your Long-Term Investment Goals

By Steve Lowrie, CFA

Special to Financial Independence Hub

If I could, I would grant amazing investment returns to every investor across every market. Unfortunately, that’s just not how it works. In real life, we must aim toward our financial ideals, knowing we won’t hit the bullseye every time.

That’s why I recommend evidence-based investing: or investing according to our best understanding of how markets have actually delivered available returns over time, versus how we wish they would. Our “best understanding” may still be imperfect, but it sure beats ignoring reality entirely.

Luck-Based Investing and Random Returns

Many investors try to pick and choose when and how to invest based on what they or others are predicting will happen next. All evidence suggests their success or failure will be driven far more by luck than skill. Worse, going down this path, there is a very high probability they’ll end up with worse results versus a properly structured “buy and hold” approach.

Some deliberately embrace this approach, hoping to “beat” the market. Others come to it accidentally, by reacting to financial behavioural biases such as panic-selling or spree-buying. Either way, these sorts of investment portfolios typically devolve into a disheartening assortment of holdings over time, offering little sense of where you stand in relation to your own goals or overall market performance. The odds stack steeply against your achieving any carefully planned outcome: provided you had one to begin with.

Evidence-Based Investing and Portfolio Planning

In contrast, evidence-based investors adhere to decades and volumes of time-tested, peer-reviewed analysis by academics and practitioners alike. In aggregate, we seek to answer an essential investment challenge:

How can an investor increase the probability they’ll capture the highest expected market returns, given the levels of investment risk they’re willing to accept?

The answers point to a two-step strategy:

1. Build It. Prepare your personal portfolio:

  • Allocate your investments between broad asset classes.
  • Widely diversify your bonds and equities to reduce the unnecessary risks inherent to individual bond or stock picks.
  • Tilt your overall portfolio toward factors with higher expected returns, according to your personal financial goals and risk tolerances.

2. Keep It. Sit tight with your carefully constructed portfolio for the long term, to ensure you capture the expected long-term growth from your various market allocations. So, stay invested through thick and thin and set aside enough cash reserves to cover upcoming spending needs.

At the risk of repeating ourselves (which is, after all, the theme of this “Play It Again, Steve” financial tips blog series), evidence-based investing translates into building and maintaining a portfolio that looks something like this:

three key portfolio construction decisions

Keeping It: The Hardest Thing

It’s one thing to build an ideal portfolio. It’s another to keep it in balance as intended. In fact, thanks to our behavioural biases, I would argue it’s the hardest part.

For example, what will you do after the stock market has been surging, and your 60%/40% stock/bond allocations end up being closer to 70%/ 30%.? You’ll probably want to let your overweight allocation to high-flying stocks ride, hoping to score even more. That’s because recency and other behavioural biases trick us into believing the party will never end. However, the more prudent, evidence-based move is to sell some of your equity allocations (selling high) and use the proceeds to buy more humdrum fixed income (buying low), until you’re back to your original 60%/40% mix. Continue Reading…

Timeless Financial Tips #4: How to Manage your Financial Behavioural Biases

Lowrie Financial: Canva Custom Creation

By Steve Lowrie, CFA

Special to Financial Independence Hub

There are countless external forces influencing your investment outcomes: taxes, market mood swings, breaking news, etc., etc.

Today, let’s look inward, to an equally important influence: your own financial behavioural biases.

The Dark Side of Financial Behavioural Bias

Having evolved over millennia to secure our survival, our deep-seated behavioural biases precondition us to frequently depend more on “gut feel” than rational reflection. Sometimes, our instincts are life-saving, like when a car brakes hard right in front of you. Chemical reactions in the lower brain’s amygdala trigger you to brake too, even as your higher brain is still enjoying the scenery.

Unfortunately, these same rapid-fire triggers often hurt us as investors. When we make snap financial decisions that “feel” right but are rationally wrong, we tend to sabotage our own best interests. By recognizing these reactions as they occur, you’re more likely to stop them from ruining your financial resolve, which in turn improves your odds for better outcomes. Let’s explore some behavioural finance examples that you’ll want to prepare for…

Behavioural Finance Example #1: Fear and FOMO

The point of investing is to buy low and sell high. So, why do so many investors so often do the opposite? You can blame fear, as well as Fear of Missing Out (FOMO investing). Time after time, crisis after crisis, bubble after bubble, investors rush to buy high by chasing hot holdings. They hurry to sell low, fleeing falling prices. They’re letting their behavioural biases overcome their rational resolve.

Behavioural Finance Example #2: Choice Overload and Decision Fatigue

Our brains also don’t deal well with too much information. When we experience information overload, we may stop even trying to be thoughtful, and surrender to our biases. We’ll end up favouring whatever’s most familiar, most recently outperforming, or least scary right now. When choosing from an oversized restaurant menu, that’s okay. But your life savings deserve better than that.

Behavioural Finance Example #3: Popular Demand and Survival of the Fittest

Inherently tribal by nature, we humans are susceptible to herd mentality. When everyone else gets excited and starts chasing fads, whether it is cryptocurrencies, alternative investments, or the other financial exotica-du-jour, we want to pile in too. When the herd turns tail, we want to rush after them. It’s like that old joke about escaping a bear: you don’t need to run faster than the bear; you just need to run faster than the guy next to you. In bear markets, this causes investors to flee otherwise sound positions, selling low, and paying dearly for “safer” holdings, rather than holding their well-planned ground.

Behavioural Finance Example #4: Anchor Points and Other Financial Regrets

Successful investors look past their occasional setbacks and remain focused on capturing the market’s long-term expected returns. But that’s hard to do, as we are often trapped by financial decisions regret. For example, loss aversion causes the average investor to regret losing money approximately twice as much as they appreciate gaining it. Similarly, anchor bias causes us to cling to depreciated holdings long after they no longer make sense in our portfolio, hoping against hope they’ll eventually recover to some arbitrary, past price. Ironically, you’re less likely to achieve your personal financial goals if you’re driven more by your financial regrets than your willpower.

Taking Charge of Your Financial Behavioural Biases

We’ve now looked at some of the damage done by behavioural biases. Once you know they’re there, you can at least minimize your exposure to them. Better yet, by using what behavioral psychologists call “nudges,” you can even harness your biases as forces for financial good. Following are two examples. Continue Reading…

A Failure to understand Rebalancing


By Michael J. Wiener

Special to the Financial Independence Hub

Recently, the Stingy Investor pointed to an article whose title caught my eye: The Academic Failure to Understand Rebalancing, written by mathematician and economist Michael Edesess.  He claims that academics get portfolio rebalancing all wrong, and that there’s more money to be made by not rebalancing.  Fortunately, his arguments are clear enough that it’s easy to see where his reasoning goes wrong.


Edesess’ argument

Edesess makes his case against portfolio rebalancing based on a simple hypothetical investment: either your money doubles or gets cut in half based on a coin flip.  If you let a dollar ride through 20 iterations of this investment, it could get cut in half as many as 20 times, or it could double as many as 20 times.  If you get exactly 10 heads and 10 tails, the doublings and halvings cancel and you’ll be left with just your original dollar.

The optimum way to use this investment based on the mathematics behind rebalancing and the Kelly criterion is to wager 50 cents and hold back the other 50 cents.  So, after a single coin flip, you’ll either gain 50 cents or lose 25 cents.  After 20 flips of wagering half your money each time, if you get 10 heads and 10 tails, you’ll be left with $3.25.  This is a big improvement over just getting back your original dollar when you bet the whole amount on each flip in this 10 heads and 10 tails scenario.  This is the advantage rebalancing gives you.

However, Edesess digs further.  If you wager everything each flip and get 11 good flips and 9 bad flips, you’ll have $4, and with the reverse outcome you’ll have 25 cents.  Either you gain $3 or lose only 75 cents.  At 12 good flips vs. 12 bad flips, the difference grows further to gaining $15 or losing 94 cents.  We see that the upside is substantially larger than the downside.

Let’s refer to one set of 20 flips starting with one dollar as a “game.”  We could think of playing this game multiple times, each time starting by wagering a single dollar.  Edesess calculates that “if you were to play the game 1,001 times, you would end up with $87,000 with the 100% buy-and-hold strategy,”  “but only $11,000 with the rebalancing strategy.”

The problem with this reasoning

Edesess’ calculations are correct.  If you play this game thousands of times, you’re virtually certain to come out far ahead by letting your money ride instead of risking only half on each flip.  However, this is only true if you start each game with a fresh dollar. Continue Reading…

The Balanced Portfolio journey after a terrible 2022

Inverted Yield Curves & Recession: How smart are Markets?

Image Outcome/Creative Commons

By Noah Solomon

Special to Financial Independence Hub

Today’s Special: An Inverted Yield Curve with a Side Order of (Possible) Recession

In our discussions with clients over the past several months, the two frequent topics of conversation have been:

  1. The inversion of the U.S. Treasury curve, and
  2. The possibility of a recession occurring within the next few quarters.

In the following missive, I use a data-based, historical approach to explore the possible investment implications of these concerns.

How Smart is the Yield Curve?

The U.S. Treasury market has an impressive track record in terms of forecasting recessions. Going back to the late 1980s, every time the yield on 10-year U.S. Treasury bonds has remained below that of its two-year counterpart for at least six months, a recession has followed. Such was the case with the recession of the early 1990s, of the early 2000s, and of the global financial crisis.

When it comes to investing (as with many things), timing is critical. Given that yield curves do occasionally invert and that recessions do happen from time to time, it follows that every recession has been preceded by an inverted curve, and vice-versa. What makes the historical prescience of inverted yield curves so impressive is that the recessions which followed them did so within a relatively short period.

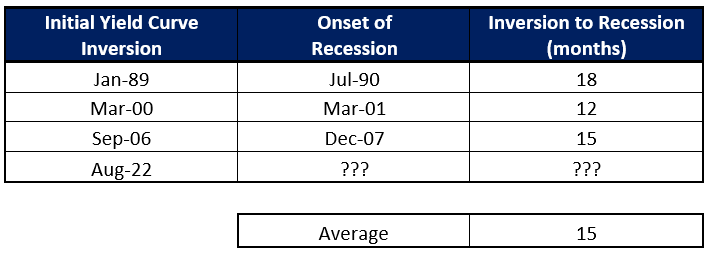
United States – Months from Yield Curve Inversion to Onset of Recession: 1989-Present

The table above covers the past three U.S. recessions, excluding the Covid-induced contraction of 2020, which I have omitted since it had nothing to do with macroeconomic factors, monetary policy, etc. As the table demonstrates, the time lag between yield curve inversions and economic contractions has ranged between 12 and 18 months, with an average of 15 months.

However, the yield curve’s impeccable record of predicting recessions has not been matched by its market timing abilities. As summarized in the following table, the S&P 500 Index has produced mixed results following past inversions in the Treasury curve.

S&P 500 Performance Following Yield Curve Inversions: 1989-Present

When the Treasury curve inverted at the beginning of 1989, stocks proceeded to perform well, returning 24.1% over the following two years. Conversely, when the curve became inverted in March 2000, the S&P 500 fared poorly, losing 21.5% over the same timeframe. The index suffered a similarly undesirable fate following the Treasury curve inversion in September 2006, when stocks suffered a two-year decline of 9.1%.

How Smart is the Stock Market?

In the past, the economy and equity markets have not been correlated. Stock prices are forward looking. Historically, equities have started to decline prior to peaks in economic growth and have tended to rebound in advance of economic recoveries.

The trillion-dollar question is not whether the market is smart, but whether it is smart enough. Do prices bake in a sufficient amount of bad news ahead of time so that they avoid further losses following the onset of recessions? Or do they lack sufficient pessimism to avoid this fate? Frustratingly, the answer depends on the recession!

S&P 500 Performance Following Start of Recessions: 1990-Present

Stocks managed to skate through the recession of the early 1990s unscathed. Following the peak of the economy in mid-1990, the S&P 500 Index went on to produce a total return of 27.2% over the next two years. Unfortunately, investors were not so lucky during the recession of the early 2000s, with stocks losing 24.6% in the two years after the recession began. Similarly, the recession of 2008 was no walk in the park for markets, with the S&P 500 falling 20.3% after the economy began contracting at the end of 2007. Continue Reading…