Tag Archives: asset allocation

Book Review: Bullshift

www.dundurn.com/books

By Michael J. Wiener

Special to the Findependence Hub

In his book Bullshift: How Optimism Bias Threatens Your Finances, Certified Financial Planner and portfolio manager John De Goey makes a strong case that investors and their advisors have a bias for optimistic return expectations that leads them to take on too much risk.  However, his conviction that we are headed into a prolonged bear market shows similar overconfidence in the other direction.  Readers would do well to recognize that actual results could be anywhere between these extremes and plan accordingly.


Problems in the financial advice industry

The following examples of De Goey’s criticism of the financial advice industry are spot-on.

“Investors often accept the advice of their advisers not because the logic put forward is so compelling but because it is based on a viewpoint that everyone seems to prefer. People simply want happy explanations to be true and are more likely to act if they buy into the happy ending being promised.”  We prefer to work with those who tell us what we want to hear.

Almost all advisers believe that “staying invested is good for investors — and it usually is. What is less obvious is that it’s generally good for the advisory firms, too.”  “In greater fool markets, people overextend themselves using margin and home equity lines of credit to buy more, paying virtually any price for fear of missing out (FOMO).”  When advisers encourage their clients to stay invested, it can be hard to tell if they are promoting the clients’ interests or their own.  However, when they encourage their clients to leverage into expensive markets, they are serving their own interests.

“There are likely to be plenty of smiling faces and favourable long-term outlooks when you meet with financial professionals.”  “In most businesses, the phrase ‘under-promise and over-deliver’ is championed. When it comes to financial advice, however, many people choose to work with whoever can set the highest expectation while still seeming plausible.”  Investors shape the way the financial advice industry operates by seeking out optimistic projections.

“A significant portion of traditional financial advice is designed to manage liabilities for the advice-givers, not manage risk for the recipient.”

“Many advisers chase past performance, run concentrated portfolios, and pay little or no attention to product cost,” and they “often pursue these strategies with their own portfolios, even after they had retired from the business. They were not giving poor advice because they were conflicted, immoral, or improperly incentivized. They were doing so because they firmly believed it was good advice. They literally did not know any better.”

De Goey also does a good job explaining the problems with embedded commissions, why disclosure of conflicts of interest doesn’t work, and why we need a carbon tax.

Staying invested

On the subject of market timing, De Goey writes “there must surely be times when selling makes sense.”  Whether selling makes sense depends on the observer.  Consider a simplified investing game.  We draw a card from a deck.  If it is a heart, your portfolio drops 1%, and if not it goes up 1%.  It’s not hard to make a case here that investors would do well to always remain invested in this game.

It seems that the assertion “there must surely be times when selling makes sense” is incorrect in this case.  What would it take for it to make sense to “sell” in this game?  One answer is that a close observer of the card shuffling might see that the odds of the next card being a heart exceeds 50%.  While most players would not have this information, it is those who know more (or think they know more) who might choose not to gamble on the next card.

Another reason to not play this game is if the investor is only allowed to draw a few more cards but has already reached a desired portfolio level and doesn’t want to take a chance that the last few cards will be hearts.  Outside of these possibilities, the advice to always be invested seems good.

Returning to the real world, staying invested is the default best choice because being invested usually beats sitting in cash.  One exception is the investor who has no more need to take risks.  Another exception is when we believe we have sufficient insight into the market’s future that we can see that being invested likely won’t outperform cash.

Deciding to sell out of the market temporarily is an expression of confidence in our read of the market’s near-term future.  When others choose not to sell, they don’t have this confidence that markets will perform poorly.  Sellers either have superior reading skills, or they are overconfident and likely wrong.  It’s hard to tell which.  Whether markets decline or not, it’s still hard to tell whether selling was a good decision based on the information available at the time.

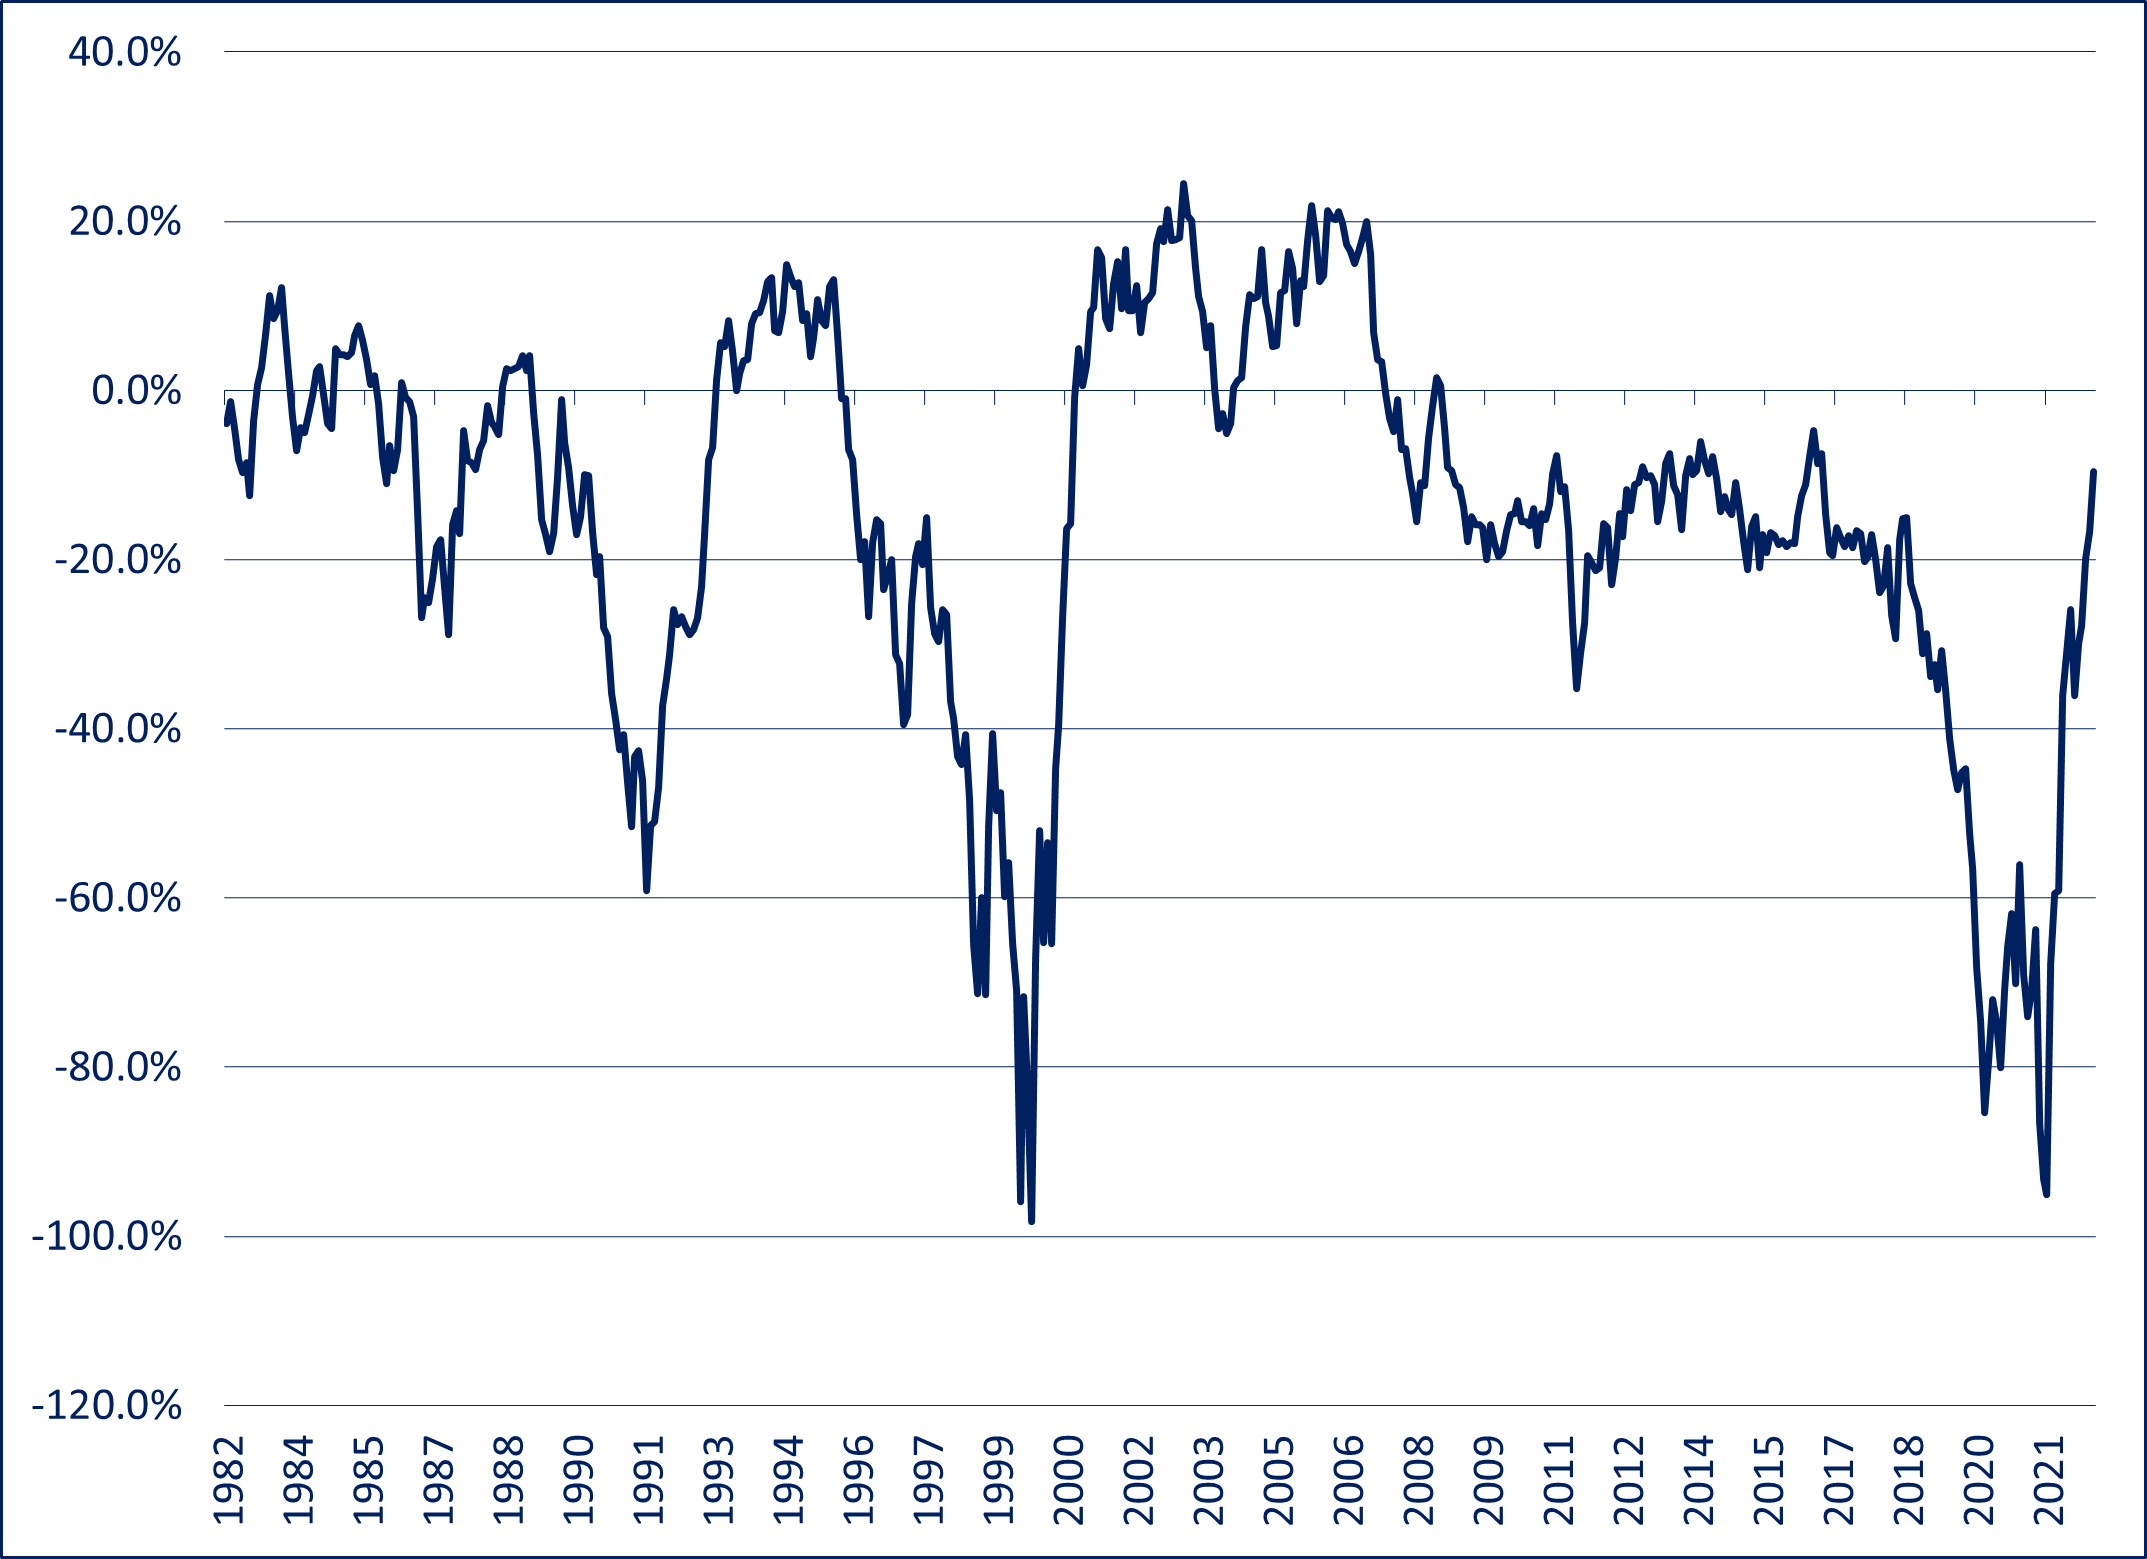
Elevated stock markets

Before December 2021, my DIY financial plan was to remain invested through all markets.  As stock markets became increasingly expensive, I thought more about this plan.  I realized that it was based on the expectation that markets would stay in a “reasonable range.”  What would I do if stock prices kept rising to ever crazier levels?

In the end I formed a plan that had me tapering stock ownership as the blended CAPE of world stocks exceeded 25.  So, during “normal” times I would stay invested, and during crazy times, I would slowly shift out of stocks in proportion to how high prices became.  I was a market timer.  My target stock allocation was 80%, but at the CAPE’s highest point after making this change, my chosen formula had dropped my stock allocation to 73%.  That’s not much of a shift, but it did reduce my 2022 investment losses by 1.3 percentage points.

So, I agree with De Goey that selling sometimes makes sense.  Although I prefer a formulaic smooth taper rather than a sudden sell-off of some fraction of a portfolio.  I didn’t share De Goey’s conviction that a market drop was definitely coming.  I had benefited from the run-up in stock prices, believed that the odds of a significant drop were elevated, and was happy to protect some of my gains in cash.  I had no idea how high stocks would go and took a middle-of-the-road approach where I was happy to give up some upside to reduce the possible downside.  “Sound financial planning should involve thinking ahead and taking into account positive and negative scenarios.”  “Options should be weighed on a balance of probabilities basis where there are a range of possible outcomes.”

As of early 2022, “the United States had the following: 5 percent of global population, 15 percent of global public companies, 25 percent of global GDP, 60 percent of global market cap, 80 percent of average U.S. investor allocation, the world’s most expensive stock markets.”  These indicators “point to a high likelihood that a bubble had formed.”  I see these indicators as a sign that risk was elevated, but I didn’t believe that a crash was certain.

When markets start to decline

“If no one can reliably know for sure what will happen, why does the industry almost always offer the same counsel when the downward trend begins?”

Implicit in this question is the belief that we can tell whether we’re in a period when near future prices are rising or falling.  Markets routinely zig-zag.  During bull markets, there are days, weeks, and even months of declines, but when we look back over a strong year, we forget about these short declines.  But the truth is that we never know whether recent trends will continue or reverse.

De Goey’s question above assumes that we know markets are declining and it’s just a question of how low they will go.  I can see the logic of shifting away from stocks as their prices rise to great heights because average returns over the following decade could be dismal, but I can’t predict short-term market moves.

Conviction that the market will crash

‘In the post-Covid-19 world, there was considerable evidence that the market run-up of 2020 and 2021 would not end well.  Some advisers did little to manage risk in anticipation of a major drop.”

I’ve never looked at economic conditions and felt certain that markets would drop.  My assessment of the probabilities may change over time, but I’m never certain.  I have managed the risk in my portfolio by choosing an asset allocation.  If I shared De Goey’s conviction about a major drop, I might have acted, but I didn’t share this conviction. Continue Reading…

Value Investing: Looking beneath the surface

Image from Outcome/QuoteInspector.com.

By Noah Solomon

Special to Financial Independence Hub

It goes without saying that 2022 was a less than stellar year for equity investors. The MSCI All Country World Index of stocks fell 18.4%. There was virtually nowhere to hide, with equities in nearly every country and region suffering significant losses. Canadian stocks were somewhat of a standout, with the TSX Composite Index falling only 5.8% for the year.

Looking below the surface, there was an interesting development underlying these broader market movements, with value stocks far outpacing their growth counterparts. Globally, value stocks suffered a loss of 7.5% as compared to a decline of 28.6% in growth stocks. This substantial outperformance was pervasive across countries and regions, including the U.S., Europe, Asia, and emerging markets. In the U.S., 2022’s outperformance of value stocks was the highest since the collapse of the tech bubble in 2000.

These historically outsized numbers have left investors wondering whether value’s outperformance has any legs left and/or whether they should now be tilting their portfolios in favor of a relative rebound in growth stocks. As the following missive demonstrates, value stocks are far more likely than not to continue outperforming.

Context is everything: Value is the “Dog” that finally has its Day

From a contextual perspective, 2022 followed an unprecedented period of value stock underperformance.

U.S Value vs. U.S. Growth Stocks – Rolling 3 Year Returns: 1982-2022


Although there have been (and will be) times when value stocks underperform their growth counterparts, the sheer scale of value’s underperformance in the several years preceding 2022 is almost without precedent in modern history. The extent of value vs. growth underperformance is matched only by that which occurred during growth stocks’ heyday in the internet bubble of the late 1990s.

Shades of Tech Bubble Insanity

The relative performance of growth vs. value stocks cannot be deemed either rational or irrational without analyzing their relative valuations. To the extent that the phenomenal winning streak of growth vs. value stocks in the runup to 2022 can be justified by commensurately superior earnings growth, it can be construed as rational. On the other hand, if the “rubber” of growth’s outperformance never met the “road” of superior profits, then at the very least you need to consider the possibility that crazy (i.e. greed, hope, etc.) had indeed entered the building.

The extreme valuations reached by many growth companies during the height of the pandemic bring to mind a warning that was issued by a market commentator during the tech bubble of the late 1990s, who stated that the prices of many stocks were “not only discounting the future, but also the hereafter.”

U.S. Value Stocks: Valuation Discount to U.S. Growth Stocks: (1995-2022)


Based on forward PE ratios, at the end of 2021 U.S. value stocks stood at a 56.3% discount to U.S. growth stocks. From a historical perspective, this discount is over double the average discount of 27.9% since 1995 and is matched only by the 56.6% discount near the height of the tech bubble in early 2000. This valuation anomaly was not just a U.S. phenomenon, with global value stocks hitting a 57.5% discount to global growth stocks, more than twice their average discount of 27.6% since 2002 and even larger than that which prevailed in early 2000 at the peak of the tech mania. Continue Reading…

North American stock portfolio outperforms when it counts

By Dale Roberts, cutthecrapinvesting

Special to the Financial Independence Hub

For U.S. stocks, my wife and I hold 17 Dividend Achievers, plus 3 stock picks. In Canada, I hold the Canadian Wide Moat 7, while my wife holds a Canadian High Dividend ETF – Vanguard’s VDY. There is also a modest position in the TSX 60 – XIU. The U.S. and Canadian stocks both outperform their respective stock market index benchmarks. Working together, the U.S. and Canadian stocks form an all-weather portfolio base.

In this post I’ll offer up charts on our U.S. stock portfolio and the Canadian stock portfolio. And I’ll put them together so that we can see how they work together. The total portfolio was designed to be retirement-ready. The fact that it beats the market benchmarks is a welcome surprise. At the core of the portfolio is wonderful Canadian dividend payers – the U.S. dividend achievers and 3 picks fill in some portfolio holes. We will also take a look at how these stocks can be arranged to provide an all-weather stock portfolio base.

When I write ‘our portfolio,” I am referring to the retirement portfolios for my wife and me. As for ‘backgrounders’ on the portfolios please have a read of our U.S. stock portfolio and the Canadian Wide Moat 7 performance update.

The stock portfolios

In early 2015 I skimmed 15 of the largest-cap dividend achievers. What does skim mean? After extensive research into the portfolio “idea” I simply bought 15 of the largest-cap dividend achievers. For more info on the index, have a look at the U.S. Dividend Appreciation Index ETF (VIG) from Vanguard. That is a U.S. dollar ETF. Canadian investors can also look to Vanguard Canada for Canadian dollar offerings (VGG.TO).

You’ll find the dividend acheivers and Canadian high dividend stocks in the ETF portfolio for retirees post. Both indices are superior for retirement funding, compared to core stock indices.

Dividend growth plus quality

At the core of the index is a meaningful dividend growth history (10 years or more) working in concert with financial health screens. It leads to a high quality skew. Given those parameters the dividend achievers index will certainly hold many dividend aristocrats (NOBL).

The 15 companies that I purchased in early 2015 are 3M (MMM), PepsiCo (PEP), CVS Health Corporation (CVS), Walmart (WMT), Johnson & Johnson (JNJ), Qualcomm (QCOM), United Technologies, Lowe’s (LOW), Walgreens Boots Alliance (WBA), Medtronic (MDT), Nike (NKE), Abbott Labs (ABT), Colgate-Palmolive (CL), Texas Instruments (TXN) and Microsoft (MSFT).

United Technologies merged with Raytheon (RTX) and then spun off Carrier Global Corporation (CARR) and Otis Worldwide (OTIS). We continue to hold all three and they have been wonderful additions to the portfolio. Given that those stocks are not available for the full period, they are not a part of this evaluation. That said, the United Technologies spin-offs added to the outperformance.

Previous to 2015 we had three picks by way of Apple (AAPL), BlackRock (BLK) and Berkshire Hathaway (BRK.B). Those stocks are overweighted in the portfolio. As you might expect, Apple has contributed greatly to the portfolio outperformance. Though the achievers also outperform the market with less volatility.

In total it is a portfolio of 20 U.S. stocks.

The Canadians

I hold a concentrated portfolio of Canadian stocks. What I give up in greater diversification, I gain in the business strength and potential for the companies that I own to not fail. They have wide moats or exist in an oligopoly situation. For the majority of the Canadian component of my RRSP account I own 7 companies in the banking, telco and pipeline space. I like to call it the Canadian wide moat portfolio. They also provide very generous and growing dividends. These days, they’d combine to offer a starting yield in the 6% range.

Here are the stocks:

Canadian banking

Royal Bank of Canada (RY), Toronto-Dominion Bank (TD) and Scotiabank (BNS).

Telco space

Bell Canada (BCE) and Telus (T).

Pipelines

Canada’s two big pipelines are Enbridge (ENB) and TC Energy (TRP).

*Total performance would be improved by holding the greater wide moat portfolio that includes grocers and railway stocks. That is a consideration for those in retirment and in the accumulation stage.

The Canadian mix outperforms the market, the TSX Composite. You’ll also find that outperformance in the Beat The TSX Portfolio. That BTSX strategy (like the Wide Moat 7) finds big dividends, strong profitability and value.

Once again, my wife holds an ETF – the Vanguard High Dividend (VDY) and a modest position in XIU. I did not want to expose her portfolio to concentration risk.

The charts

Here’s the returns of the U.S. and Canadian portfolios, plus a 50/50 U.S/CAD mix as the total portfolio. The period is January of 2015 to end of September 2022. Please keep in mind the returns are not adjusted for currency fluctuations. A Canadian investor has received a boost thanks to the strong U.S. dollar. U.S. investors owning Canadian stocks would experience a negative currency experience. Continue Reading…

Benefits of a Core-Satellite Investment approach

By Erin Allen, CIM, VP Online ETF Distribution, BMO ETFs

(Sponsor Content)

Asset allocation is one of the most critical investment decisions an investor can make. Studies, such as the influential Brinson, Hood and Beebower paper, “Determinants of Portfolio Performance,1” suggest that the long-term strategic asset allocation of a portfolio accounts for over 90% of the variation of its return.

According to the study, the portfolio’s strategic – or target – asset allocation will have a greater impact on its performance than security selection or any short-term active or tactical asset allocation shifts.

The first step when constructing a portfolio is to determine the appropriate asset allocation, based on your risk profile and investment objectives, and then select investments across each asset class.

There are several approaches to constructing an investment portfolio. One such strategy is to adopt a core-satellite approach. Core-satellite investing involves using a core portfolio to anchor the portfolio’s strategic asset allocation, and adding satellite investments to enhance returns and/or mitigate risk.

Fundamentals of a core-satellite portfolio

A typical investment portfolio is comprised of traditional asset classes that represent the broad market, and generally include investment-grade fixed income securities and large-cap Canadian, U.S. and international equities, for example BMO S&P TSX Capped Composite Index ETF (ZCN), BMO S&P 500 Index ETF (ZSP), and BMO MSCI EAFE Index ETF (ZEA). These asset classes make up the portfolio’s “core” investments. Specific securities within each asset class will depend on the investor’s return objectives and risk tolerance.

In order to further diversify the portfolio, non-traditional asset classes – referred to as “satellite” strategies – are used to enhance returns and manage risk. Satellite strategies often have greater return potential than core asset classes, but may be considered higher risk (with greater volatility) when held on their own. However, they often have a lower correlation – a measure of the degree to which two investments move in relation to each other – to traditional assets classes. Satellite strategies can include asset classes or themes that can be used as either short-term, tactical investments, or held for longer periods of time. Combining investments with a low correlation can improve the risk/return characteristics of a portfolio.

Examples of satellite strategies are shown in Table 1 [below]. By using one or more of these satellite strategies in tandem with a core portfolio, investors can further diversify their portfolio across additional asset classes, regions, sectors, market capitalizations, currencies and/or investment styles. For example, real assets such as commodities, infrastructure and real estate have a tangible value that can rise during periods of inflation.

Infrastructure and real estate can also offer a steady and predictable cash flow.  Global fixed income securities provide Canadian investors with exposure to bonds in countries with different currencies and interest rate cycles, which can help reduce interest rate risk; while hedge funds, such as market neutral or multi-strategy funds, can actually lower volatility and improve a portfolio’s risk-adjusted performance.

Table 1: Courtesy BMO ETFs

Constructing a core-satellite portfolio

A core-satellite portfolio can be implemented by using:

  • Active strategies that seek to add value through security selection;
  • Passive strategies that seek to track the performance of an index representing a particular investment market;
  • A combination of active and passive strategies.

There is a fundamental investment theory that states markets are efficient and the price of any individual security already reflects all available relevant information, which makes it more difficult for active managers to outperform. Investors who share this view would generally purchase passive investments. Conversely, others believe markets are not efficient and do not always behave rationally, providing active managers with the opportunity to select undervalued securities and avoid overvalued securities – and increasing their potential to add value above the market and/or provide better risk controls and downside protection. While some studies show that the “average” active manager does not add value, well-selected managers have demonstrated the ability to add value and/or reduce risk over the long term.

One approach to constructing a core-satellite portfolio is to use passive investments for efficient markets and active investments for less efficient markets. Many traditional asset classes, such as the U.S. equity market, are considered to be very efficient, making it difficult for active managers to outperform. Non-traditional asset classes, such as Emerging Markets equities or high yield bonds, are often considered less efficient. Many of these asset classes may be more difficult to access, can be less liquid, and are not covered as broadly by research analysts, which can enable active managers greater potential to add value.

The most critical step

Determining the appropriate asset allocation (mix of stocks, bonds and other asset classes) is the most important step when building your portfolio. Whether you use a passive strategy, an active strategy, or a combination of both, the addition of one, or more, satellite strategies to a core portfolio can potentially enhance returns, reduce risk and provide a better return/risk profile for your portfolio.

Simple to use All-in-One Core Portfolio ETFs

BMO ETFs offers a range of all-in-one Asset Allocation ETFs you can select as your core investment portfolio, based on your risk tolerance and time horizon. These ETFs are a one-ticket solution where the asset allocation is determined by professional managers, and where the asset allocation is automatically rebalanced for you on a regular basis to ensure you are on track to meeting your goals. They are low cost, and there is no double dipping on the fees (all-in MER of 0.20%* includes the cost of the underlying ETFs).  Examples include our BMO Balanced ETF (ZBAL), or BMO Growth ETF (ZGRO) and BMO All-Equity ETF (ZEQT).  Click Here to learn more.

Erin Allen has been a part of the BMO ETFs team driving growth since the beginning, joining BMO Global Asset Management in 2010 and working her way through a variety of roles gaining experience in both sales and product development. For the past 5+ years, Ms. Allen has been working closely with capital markets desks, index providers, and portfolio managers to bring new ETFs to market. More recently, she is committed to helping empower investors to feel confident in their investment choices through ETF education. Ms. Allen hosts the weekly ETF Market Insights broadcast, delivering ETF education to DIY investors in a clear and concise manner. She has an honors degree from Laurier University and a CIM designation.

* Management Expense Ratios (MERs) are the audited MERs as of the fund’s fiscal year end or an estimate if the fund is less than one year old since the audited MER of the ETF has not gone through a financial reporting period.

Any statement that necessarily depends on future events may be a forward-looking statement. Forward-looking statements are not guarantees of performance. They involve risks, uncertainties and assumptions. Although such statements are based on assumptions that are believed to be reasonable, there can be no assurance that actual results will not differ materially from expectations. Investors are cautioned not to rely unduly on any forward-looking statements. In connection with any forward-looking statements, investors should carefully consider the areas of risk described in the most recent simplified prospectus.

Commissions, management fees and expenses (if applicable) may be associated with investments in mutual funds and exchange traded funds (ETFs). Trailing commissions may be associated with investments in mutual funds. Please read the fund facts, ETF Facts or prospectus of the relevant mutual fund or ETF before investing. Mutual funds and ETFs are not guaranteed, their values change frequently and past performance may not be repeated.

For a summary of the risks of an investment in BMO Mutual Funds or BMO ETFs, please see the specific risks set out in the prospectus of the relevant mutual fund or ETF .  BMO ETFs trade like stocks, fluctuate in market value and may trade at a discount to their net asset value, which may increase the risk of loss. Distributions are not guaranteed and are subject to change and/or elimination.

S&P®, S&P/TSX Capped Composite®, S&P 500® are registered trademarks of Standard & Poor’s Financial Services LLC (“S&P”) and “TSX” is a trademark of TSX Inc. These trademarks have been licensed for use by S&P Dow Jones Indices LLC and sublicensed to BMO Asset Management Inc. in connection with the above mentioned BMO ETFs. These BMO ETFs are not sponsored, endorsed, sold or promoted by S&P Dow Jones LLC, S&P, TSX, or their respective affiliates and S&P Dow Jones Indices LLC, S&P, TSX and their affiliates make no representation regarding the advisability of trading or investing in such BMO ETF(s).The BMO ETFs or securities referred to herein are not sponsored, endorsed or promoted by MSCI Inc. (“MSCI”), and MSCI bears no liability with respect to any such BMO ETFs or securities or any index on which such BMO ETFs or securities are based. The prospectus of the BMO ETFs contains a more detailed description of the limited relationship MSCI has with BMO Asset Management Inc. and any related BMO ETFs.

BMO Mutual Funds are offered by BMO Investments Inc., a financial services firm and separate entity from Bank of Montreal. BMO ETFs are managed and administered by BMO Asset Management Inc., an investment fund manager and  portfolio manager and separate legal entity from Bank of Montreal.

BMO Global Asset Management is a brand name under which BMO Asset Management Inc. and BMO Investments Inc. operate.

®/™Registered trademarks/trademark of Bank of Montreal, used under licence.


Can you Invest solely in ETFs?

 Special to the Financial Independence Hub

As regular readers of MillionDollarJourney know, we are big fans of Exchange Traded Funds (ETFs) which are one of the fastest growing products in the market.

Were it not for the fact that financial firms and advisors have less incentives to sell ETFs than other investments such as mutual funds (that provide them with annual fees), the growth would probably be even more spectacular.

Having said that, ETFs don’t always have the best performance, and are sometimes outperformed significantly by other investment options. This also means that over years, the standard composition of most ETFs has shifted – with fixed income, commodities and FX now representing a much larger piece of the pie.

For most investors, ETFs represent the easiest and cheapest way to gain exposure in a variety of different sectors or asset classes. Investing in currencies or commodities was done by pension funds or hedge funds only a few years ago but it is now just as easy to do so for individual investors.

It might not be 100%, but a very large majority of individuals and professionals believe that portfolio diversification represents an important way to gain the same return but with lower risk. 20 years ago that meant buying bonds, private investments, etc. The major problem with that strategy is illiquid investments are often very expensive if you are not pouring a major amount of capital.

A prime example is looking at the prices of a bond when you are buying $50,000 worth. It is understandable of course that sellers will give better prices to buyers of millions of dollars as it is an easier trade for them. Take a few percentage points here and there and you will see just how much of an impact it can have over a life of savings and investing.

Investing in ETFs – Pros and Cons

So, should you invest mostly (or only) in ETFs? Here are some of the common pros and cons to help you decide:

ETF Investing Advantages

  • Most diversified
  • More tax efficient (read our article on capital gains in Canada)
  • Easiest and quickest way to invest

ETF Investing Disadvantges

  • Costs can be high, depending on the broker you use
  • Still has some investing risks

Should Canadians invest only in ETFs?

In many ways, ETFs provide a viable alternative as they offer the opportunity to get broad (corporate bonds) or specific (1-3 year treasuries) positions that will not cost you much in terms of commission.  Furthermore, ETFs will get you much better pricing and potentially much improved returns over the long term. Continue Reading…