Tag Archives: asset classes

Contrasting opportunities in Emerging Markets: FX, Equities and Bonds

By Bradley Krom, WisdomTree Investments

Special to the Financial Independence Hub

Year-to-date, more than US$32 billion has flowed in to emerging market (EM) exchange-traded funds (ETFs) in the U.S.1 As a consequence, EM equities, bonds and foreign exchange (FX) markets are outperforming most developed markets by a sizable margin. Despite a proliferation of choices over the last several years, WisdomTree continues to advocate a multiasset approach to EM. Below, we contrast the various risks and drivers of return for EM FX, equities and the fixed income market.2

How much risk (Volatility)?

One of the more puzzling issues for global investors is the general lack of volatility across major asset classes. Emerging markets are no exception. As the chart below shows,  returns have been strong and volatility has generally been declining, similar to other markets. In the case of EM equities, volatility has fallen to levels not seen since 2007.

Rolling 12-Month Volatility (%)

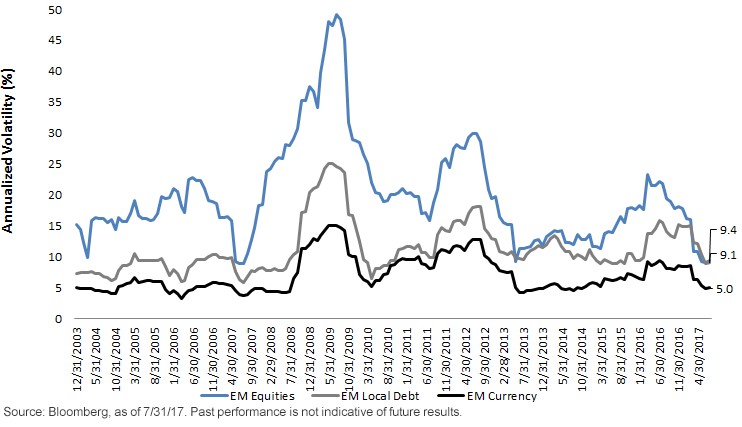
While we are not in the camp that says low volatility implies that a market correction is imminent, it is notable that EM equity volatility has dipped below EM local debt over the last 12 months. This is attributable to several factors, most notably the underlying currency exposure difference between the equity index and bond index.

Equities: More In Asia with lower FX volatility, Fixed Income more in Latin America with higher FX volatility

Due to underlying macro conditions, currencies in Asia tend to be less volatile than currencies in Latin America. EM equities have over 72% of their exposure in EM Asia compared to the EM local debt,3 which only has a 23% weight.4 Therefore, even though the underlying asset of equities may be higher than bonds, the overall exposures may not always tell the same story.

The last time volatility converged in this way was 2013 during the “taper tantrum.” For the 12 months ending June 30, 2013, returns between EM local debt and EM equities were similar (1.32% versus 2.87%). However, in the next 12 months ending June 30, 2014, EM equities outperformed EM local debt by over 1,000 basis points while maintaining comparable volatility. With volatility particularly difficult to forecast, we would continue to advocate EM equity risk over rate risk in the low-volatility, low-interest rate environment.

Drivers of Return

Continue Reading…

The hardest thing about being a stock investor

Stock market investors face a difficult challenge. While long-term stock market returns are quite attractive, in the short-term returns can be quite volatile.

This volatility can be difficult to stomach at times, especially when accompanied by worrying news flow.

Adding to the angst for Canadian investors can be the volatility of the Canadian dollar, yet it makes sense for Canadians to diversify globally.  It is important from time to time to review the historical evidence to help us manage our behaviour and stick with our investment plans.  Let’s review some of the long-term evidence:

Evidence*

“Long-term stock markets returns are quite attractive”

  • The average annual return of the S&P/TSX Composite index of Canadian stocks over the 60 years between 1957 and 2016 is 9.1%
  • The average annual return of the S&P500 index of large cap US stocks over the 91 years between 1926 and 2016 is 10%
  • The average annual return of the MSCI EAFE index of developed market stocks outside North America over the 47 years between 1970 and 2016 is 9.1%
  • Exposure to small-company stocks and low-valuation stocks has led to higher performance levels than that of market capitalization weighted indices over long periods of time

“In the short-term returns can be quite volatile”

Continue Reading…

Top global investment trends of 2017

By Sia Hasan

Special to the Financial Independence Hub

One of the most important things anyone can do for their future is to invest. There are many ways to build wealth over time if you start early and stay consistent no matter what the market is doing.

There are many global investment trends in 2017 that you need to know about. With all the changes that are going on around the world, this is one of the most important things you can look at changing in your personal finances. When it comes to investing, it pays to look at ways that you can improve constantly.

Real Estate

In many parts of the world, real estate is starting to heat up. With fewer properties on the market, many investors want to take advantage of real estate demand. In some developing nations, there are still opportunities to invest in growing areas. In certain places like the United States, the real estate market is so competitive that it is difficult to find a solid deal for the future. You always need to think five or ten years down the road when you are investing in real estate. This is true whether you are buying a home to flip or if you are just buying a home to rent out.

One other reason to consider real estate is that interest rates are still low. With the low rates, the amount of interest you have to pay on your debt is minimized and you can make more money as an investor. If you borrow money this year, it will be cheaper than in the future.

Equities (Stock Market)

When it comes to investing in the stock market, many are worried that we are in bubble territory. The stock market has been on a positive run for nearly a decade now. At some point, there is going to be a correction, and no one wants to invest right before a crash. If you are going to invest in the stock market, you need to have a plan for the future. Investing in the stock market is all about thinking many years down the road. Continue Reading…

Are you cut out to be a landlord?

Tenancy agreement, key and pen with symbolic miniature houseBy Marie Engen, Boomer & Echo

Special to the Financial Independence Hub

Buying an investment property is a popular option for many people looking for different ways to invest their money. Rental properties can provide you with steady monthly income and could appreciate in value over the years. But are you cut out to be a landlord?

Finding the right property

Finding the right property as an income producing investment is important. Do your homework. You want your rental to be attractively priced for your local market, and in a quality neighbourhood.

Related: How to invest in real estate

Consider a property that allows for multi-revenue, such as renting out the top floor and basement to different tenants.

If you’re handy you might consider a fixer-upper close to your home to renovate and maybe add a basement apartment.

Buying a property

To get approved for a mortgage you must put down 20% of the purchase price. Your mortgage lender will consider your credit score, income sources and market value of the property, just as with a personal mortgage. However, the key factor will be whether you can generate enough cash flow from the rental payments.

Continue Reading…

Protecting investment returns from Inflation

Prices Increase Showing Financial Report And Economy

By Robb Engen, Boomer & Echo

Special to the Financial Independence Hub

Earlier this year, the Financial Planning Standards Council (FPSC) updated the numbers it uses for projected investment returns and inflation. Financial planners use these numbers as guidelines when projecting retirement needs and income for their clients.

The FPSC’s latest guidelines for 2015 peg annual inflation at 2 per cent and make the following assumptions for investments returns (nominal returns, not adjusted for inflation):

  • Short term: 2.90 per cent
  • Fixed income: 3.90 per cent
  • Canadian equities: 6.30 per cent

Portfolio return assumptions

Planners (and investors) need to consider inflation in their retirement projections, so these numbers should be adjusted down by 2 per cent.

We also need to account for investment fees and expenses in order to calculate the net portfolio returns. The FPSC assumes the majority of Canadians are invested in mutual funds and therefore use a management expense ratio of up to 2.25 per cent for Canadian equity investments and 1.50 per cent for the fixed-income security portion.

This chart shows net portfolio returns (after fees, but before inflation) for three types of investors: conservative, balanced, and aggressive:

FPSC guidelines

Once adjusted for inflation these returns range from 0.80 per cent annually for the conservative investor to 1.70 per cent for the aggressive investor.

Do those numbers sound realistic? Conservative?

According to data collected by the Million Dollar Journey blog (and pulled from online financial resource, Money Chimp), the compound annual growth rate after inflation for the S&P 500 during any 30-year period dating back to 1950 was between 4.32 per cent and 8.42 per cent.

It appears as though the new FPSC guidelines are being cautious with future investment returns; although keep in mind they’re using Canadian equity markets in their assumptions, not U.S. or international markets. These guidelines also use the highest average investment expenses – which is unfortunately true for most Canadian investors – to calculate net portfolio returns.

Projecting returns for my clients

When projecting investment returns for my clients I use 5 percent annual growth for investments and a 2.5 percent annual target for inflation. That leaves a net return of 2.5 per cent annually: after inflation, but before investment costs.

Now keep in mind that most of my clients have switched from expensive bank mutual funds into low cost index funds or ETFs,  so their investment fees and expenses are a fraction of what the FPSC uses in its guidelines.

For example, a portfolio of TD e-Series funds with 25 per cent allocated to each of the Canadian index, U.S. index, International index, and Canadian bond funds has an average MER of just 0.42 per cent. If we use those costs for the aggressive investor in the FPSC guidelines then the net portfolio return now equals 5.2 per cent after costs and 3.2 per cent when adjusted for inflation. Not bad.

Assumptions for my own portfolio

For my personal retirement planning assumptions I use an 8 per cent nominal return on my investments (remember, I’m 100 per cent in equities – both domestic and international – with my two-ETF solution).

The total costs for my portfolio each year is just 0.29 per cent, which leaves a net portfolio return of 7.71 per cent. I peg inflation at 2.50 per cent annually. That leaves inflation adjusted investment returns of 5.21 per cent for my retirement portfolio.

Why costs matter

The main takeaway from looking at these guidelines shouldn’t be which number to arbitrarily attach to your projected investment returns in order to boost your retirement income. Even inflation, although real, is largely out of your control.

What you can control is your investment costs. Fees matter; and the difference between a low-cost portfolio of index funds and a smattering of expensive bank mutual funds could mean the difference between your portfolio handily beating inflation over time or just treading water and barely keeping up.

What assumptions do you use when projecting investment returns and inflation?

RobbEngenIn addition to running the Boomer & Echo website, Robb Engen is a fee-only financial planner. This article originally ran on his site on July 26th and is republished here with his permission