Tag Archives: indexing

This is Easy Street for Canadian investors

By Dale Roberts

Special to the Financial Independence Hub

Investing is simple. We are all familiar with the KISS acronym. Simplicity is the key to successful investing. I have been reading and studying investing and investment strategies for decades and came to the conclusion that for the most part “nobody knows nothing.”

Great. All that research and tens of thousands of hours of study and I came back to the fact that I don’t need to know much at all. What a complete waste of time? No not at all. The thousands of hours of study showed me why I, we, don’t need to know much. We do not need to be experts when it comes to investing. As I like to write: It ain’t rocket surgery. Here’s how you find Easy Street.

What is an investment portfolio? In its basic form we can think of a portfolio as having two components: great companies for greater growth potential and bonds to manage the risk. Those bonds work like shock absorbers on the portfolio to reduce the risk or volatility. The more bonds in the portfolio, the lower the risk level of the portfolio.

A typical portfolio will hold great blue-chip companies (stocks) such as Apple, Google, Microsoft, Facebook, Johnson & Johnson, Berkshire Hathaway (Warren Buffett’s company), Coca-Cola and on and on. On the Canadian side we’ll hold Tim Hortons, the big Canadian banks, the telco companies such as Bell, Rogers and Telus, plus railroad companies such as CN and CP Rail and major energy players such as Suncor and Enbridge and on and on.

The rich are business owners

We know that the richest people on earth are usually business owners. We’re going to join them. We’re going to own a piece of those businesses. When enough of those companies do well, you do well. And certainly not every business is going to do well: that’s why you own a bunch of ’em. And that’s why you’ll own great companies in Canada, US and around the globe. And we don’t have to know how to analyze those companies, we can simply go and buy the ‘entire’ stock market. Here’s What is Index Investing and why it’s simply a superior form of investing. It’s so easy we call it Couch Potato Investing.

And back to risk or volatility. Certainly stock markets mostly go up over time, but they do correct or go down with regularity; it’s a normal and expected part of investing. For the potential of those 9-10% annual returns from stocks we need to accept some risk. Keep in mind that stocks can go down by 50% in major stock market corrections. That’s not everyone’s cup of tea to watch their investment portfolio get cut in half. That’s why many or most investors will need some bonds in the portfolio. Bonds are fixed-income investments and are typically less risky than stocks. A bond pays you a fixed payment on a regular basis and bonds can also go up in value when stocks go down – think teeter totter.

A portfolio with a very generous amount of bonds would have only decreased by about 10%-15% in the last major market correction. For the period of 2008 to end of 2009, here’s a comparison of the US stock market (S&P 500) as Portfolio 1, and a Balanced Portfolio as Portfolio 2.

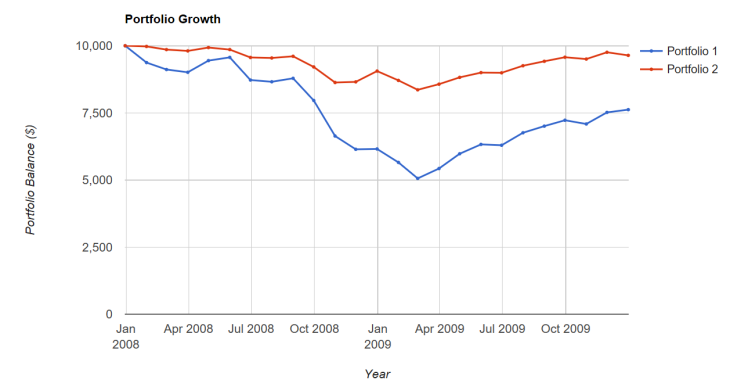
We see that the all-stock portfolio declined by 50% while the Balanced Portfolio with a 70% bond component declined by just over 15%. By the end of 2009 that conservative Balanced Portfolio is almost back in positive territory while the all-stock portfolio still has more of that hill to climb.

Percentage in Bonds a critical decision

The most important decision that will be made, or the most important question answered will be “What percentage of bonds do you need?” What is your risk tolerance level? What roller coaster do you want to ride? You get to decide. Continue Reading…

Simple investing isn’t easy

By Steve Lowrie, CFA

Special to the Financial Independence Hub

In my last post I covered why simplicity often beats complexity, especially when investing.  To quote myself:  “Simplicity is … the art of designing good, simple habits you can effectively implement and readily sustain.”  This keeps you on track toward your personal financial goals, with minimum fuss and maximum cost-management.

So why doesn’t everyone invest simply?  Because it isn’t easy.  We’re often done in by a host of human habits like fear, greed, loss aversion and herd mentality.  These and many other instinct-driven biases trick us into abandoning our good, simple plans whenever the next “all you need to do …” trend comes along.

All you need to do is buy some dividend-paying stocks and you’ll have the income you need.”

All you need to do is buy a few ETFs and you’ll be all set.”

All you need to do is buy a couple hours of financial advice to get you up and running.”

While dividend-paying stocks, ETFs and hourly advice might still have valid roles to play in your plans, these sorts of “how to invest” fads shouldn’t override why you’re investing to begin with.  Plain and simple, your “why” should be guided by your long-term financial goals, like how much wealth you’d like to create or preserve over what period of time.  Your “how” should be grounded in robust academic evidence and time-tested solutions.

Unfortunately, the data tells us investors are often unable to take it easy on hyperactive trading.  For example, a 2017 Vanguard white paper, “Principles for Investing Success,” found that investors would move in and out of mutual funds and ETFs alike in reaction to market mood swings.  They’d also pile into and out of funds according to recent Morningstar ratings.  Instead of patiently embracing an efficient, long-term discipline, they were buying hot, high-priced funds and selling them low, after they’d cooled off.

Vanguard concluded (emphasis ours): “Investors should employ their time and effort up front, on the plan, rather than in evaluating each new idea that hits the headlines.  This simple step can pay off tremendouslyin helping them stay on the path toward their financial goals.”

Simple?  You bet.  Easy?  The evidence suggests otherwise.  That’s why I prefer to work with families upfront and ongoing with respect to their planning and investing.  That’s the only true way I know to ease their way over the long haul.

Steve Lowrie holds the CFA designation and has 25 years of experience dealing with individual investors. Before creating Lowrie Financial in 2009, he worked at various Bay Street brokerage firms both as an advisor and in management. “I help investors ignore the Wall and Bay Street hype and hysteria, and focus on what’s best for themselves.” This blog originally appeared on his site on June 5, 2018 and is republished here with permission. 

Why simplicity beats complexity

Special to the Financial Independence Hub

Complexity. It’s hard to avoid.  Tune into the news, and something’s always breaking.  Even in your own life, how many “other” tasks get in the way of the good stuff?

I’m not suggesting you should only do what is immediately gratifying.  There’s considerable enjoyment to be found in taking on tough challenges.  But today I want to focus on why simplicity beats complexity, especially when it comes to your personal finances.

Simplifying your investments

When it comes to writing about investments why reinvent the wheel?  I agree with every point “A Wealth of Common Sense” blogger Ben Carlson makes in this excellent piece, “Why Simple Beats Complex.”  Instead of writing an overly repetitive post, I recommend you give this a read.  Basically, we are prone to using our oversized brains to over-complicate things, especially investments.  Simple advice:  Don’t do that.

Simplifying your finances

While I don’t want to split hairs, there is a subtle, but incredibly important difference between financial goals, financial plans and financial planning.  Knowing the difference helps simplify all three. Continue Reading…

My journey to Passive Index Investing – Part 1

Special to the Financial Independence Hub

“If I were you, I would check out ETFs.”

And that’s how it started.   An idea was planted in my head.   A little nudge from a friend of mine.   This was back in 2009, when Exchange-traded Funds (ETFs) were not widely known.   I had never heard of the term before, and I did not know much about investing apart from hearing whispers  that I should just go to MD Management, hand over my money and let them “handle it.”

I was just finishing up with residency/fellowship, and was about to embark on my first staff physician job.  Since my pay cheque was about to dwarf my resident’s salary, I figured I should probably know the basics about investing, so I asked my friend for his advice.   At the time, he was working as a financial advisor at Bank of Montreal (BMO) with “high-net worth clients” (portfolios over $1 million); thus he seemed like a good resource to start with.  Looking back, I am extremely grateful for his honesty and transparency, as he could’ve easily recommended that I hand over my money and let him “handle it.”

I asked him what he recommended to his “high-net worth clients” to invest in.   His answer: BMO mutual funds.  Made sense, since he was at BMO.

Not all advisors invest alongside their clients

Then I asked him what he invested his own money in.  To my surprise, he invested his own money in ETFs, and did not hold a single BMO mutual fund.  I had always thought “wealthy” clients had access to the “best” investment products, so naturally, he would have done the same.

What???   I was confused!

Paraphrasing his answer:   “At the beginning of each month, financial advisors are told to recommend specific mutual funds to their clients in order to meet quotas, which in turn results in bonuses/commission fees.   The funds usually have a high MER (2% and above).   It lines my pockets and the bank’s pockets.  If I were you, I would check out ETFs.”

Looking back, I realize my friend was not your typical financial advisor.  He enjoyed reading books on personal finance/investing topics, and was quite knowledgable about investing.  Needless to say, he become disillusioned with the banking industry with all the sales tactics and the commissions and quotas driven nature of it all.   Not long after our conversation, he left the banking industry to pursue a career in a different industry that made him much happier.

Continue Reading…

A snapshot of Canadian investors’ appetite for risk: Vanguard’s Canadian risk speedometers

Figure 1: Vanguard’s Canadian risk speedometers, September 30, 2017

By Todd Schlanger, Senior Investment Strategist, Vanguard Canada

(Sponsor Content)

As part of Financial Literacy Month in Canada, we are proud to announce the launch of Vanguard’s Canadian risk speedometers.

These speedometers were originally designed by my colleagues in the United States to provide a factual representation of how investor risk appetite is trending today, relative to the past.

In order to generate the speedometers, we calculated net cash as a percentage of total assets under management, (in this case, within the universe of Canadian mutual funds and ETFs) into high-risk and low-risk asset categories. We then looked at the relative cash flows into high- versus low-risk asset classes, relative to history.

The end result is a risk measure that can be tracked through time and displayed in a risk speedometer index, as shown in Figure 1 over the 1-, 3-, and 12-month periods ending September 30, 2017. When risk appetite is above its historical average — such as over the 12-month period — the needle is to the right of centre, indicating higher risk appetite. When the needle is to the left of centre, risk appetite is below average. In addition to the current risk appetite readings, we also display the prior 1-, 3-, and 12-month readings for comparison.

Notes: Vanguard’s risk speedometers measure the difference between net cash flows into higher-risk asset classes and lower-risk asset classes, in this case within the universe of Canadian mutual funds and ETFs. The lighter-shaded areas represent values that are within one standard deviation of the mean, which means they occur roughly 68.2% of the time (34.1% higher and 34.1% lower). The middle shades represent readings between one and two standard deviations from the mean, occurring 27.2% of the time (13.6% higher and 13.6% lower). The dark edges represent values more than two standard deviations from the mean, occurring the remaining 4.6% of the time (2.3% higher and 2.3% lower). Speedometer values for previous periods may change from what was initially reported as the current value in prior periods because of changes made in Morningstar, Inc., data, and to the updating of the five-year average.

Along with the risk speedometers, we will be providing underlying asset category details (the top winners and losers in each category) in terms of net cash flows and changes in assets under management that resulted in the current risk appetite readings, as shown in Figure 2 (for the same periods, ending September 30, 2017).

Figure 2: Highest net inflows and outflows Continue Reading…