Tag Archives: indexing

Low future returns? The coming bull market in advice

A bull market in advice? This novel idea is the basis of my latest Motley Fool blog, which came out of the 2017 Vanguard Investment Symposium held this Tuesday.

Hopefully, the title is self-explanatory. Click on the highlighted text to access the whole blog: Lower future returns from balanced portfolios means a bull market in advice.

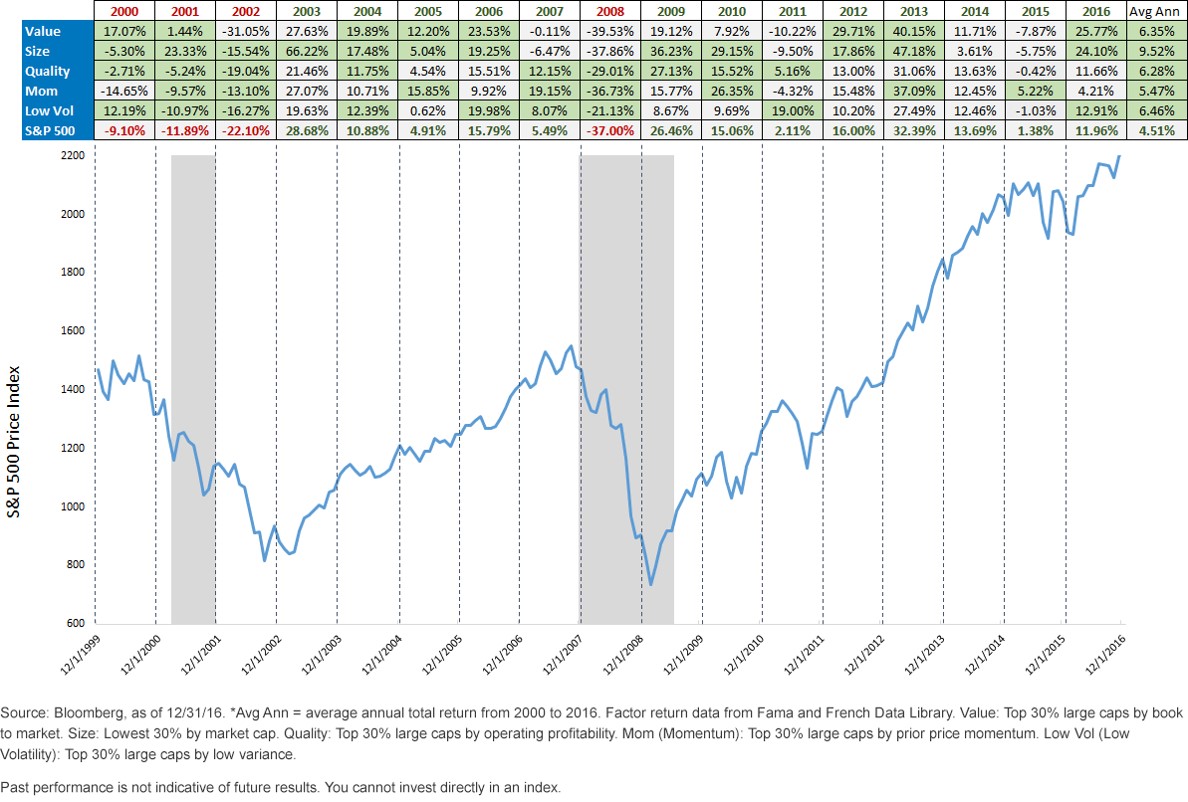
Click through to get Vanguard’s forecasts for future returns. Suffice it to say that they don’t believe the next five years will be as good as the last five years have been for balanced investors.

All of which means good financial advice will be at a premium.  Naturally, Vanguard believes that the lower expected future investment returns are, the more important it is to reduce costs and taxes, which of course its low-cost index funds and ETFs facilitate. But it also believes advisors can help investors by addressing the so-called  “behaviour gap.” It’s been well documented that poor investing behaviour (buying high, selling low) are destructive to returns, which is why a good financial advisor can more than recoup his/her fees.

Advisors can add 3% value per a year

Many fee-based advisors use the kind of investment funds Vanguard provides and Vanguard believes good advice can “add value” of roughly 3% per year to clients’ investment returns.

Behavioural coaching is the single biggest value-add: 150 basis points (1.5%). “Staying the course is difficult,” but “a balanced diversified investor has fared relatively well,” said one Vanguard presenter quoted in the Motley Fool piece, Fran Kinniry.

Behavioural coaching is followed closely by 131 beeps for cost-effective product implementation (using low expense ratios). This alone can add 1 to 2 percentage points of value, Vanguard says, attributing the finding to “numerous studies.” Rebalancing accounts for another 47 beeps, and Asset Location between 0 and 42 beeps (as opposed to Asset Allocation, which it says adds “more than 0 beeps.”)

A proper spending strategy (identifying the order of withdrawals in the decumulation stage) accounts for another 0 to 41 beeps. All told, the potential value added comes to “about 3%,” Kinniry says.

Vanguard says a “strong move to fee-based” compensation is accelerating. In 2015, 65% of advisors’ compensation came from asset-based fees, while wealthier investors are “most willing to pay AUM-based fees.” Gradually this will ‘flow down” to less well-heeled clients, “as smaller balances can now be well-served” in a fee-based model because of scale and technology.

Using Cerulli data from 2015, Vanguard estimates the median asset-weighted advisory fee is 1.39% for the mass market ($100,000 assets), 1.28% for the middle market ($300,000), 1.09% for the mass-affluent market ($750,000), 0.92% for the affluent market ($1.5 million to $5 million) and 0.70% for the High Net Worth market ($10 million or more).

On average across all clients, the median fee is 1.07%.


Do you need to “De-FANG” your portfolio of giant US tech stocks?

Do you need to De-FANG your portfolio or are you so focused on Canada that you’re actually underweight on the big US tech stocks?

My latest MoneySense column looks at the post-Trump surge in tech stocks and the more recent retrenchment in the sector. For the full article, click on the highlighted text here: Do you need to de-FANG your portfolio.

FANG is of course the famous acronym created by Mad Money’s Jim Cramer and stands for Facebook, Amazon, Netflix and Google.

But as the piece goes into in some detail, and per the image above, there are alternative acronyms that include Apple and Microsoft, although not IBM (despite the graphic above).

The question is whether so-called “Couch Potato” type investors who use the MoneySense ETF All-stars already have sufficient technology exposure to participate in the expected long-term growth of technology and particularly Internet giants like Google, Facebook, Amazon and the like. Certainly after last week’s  big announcement that Amazon seeks to acquire Whole Foods, this question is increasingly relevant.

As you’ll see, broad-based ETFs tracking the S&P500 index already have significant tech exposure: roughly a third in these names. Less so for global ETFs exposed to firms outside North America, although these too have healthy exposure to the sector.

Canadian-centric investors woefully underweight technology

Continue Reading…

How to add value in the Great Migration from mutual funds to ETFs


By Luciano Siracusano III, Chief Investment Strategist, WisdomTree

and Christopher Carrano, Investment Analyst


Over the past few years, as hundreds of billions of dollars has flowed out of equity mutual funds and into exchange-traded funds (ETFs), a great migration of assets has been under way in the asset management business. This is occurring because of the changing business models of advisors and brokers-dealers and because of the unique benefits that ETFs can bring to investors, including relatively lower fees1, transparency of holdings, intraday liquidity and the potential for greater tax efficiency.

In many cases, “low-cost beta” ETFs, which track broad indexes, have outperformed the vast majority of active managers over time.2 This has made the decision to move assets from actively managed mutual funds into ETFs not just a decision based on cost, but also one based on performance.

But investors making this migration today have a choice that goes beyond just low-cost beta. For the past 10 years, WisdomTree has been showing investors ways to generate “low-cost alpha” in the form of fundamentally weighted ETFs that provide broad market exposure but that rebalance equity markets based on income, not market value. In recent years, other ETF managers have followed similar paths, creating narrower exposures that seek to tap into return premiums such as value, size, qualitymomentum or low volatility—all of which have been associated with generating excess returns versus the market over time.

In the table above, we show how portfolios targeting value, size, quality, momentum and low volatility have performed compared to the S&P 500 Index in each calendar year since 2000. The last column on the right shows the annualized returns of these factor-based baskets over the 16-year period. Note that in each and every case, the annualized returns exceeded those of the broader market over the entire holding period.

Factors’ long-run performance

Yet, it is important to note that, despite all five of these factors outperforming the S&P 500 since 2000, they did not do so in each and every year. Factors are subject to the ebbs and flows of the business cycle, much like the sectors of the S&P. But, unlike factors, it is impossible for every sector of the S&P 500 to individually and collectively outperform the entire S&P 500 Index over time. The appeal of factor-based investing is that these major return premiums, based on decades of data, appear not to be subject to this same constraint.

Continue Reading…

Why Robb Engen’s 4-minute RRSP portfolio is tough to beat

I spent a total of four minutes working on my RRSP portfolio last year.

It wasn’t benign neglect:  my two-ETF all-equity portfolio really is that simple! I made four trades, which took about a minute each after determining how much money to invest, in which of the two ETFs to allocate the investment, and how many shares that would buy (plus a few seconds to enter my trading password).

The buying process is easy since I don’t have any bonds in my portfolio. I simply add money to the fund that brings my portfolio closest to its original allocation – 25 per cent VCN and 75 per cent VXC.

I don’t expect my four-minute portfolio to change much this year. I still plan on making four trades this year in my RRSP, and now that I’m contributing regularly to my TFSA again I’ll make an additional four trades in that account. Add 12 monthly contributions to my RESP and that brings my total time spent on investing to just 20 minutes a year.

Continue Reading…

Sorry but this is one broken record worth listening to …

Needle head and broken vinylLast month S&P Global published its 2016 mid-year SPIVA Canada Scorecard, which compares the performance of actively managed Canadian-based mutual funds with their benchmarks.

The conclusion is clear: actively managed funds, after fees, underperform their benchmarks over time.  Investors may be better served using passively managed alternatives such as index tracking mutual funds and exchange traded funds (ETFs).

This evidence is so consistent and presented so often it almost sounds like a broken record, but given how many Canadians still pay high mutual fund fees for under-performing funds, we believe it’s a broken record still worth listening to.

Before we dive into the data, it’s worth noting a few important methodological points highlighted by S&P:

  1. The study compares the performance of each fund to that of a benchmark selected to provide a sensible “apples to apples” comparison.
  2. The survey looks at both “asset-weighted” and “equal-weighted” average fund performance and the conclusions drawn are similar.
  3. The study accounts for “survivorship bias”, that is it includes funds that were closed or merged with other funds over the relevant time period.

Many funds don’t even survive, let alone outperform

This last point is really important.  According to the study, only 58% of Canadian Equity funds actually survived the last 5 years.  One can only assume that those funds that didn’t survive were not stellar performers.  US and International Equity funds fared a little better with 70% of US funds and 84% of International funds surviving the full 5 years.

So how many funds survived and outperformed their benchmark?  In the Canadian Equity category, only 29% of actively managed funds outperformed their benchmark over the last 5 years.  Those aren’t very good odds considering that it’s nearly impossible to predict in advance which funds are likely to outperform.

Diversifying outside Canada important, but performance of active US and International Equity funds is worse

The Canadian stock market is fairly concentrated in certain industries and specific large cap stocks so it’s important for Canadian investors to diversify outside of Canada.  Unfortunately those looking to diversify using active US and International Equity funds won’t be happy with the SPIVA results.  Only 14% of International Equity funds outperformed their benchmark and 0% (yes, none!) of US Equity funds outperformed their benchmark over the 5-year period.

So maybe you’re feeling lucky and think your Canadian Equity manager has some sort of advantage and will be one of the lucky out-performers.  Once you look to diversify outside of Canada (and you should) the odds drop dramatically (and infinitely in the case of US Equity managers!)

The study only takes us to half-way through 2016.  We wonder how active fund managers have fared through the latter half of the year with such tumultuous events as the US election.  Given that most market pundits not only didn’t predict the outcome of the election correctly but missed how the market would react in response leads us to believe that when the next SPIVA scorecard is published, the same old broken record will still be spinning.

The data speaks for itself but we’ll conclude by saying that when you invest in “the market” by holding passive investment funds or ETFs, you get the market return with a fair degree of certainty. You will not experience the additional uncertainty of whether your chosen active fund will outperform or underperform the market.

Peer reviewed academic data shows that over longer periods of time very few active funds are able to outperform the market and those funds that do are nearly impossible to identify in advance.  The fees for passive investment funds and ETFs are much lower than those for active funds. Again, active fund management comes with lower average investment returns after fees and less certainty of performance versus the market.

graham-bodelGraham Bodel is the founder and director of a new fee-only financial planning and portfolio management firm based in Vancouver, BC., Chalten Fee-Only Advisors Ltd. This blog is republished with permission: the original ran last Friday (November 18th) here.