By Fritz Gilbert, RetirementManifesto.com
Special to the Financial Independence Hub
Call me a nerd, but I love studying retirement statistics (for the record, I prefer to consider myself curious). When something as dramatic as COVID comes along, it really makes the numbers interesting.
If you’re curious like me, you’ll enjoy today’s post. A compilation of some fascinating retirement statistics I recently came across, including some graphs for those of you who prefer to view the charts.
If you’re interested in how you compare to “average,” you’ll also find today’s post of interest. Wondering what impact COVID has had on retirement confidence? We’ve got that covered, as well.
Curiosity-seekers, unite. This one is for you …
What’s retirement really like? What impact has COVID had? Today, a look at some fascinating retirement statistics.
Fascinating Retirement Statistics
A while back, as I was doing some research for my post titled The Mad Retirement Rush of 2020, I came across an article with some interesting retirement statistics and saved the link into a draft post (I do that a lot, with over 100 draft posts currently holding ideas for future posts). I wanted to do further research on retirement statistics to see how many I could compile for a dedicated post on the topic.
Today, I’m pleased to publish the resulting work and share what I’ve found during my research. A variety of fascinating retirement statistics, dedicated to all of the fellow retirement nerds in the house.
With that, let’s dig into some numbers:
Retirement Readiness Statistics
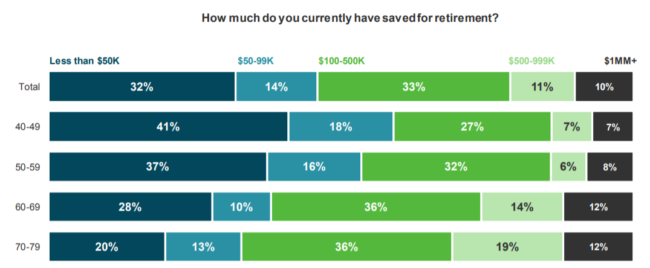
- Nearly 2/3 of 40-year-olds have <$100k saved for retirement (Source: TDAmeritrade Retirement Survey)
- 51% of Baby Boomers are still paying on their mortgage in retirement, and 40% struggle to pay off their credit card debt. (Source: Legaljobs.com)
- 1 out of 12 Americans believes they’ll never retire at all. (Source: Legaljobs.com)
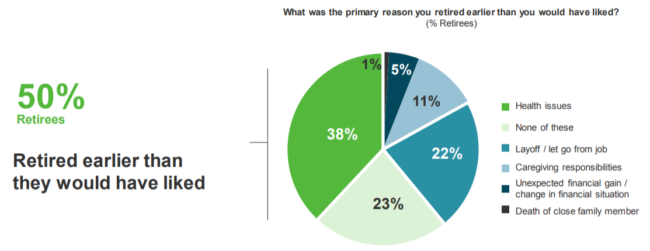
- 50% of retirees retired earlier than they would have liked. (Source: TDAmeritrade Retirement Survey)
- 73% of retirees say their retirement was a “full-time stop,” with only 19% experiencing a gradual transition (e.g., fewer hours). Among those still working, half expect a gradual transition. Related, only 30% of retirees work for money in retirement, whereas 72% of workers expect to work for some pay in retirement. (Source: 2021 EBRI Retirement Confidence Survey)
- The average US household had $255,000 in their retirement accounts in 2019, a 5% increase from 2016 (Source: MagnifyMoney)
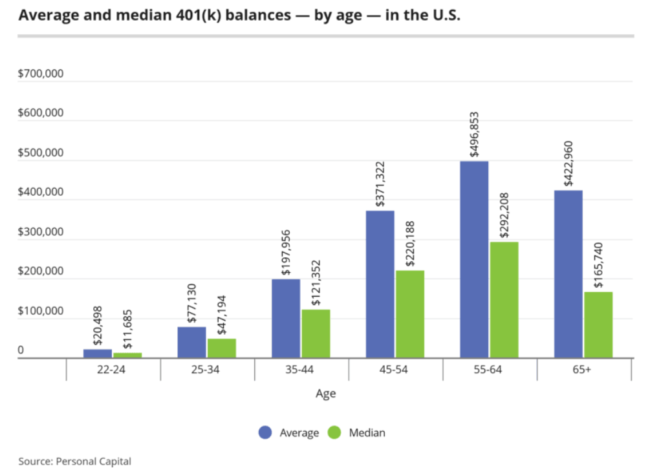
- Among those with 401(k), the average balance by age is shown below: (source, Personal Capital as cited in MagnifyMoney)
COVID’s Impact on Retirement Confidence
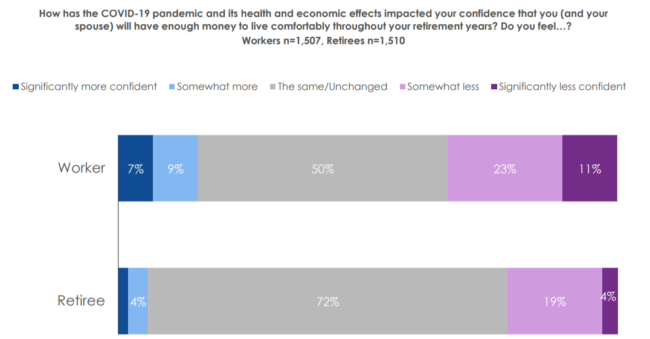
- While the majority of workers are still confident of their ability to retire, 34% of workers are less confident in their ability to live comfortably in retirement than they were pre-COVID.
- COVID has caused 1 in 4 workers to adjust their expected retirement date, with 17% now planning to retire later and 6% who plan to retire earlier.
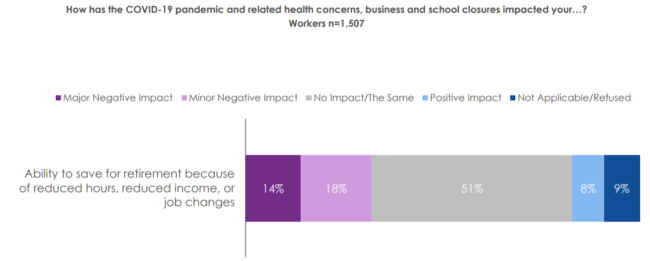
- 32% of workers say COVID has negatively impacted their ability to save for retirement.
All statistics in the above section compliments of 2021 EBRI Retirement Confidence Survey
- 30% of Americans with retirement accounts reported making withdrawals from them in the first two months of the COVID pandemic. The average withdrawal was $6,757 (Source: Investment News)
Baby Boomer Statistics
- Every day, 10,000 Baby Boomers turn 65 years old. (Source: Legaljobs.com)
- 8 in 10 retirees report that their overall lifestyle is as expected or better. Only 26% of retirees report spending is higher than expected. (Source: 2021 EBRI Retirement Confidence Survey)
- Baby Boomer retirements increased significantly in 2020 vs. prior years. By September 2020, 40% of Baby Boomers were retired. (Source: Pew Research) Continue Reading…

