Letting unnecessary stock market worries take hold of your investment decisions can lead to much bigger problems than just finding stocks to buy
TSInetwork.ca
Our early ancestors had to be on guard against threats in their environment. They were under constant threat. At night, if you woke to every sound from the bushes, you lost some sleep, but you cut your risk of being eaten by a lion or killed by an enemy. Today we face much less risk from animal predators and human marauders. But many people still carry this hair-trigger fear response. We spend more time than we should worrying about things that will never happen. This includes stock market worries.
That’s especially true of investors, who generally think more about the future than other people. It’s true all the more of subscribers to our newsletters and members of my Inner Circle service.
Understand stock market worries and risk so you can put everything in perspective
That’s because many of you are the kind of people who seek out investment information from a variety of written sources, where it’s much more extensive and detailed than what you get from a glance at the headlines, the evening news or cable TV. However, some of that information is biased, overblown or incorrect.
This doesn’t mean you should ignore potential threats. You just need to put them in perspective.
Learn what experienced investors do about common stock market worries
There is never a shortage of ways to ease your stock market worries. “You never go broke taking a profit,” is a favourite of brokers I’ve met over the years. They used them to spur their clients to do more trades, to boost their own commission income.
Our view now is that stocks are still a good place for your money, if you can afford to stay invested for several years. If you expect you will need to take money out of your portfolio, you should think about selling sooner than you need to.
Look beyond immediate stock market movements to help reduce your anxiety and stock market worries
Stock market trends are the general direction in which the stock market is heading. These market trends are dictated by a number of factors: what sector investors favour at the moment, economic and world news, interest rates and other trends from industries such as technology or resources, and so on. These trends could be positive or negative, and they could lead to a huge boom for a stock market. They could also lead to a big downturn. Continue Reading…
There is a basic principle that most people follow when it comes to their spending decisions. In essence, people generally try to either
(1) Get the most they can for the least amount of money, or
(2) Spend the least amount of money on the things they want (i.e. get the best deal)
In other words, rational utility maximizers try to be as efficient as possible when parting with their hard-earned dollars.
Strangely, many investors abandon this principle when it comes to their portfolios. With investing, what you get is return (hopefully more than less), and what you pay (other than fees) is risk. People often focus on return without any regard for the amount of risk they are taking. Alternately, many make the mistake of reducing risk at any cost, regardless of the magnitude of potential returns they leave on the table.
The foundation of successful investing necessitates achieving an optimal balance between return and risk. Different types of assets (volatile speculative stocks, stable dividend paying stocks, bonds, etc.) have very different risk and return characteristics. Relatedly, a portfolio’s level of exposure to different asset classes is the primary determinant of its risk and return profile, including how efficient the balance is between the two.
Offense, Defense, & Bobby Knight
Robert Montgomery “Bobby” Knight was an American men’s college basketball coach. Nicknamed “the General,”h e won 902 NCAA Division I men’s basketball games, a record at the time of his retirement. He is quoted as saying:
“As coaches we talk about two things: offense and defense. There is a third phase we neglect, which is more important. It’s conversion from offense to defense and defense to offense.”
Nobody can escape the fact that you can’t have your cake and eat it too. You can’t increase potential returns without taking greater risk. Similarly, you can’t reduce the possibility of losses without reducing the potential for returns.
Picking up Pennies in Front of a Steamroller vs. Shooting Fish in a Barrel
Notwithstanding this unfortunate tradeoff, there are times when investors should focus heavily on return on capital (i.e. being more aggressive), times when they should be more concerned with return of capital (i.e. being more defensive), and all points in between.
Sometimes, there is significantly more downside than upside from taking risk. Although it is still possible to reap decent returns in such environments, the odds aren’t in your favour. Reaching further out on the risk curve in such regimes is akin to picking up pennies in front of a steamroller: the potential rewards are small relative to the possible consequences. At the other end of the spectrum, there are environments in which the probability of gains dwarfs the probability of losses. Although there is a relatively small chance that you could lose money in such circumstances, the wind is clearly at your back. At these junctures, dialing up your risk exposure is akin to shooting fish in a barrel – the likelihood of success is high while the risk of an adverse event is small.
John F. Kennedy & the Chameleonic Nature of Markets
Former President John F. Kennedy asserted that “The one unchangeable certainty is that nothing is certain or unchangeable.” With regard to markets, the risk and return profiles of different asset classes are not stagnant. Rather, they change over time depending on a variety of factors, including interest rates, economic growth, inflation, valuations, etc.
Given this dynamic, it follows that determining your optimal asset mix is not a “one and done” treatise, but rather a dynamic process that takes into account changing conditions. Yesterday’s optimal portfolio may not look like today’s, which in turn may be significantly different than the one of the future.
It’s not just the risk vs. return profile of any given asset class that should inform its weight with portfolios, but also how it compares with those for other asset classes. As such, investors should use changing risk/return profiles among asset classes to “tilt” their portfolios, increasing the weights of certain types of investments while decreasing others.
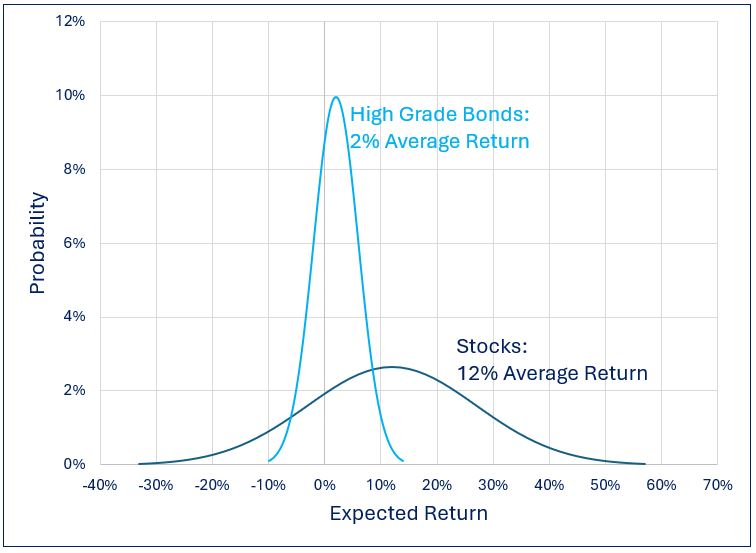
In “normal” times, the expected return from stocks exceeds the yields offered by cash and high-grade bonds by roughly 3% per annum. However, this difference can expand or contract depending on economic conditions and relative valuations among asset classes.
In the decade plus era following the global financial crisis, not only did rates remain at historically low levels, but the prospective returns on equities were abnormally high given the positive impact that low rates have on spending, earnings growth, and multiples. Against this backdrop, the prospective returns from stocks far exceeded yields on safe harbour investments. Under these conditions, it is no surprise that investors who had outsized exposure to stocks vs. bonds were handsomely rewarded.
Expected Return on Stocks vs. Yield on High Grade Bonds: Post GFC Era
As things currently stand, the picture is markedly different. Following the most significant rate-hiking cycle in decades, bonds are once again “back in the game.” Moreover, lofty equity market valuations (at least in the U.S.) suggest that the S&P 500 Index will deliver below-average returns over the next several years. Continue Reading…
A key concern many investors have at the moment is the impact of Trump’s tariffs on goods produced outside the U.S. on the markets. I’m hearing from those wondering if they should do something to protect their wealth; their primary question is: What should I do with my investments?
My answer (as it usually is when investors are concerned about the geopolitical impact on the markets): stick with the plan because, by the time the news is public and you become concerned, the markets have already accounted for it/priced it in, so any reaction you take is too late.
A useful historical reference on tariffs is President Trump’s first term. Starting in 2017, his administration targeted China, implementing tariffs on a broad range of products by 2018. The following years saw ongoing trade negotiations that led to an agreement, though many tariffs remained. Despite the uncertainty, both U.S. and Chinese markets outperformed the MSCI World ex USA Index over Trump’s four-year term. Have a look at the data from 2017 to 2020, as Dimensional compares China MSCI Index to US S&P 500 Index to MSCI World ex USA Index.
Markets are forward-looking, meaning that the potential economic effects of tariffs are likely already factored into current prices. As a result, when these anticipated changes materialize, their impact on markets may be limited.
Understanding how Market Pricing Works
Let’s talk about the price of stocks.
It stands to reason: To make money in the market, you need to sell your holdings for more than you paid. Of course, we’re all familiar with good old “buy low, sell high.” But despite its simplicity, many investors fall short. Instead, they end up doing just the opposite, or at least leaving returns on the table that could have been theirs to keep.
You can defend against these human foibles by understanding how stock pricing works and using that knowledge to your advantage.
Good News, Bad News, and Market Views
How do you know when a stock or stock fund is priced for buying or selling?
The short answer is, we don’t.
And yet, many investors still let current events dominate their decisions. They sell when they fear bad news means prices are going to fall. Or they buy when good news breaks. They invest in funds that do the same.
While this may seem logical, there’s a problem with it: You’re betting you or your fund manager can place winning trades before markets have already priced in the news.
To be blunt, that’s a losing bet.
You’re betting that you know more about what the price should be at any given point than what the formidable force of the market has already decided. Every so often, you might be right. But the preponderance of the evidence suggests any “wins” are more a matter of luck than skill.
Me and You against the World
Whenever you try to buy low or sell high, who is the force on the other side of the trading table?
It’s the market.
The market includes millions of individuals, institutions, banks, and brokerages trading hundreds of billions of dollars every moment of every day. It includes highly paid analysts continuously watching every move the markets make. It includes AI-driven engines seeking to get their trades in nanoseconds ahead of everyone else.
And you think you can beat that?
We believe it’s far more reasonable to assume, by the time you’ve heard the news, the collective market has too, and has already priced it in.
News of a recession, under way or avoided? It’s already priced in.
Inflation on the rise, or abating? It’s already priced in.
A company suffers a calamity or makes a major breakthrough? It’s already priced in.
The government passes critical legislation that helps or hinders global trading? It’s…
And so on. Here’s your best assumption:
If it’s public knowledge, it’s already priced in.(And if it’s insider information, it’s illegal to trade on it.)
What we don’t yet Know
As soon as an event is priced in, several things make it difficult to profitably trade on the news:
You’re Buying High, Selling Low: If you trade on news after it’s been priced in, odds are you’ll buy at a higher price (after good news) or sell at a lower price (based on bad news). Continue Reading…
Here are some of the ways ETFs can be used strategically to help you sleep better at night.
Image courtesy BMO ETFs/Getty Images
By Erin Allen, VP, Online Distribution, BMO ETFs
(Sponsor Blog)
Volatility is often seen as the price of admission for achieving investment returns, but too much of it can feel like paying a hefty fee for a ride on an intense roller coaster, only to find yourself feeling queasy by the end and unable to enjoy the rest of the amusement park.
If the recent stock market turbulence in early August has left you contemplating panic selling, take a moment to breathe. Market corrections are a normal and healthy aspect of investing, and your portfolio doesn’t have to experience such dramatic ups and downs.
Why? Well, various defensively oriented ETFs can offer strategic ways to manage and mitigate risk, helping you stay the course and remain invested through the market’s inevitable fluctuations. Here are some ideas featuring BMO ‘s ETFs lineup:
Low-volatility ETFs
Imagine the broad market, such as the S&P 500 index, as a vast sea where the waves represent market volatility, and your investment portfolio is your boat navigating these waters.
How your boat responds to these waves is dictated by its beta, a measure that indicates both the direction and magnitude of your portfolio’s fluctuations relative to the market.
To put it simply, if the market’s “waves” have a beta of 1, and your portfolio also has a beta of 1, this means your portfolio will typically move in sync with the market, rising and falling to the same degree.
Now, consider if your boat were lighter and more susceptible to the waves, symbolized by a beta of two. In this scenario, your portfolio would be expected to swing twice as much as the market: more pronounced highs and lows.
Conversely, imagine your boat is a sturdy cargo ship with a beta of 0.5. In this case, your portfolio would react more calmly to market waves, experiencing only half the ups and downs of the market. This stability is what low-beta stocks can offer, and they can be conveniently accessed through various ETFs.
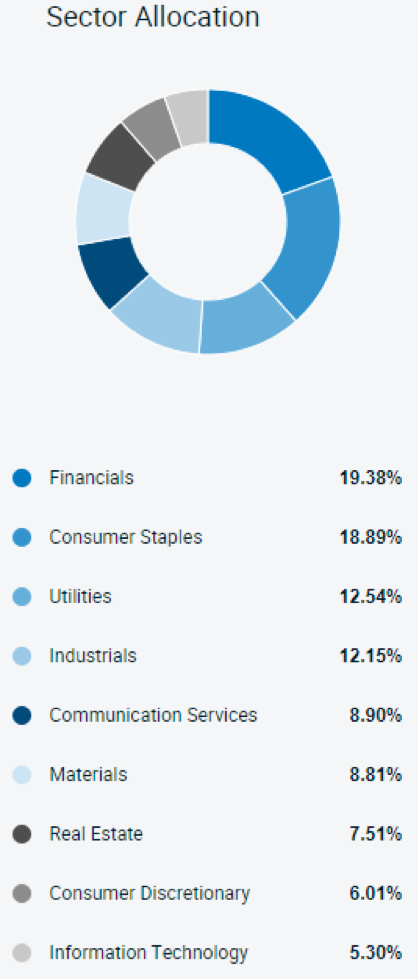
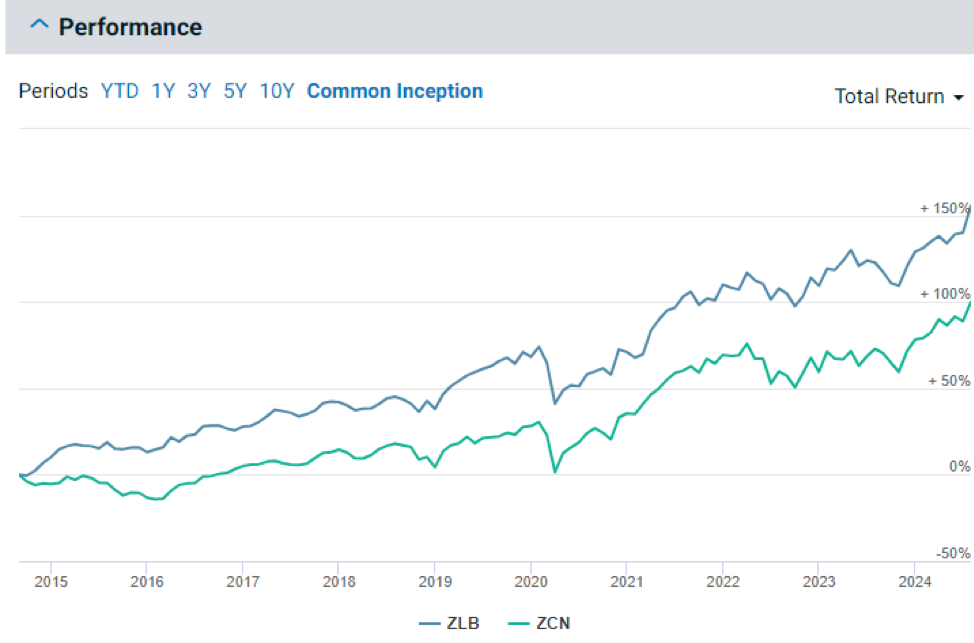
One such example is the BMO Low Volatility Canadian Equity ETF (ZLB)1, which selects Canadian stocks for their low beta. Compared to the broad Canadian market, ZLB is overweight in defensive sectors like consumer staples and utilities, which are less sensitive to economic cycles.
Holding allocations are as of August 19, 2024; sourced here1.
This ETF not only offers reduced volatility and smaller peak-to-trough losses compared to the BMO S&P/TSX Composite ETF (ZCN)2 but has also managed to outperform it — demonstrating that it is very much possible to achieve more return for less risk2.
While ETFs like the ZLB1 are engineered for reduced volatility through low-beta stock selection, it’s important to remember that they still hold equities.
In extreme market downturns, such as the one experienced in March 2020 during the onset of COVID-19, these funds can still be susceptible to market risk. This is pervasive and unavoidable if you’re invested in stocks; it affects virtually all equities regardless of individual company performances.
To fortify a portfolio against such downturns, diversification into other asset classes, particularly bonds, is crucial. However, not just any bonds will do — specific types, like those held by the BMO Ultra Short-Term Bond ETF (ZST)6, are particularly beneficial in these scenarios.
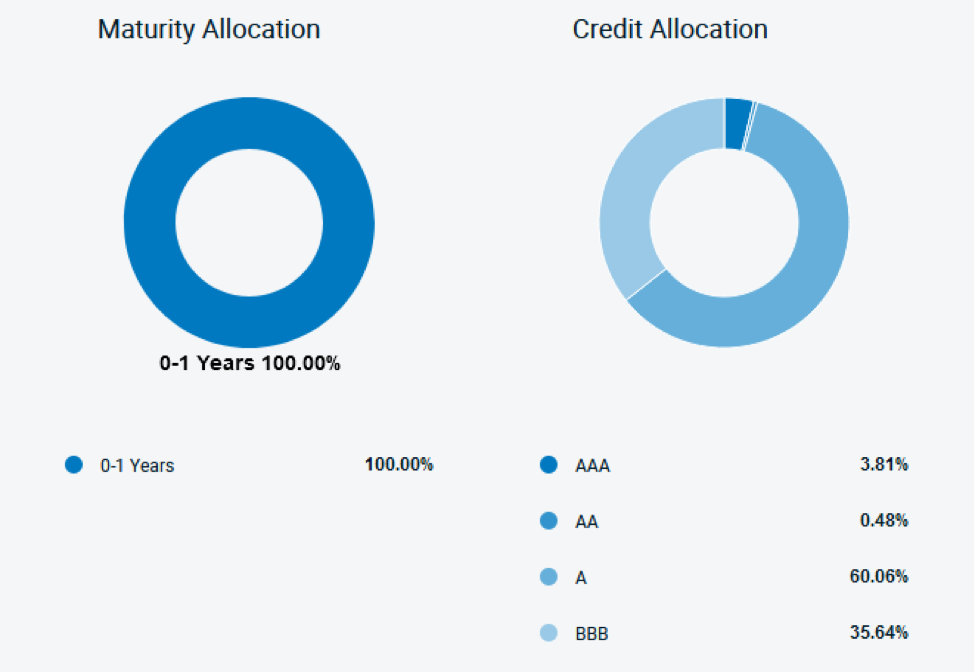
ZST, which pays monthly distributions, primarily selects investment-grade corporate bonds6. The focus on high credit quality, predominantly A and BBB rated bonds, is critical for reducing risk as these ratings indicate a lower likelihood of default and thus, offer greater safety during economic uncertainties.
Moreover, ZST targets bonds with less than a year until maturity6. This short duration is pivotal for those looking to minimize interest rate risk. Short-term bonds are less sensitive to changes in interest rates compared to long-term bonds, which can experience significant price drops when rates rise.
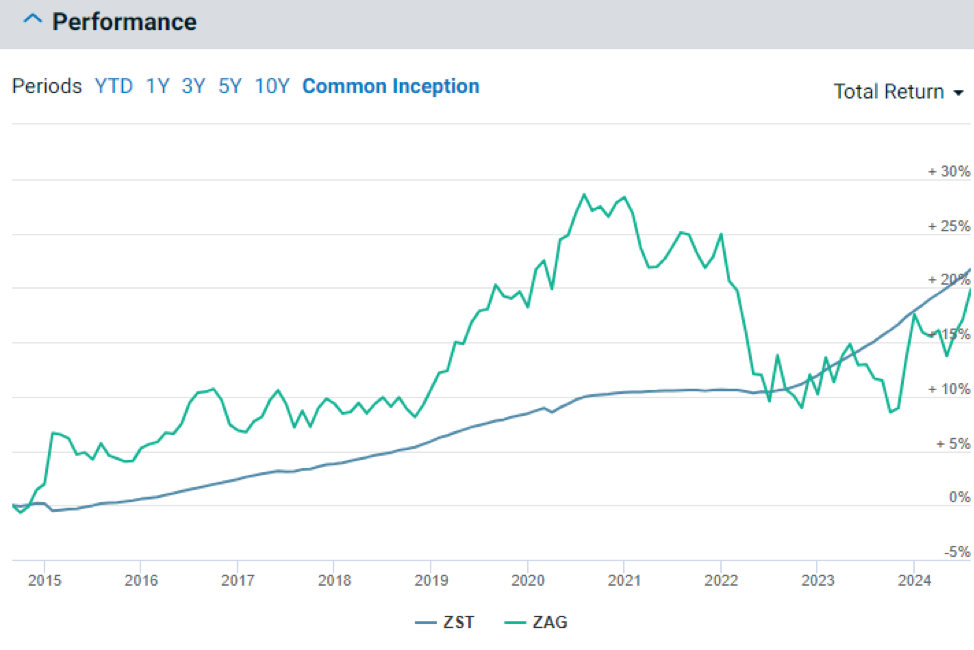
Charts as of July 31st, 2024 6
This strategic combination of high credit quality and short maturity durations7 is why, as demonstrated in the chart below, ZST has been able to steadily appreciate in value without experiencing the same level of volatility as broader aggregate bond ETFs like the BMO Aggregate Bond ETF (ZAG)8.
Buffer ETFs
If you recall the days of using training wheels when learning to ride a bike, you’ll appreciate the concept of buffer ETFs. Just as training wheels keep you from tipping over while also limiting how fast and freely you can ride, buffer ETFs aim to moderate the range of investment outcomes — both up and down.
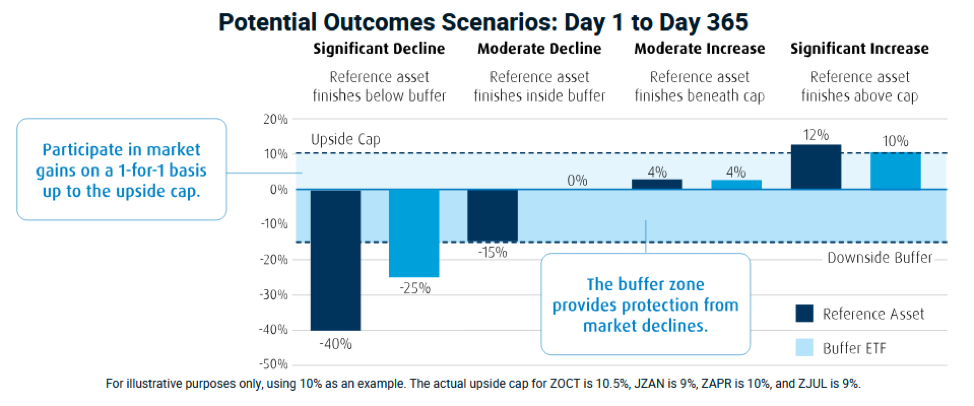
Buffer ETFs may sound complex, but the principle behind them is straightforward. These ETFs utilize options to limit your downside risk while also capping your potential upside returns.
For example, a buffer ETF might offer to limit your exposure to a maximum 10% price return of a reference asset (like the S&P 500 index) over a year while absorbing the first -15% of any losses during the same period.
If the reference asset rises, your investment increases alongside it, up to a 10% cap. However, if the reference asset declines, the ETF absorbs the first 15% of any loss. Only after this “downside buffer” is exhausted would you start to experience losses.
BMO offers four such buffer ETFs, each named according to the start month of their outcome period when the initial upside cap and buffer limits are set. These include: Continue Reading…
This month, I explore how the relationship between risk and return forms the bedrock of sound (or poor) investment results. I will also demonstrate why the management of these two elements constitutes the essence of adding or destroying value for investors. Lastly, (reader beware), I include a rant about investor complacency and the detrimental effects it can have on one’s wealth.
Good is Not the Enemy of Great: It is Great
David VanBenschoten was the head of the General Mills pension fund. In each of his 14 years in this role, the fund’s return had never ranked above the 27th percentile or below the 47th percentile.
Using simple math, one might assume that over the entire period the fund would have stood in the 37th percentile, which is the midpoint of its lowest and highest ranks. However, despite never knocking the lights out in any given year, VanBenschoten managed to achieve top-tier results over the entire period. By consistently attaining 2nd quartile performance in each and every year, over the 14-year period the fund achieved an enviable 4th percentile ranking.
The Hippocratic Oath and Investing
The seemingly irreconcilable difference between the average of VanBenschoten’s rankings and his overall rank over the whole 14-year period stems as much from the performance of other funds as from his own results.
To achieve outstanding performance, one must deviate from the crowd. However, doing so is a proverbial double-edged sword, as it can lead to vastly superior or inferior results. The preceding rankings indicate that most of the managers who were at the top of the pack in some years also had a commensurate tendency to be near the bottom in others, thereby tarnishing their overall rankings over the entire period.
In contrast, the General Mills pension fund, by being consistently warm rather than intermittently hot or cold, managed to outperform most of its peers. Managers who aim for top decile performance often end up shooting themselves in the foot. The moral of the story is that when it comes to producing superior results over the long term, consistently avoiding underperformance tends to be more important than occasionally achieving outperformance. In this vein, managers should take the physicians’ Hippocratic Oath and pledge to “first do no harm.”
Robbing Peter to Pay Paul: The Bright and Dark Sides of Asymmetry
The Latin term Sine Que Non describes an action that is essential and indispensable. In the world of investing, the ability to produce asymmetrical results meets this definition. It is the ultimate determinant of skill.
A manager who delivers twice the returns of their benchmark but has also experienced twice the volatility neither creates nor destroys value. They have simply robbed Peter (higher volatility) to pay Paul (commensurately higher returns). Since markets tend to go up over time, clients may marvel at the manager’s superior long-term returns. However, this does not change the fact that no value has been created – clients have merely paid in full for higher returns in the form of higher volatility.
If this same manager delivered 1.5 times the benchmark returns while experiencing twice the volatility, not only would they have failed to add value but would have destroyed it – they would have simply robbed Peter by exposing him to higher volatility while paying Paul less in the form of excess returns. In contrast, if the manager had produced twice the returns of the benchmark while experiencing only 1.5 times its volatility, then they deserve a firm pat on the back. They would have achieved asymmetrically positive results by paying Paul far more in outperformance than what they stole from Peter in higher volatility.
The Efficient Market Hypothesis: Why bother?
The efficient-market hypothesis (EMH) states that asset prices reflect all available information, causing securities to always be priced correctly and making markets efficient. By extension, the EMH asserts that you cannot achieve higher returns without assuming a commensurate amount of incremental risk, nor can you reduce risk without sacrificing a commensurate amount of return. It argues that it is impossible to consistently “beat the market” on a risk-adjusted basis. When applied to the decision to hire an active manager rather than a passive index fund, the EMH can be neatly summarized as “why bother?”