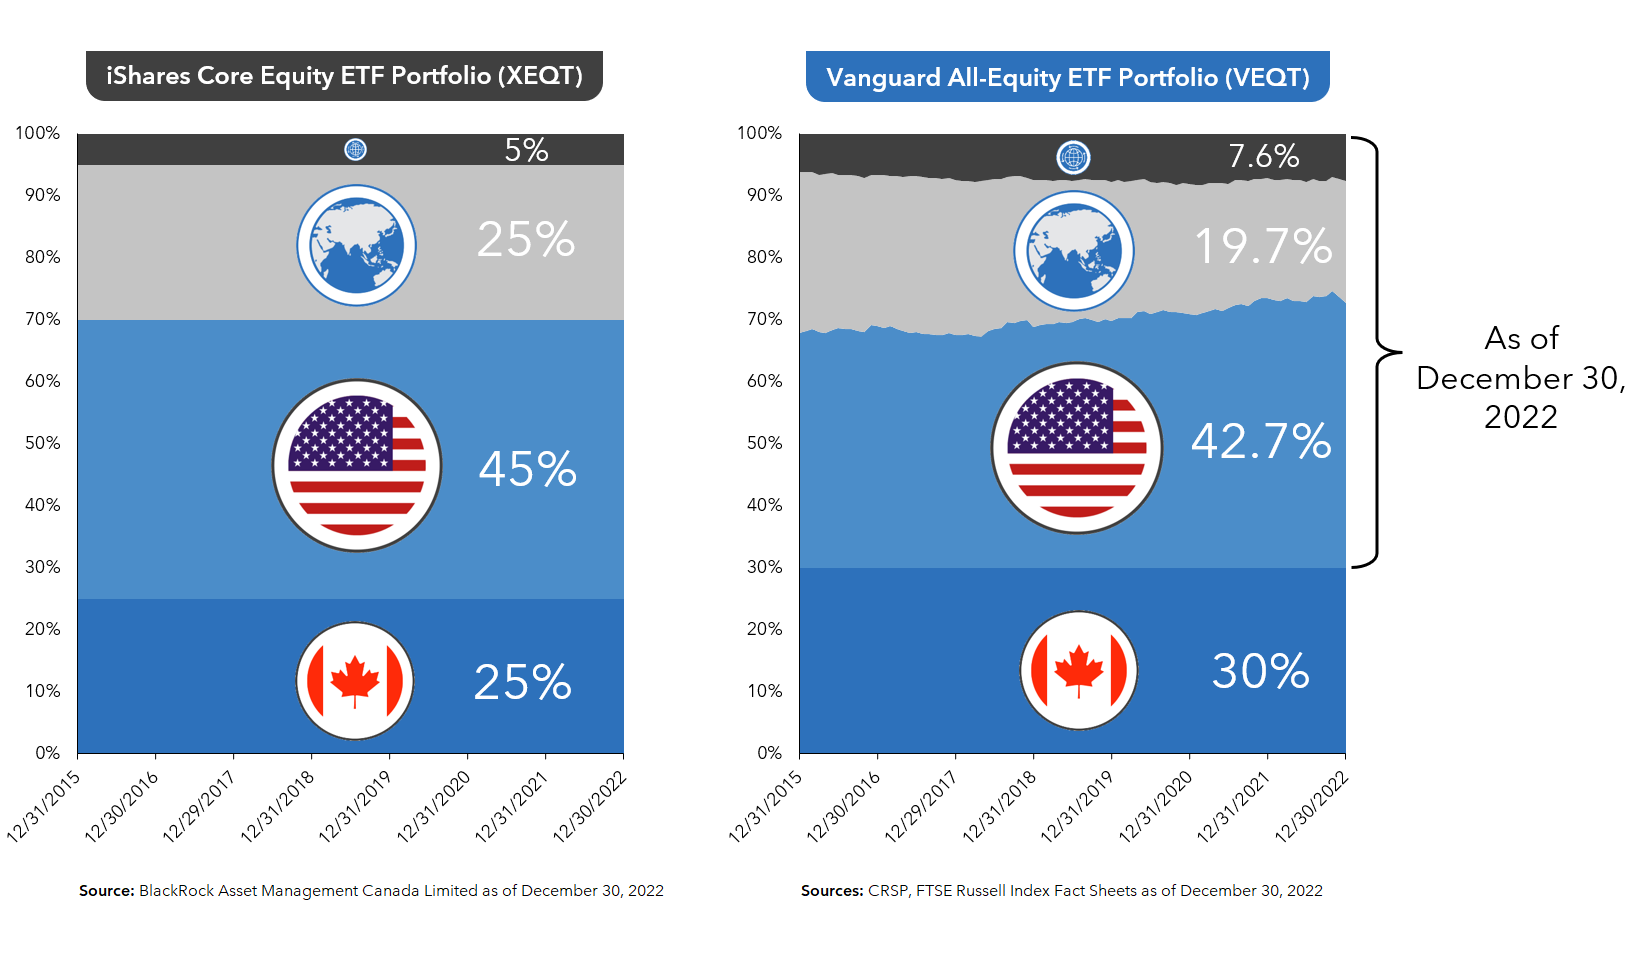
The 100% equity ETFs from iShares and Vanguard/Canadian Portfolio Manager
By Mark Seed, myownadvisor
Special to Financial Independence Hub
A reader recently asked me the following based on reading a few pages on my site:
Mark, does it make sense to have 100% of your portfolio in stocks? If so, at what age would you personally dial-back to own more cash or GICs or bonds? Thanks for your answer.
Great question. Love it. Let’s unpack that for us.
Members of Gen Z, which now includes the youngest adults able to invest (born in the late-1990s and early-2000s), represent a cohort that could be investing in the stock market for another 60 more years.
According to a chart I found on Ben Carlson’s site about stuff that might happen in 2023, over 60+ investing years in the S&P 500 (as an example) historical indexing performance would suggest you’d have a better chance of earning 20% returns or more in any given year than suffering an indexing loss. Pretty wild.
Source: A Wealth of Common Sense.
Shown another way as of early 2023:
Source: https://www.slickcharts.com
This implies younger investors, in my opinion, should at least consider going all-in on equities to take advantage of long-term stock market return power when they are younger given:
As you age, your human capital diminishes – your portfolio (beyond your home?) can become your greatest asset.
Younger investors can also benefit from asset accumulation from periodic price corrections – adding more assets in a bear market; allowing assets to further compound at lower prices when corrections or crashes occur (i.e., buying stocks on sale).
Crazy People is a 1990 American comedy starring Dudley Moore and Daryl Hannah. Moore plays advertising executive Emory Leeson. Leeson experiences a nervous breakdown, which causes him to design a series of “truthful” advertisements that are blunt and bawdy.
By mistake, his ads get printed and turn out to be a tremendous success. One of Leeson’s more memorable campaigns is for Volvos, which includes the tagline “Volvo — they’re boxy but they’re good.”
Dividend-paying stocks are like the Volvos of the investing world. They are not fancy or exciting, nor do they produce windfall profits over the short term. However, they have a lot going for them when you take a deeper look under the hood.
This month, I explore the historical performance of dividend-paying stocks, including the conditions under which they have tended to outperform their non-dividend-paying counterparts. Relatedly I will also discuss whether the current market environment is supportive of future outperformance.
A Caveat to the Volvo Analogy: Having your Cake and Eating it Too
The “Volvo — they’re boxy but they’re good” tagline implies a clear tradeoff: the suggestion being that one needs to sacrifice performance for reliability. However, the historical data imply that this has not been the case with dividend-paying stocks. Not only have they exhibited greater stability than their non-dividend-paying counterparts, but they have also produced higher returns, thereby providing investors with a “have your cake and eat it too” proposition.
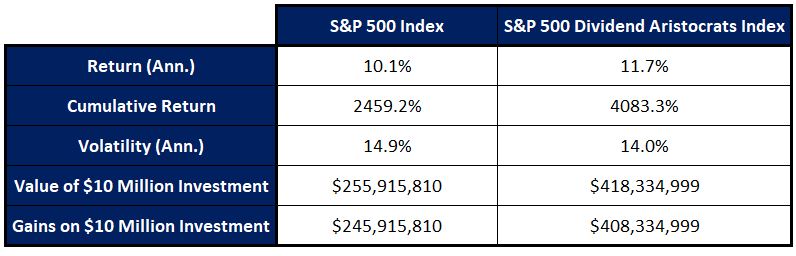
S&P 500 Index vs. S&P 500 Dividend Aristocrats Index (1990 – Present)
Since the beginning of 1990, the S&P 500 Index Dividend Aristocrats Index has produced an annualized total return of 11.7% vs. 10.1% for the S&P 500 Index. This difference in annualized performance has amounted to a tremendous difference in cumulative long-term returns, with the S&P 500 Dividend Aristocrats Index producing a cumulative return of 4,083% vs. a far less impressive 2,459% for the S&P 500 Index. In dollar terms, a $10 million investment in the S&P Dividend Aristocrats Index would have produced $408,334,999 in returns, which is 1.66 times more than the corresponding figure of $245,915,810 for the S&P 500 Index.
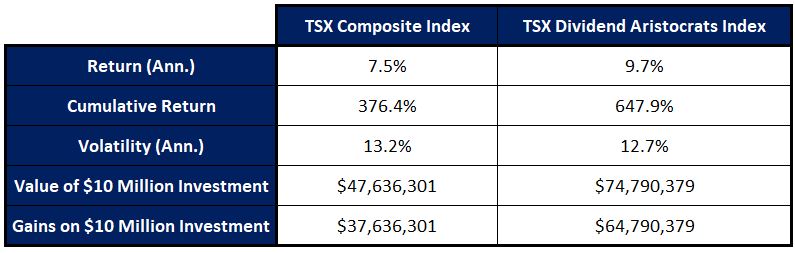
TSX Composite Index vs. TSX Dividend Aristocrats Index (2002 – Present)
The numbers for Canada tell a similar story, albeit over a shorter period due to historical data limitations for the TSX Dividend Aristocrats Index. Since 2002, the TSX Dividend Aristocrats Index has produced an annualized total return of 9.7% vs. 7.5% for the TSX Composite Index. In terms of cumulative performance, the TSX Dividend Aristocrats has produced a total return of 647.9% vs. 376.4% for the TSX Composite Index. In dollar terms, a $10 million investment in the TSX Dividend Aristocrats Index would have produced $64,790,379 in returns, which is 1.72 times more than the corresponding figure of $37,636,301 for the TSX Composite Index.
As an aside, the tremendous difference from 1990 to the present in the 2,459% cumulative return for the S&P 500 Index and that of 1,120% for the TSX Composite Index is largely attributable to the former’s far larger weighting in technology stocks. Between 1990 and 2010, the two markets were neck and neck, with the S&P 500 delivering a total return of 457% vs. 453% for the TSX. Since then, the S&P 500 went on to crush its northern neighbour, with a total return of 359% vs. 120%. During the same period, the mega-cap tech-heavy Nasdaq 100 knocked the lights out, returning 675%.
Tech stocks, and in particular mega-caps, have experienced tremendous earnings growth and trade at premium valuations. Whether their rates of growth continue, or premium multiples will persist, is beyond the scope of this commentary. That being said, there is no guarantee that these trends will persist, and relatedly whether the U.S. stocks will continue to outperform their Canadian counterparts.
Nice to Have in Strong Markets and Essential in Others
Dividends have historically been an integral part of equity market returns. Going back to 1990, a full 52.2% of the total return of the S&P 500 Index since 1990 can be attributed to the power of compounding reinvested dividends. On a relative basis, Canadian dividends have been even more prominent than U.S. ones, with reinvested dividends responsible for an astounding 63.3% of the total returns of the TSX Composite index.
Although dividends’ contributions to total market returns have been substantial over the past several decades, this contribution has tended to vary substantially over shorter sub-periods. As the table below demonstrates, dividends tend to play a smaller role in times of strong price appreciation. By contrast, during periods when capital gains have been muted, dividends play a far more substantial role in overall returns.
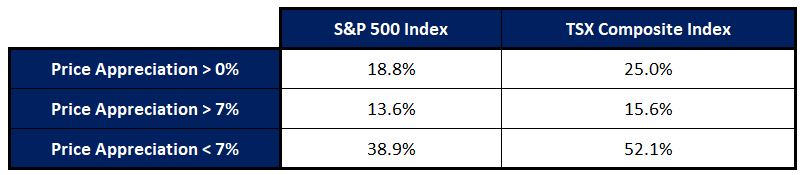
Contribution of Dividends to Total Returns: Rolling 12-Month Periods (1990 – Present)
Taking all 12-month rolling periods since 1990 in which the S&P 500 experienced price appreciation, dividends on average accounted for 18.8% of total returns. However, in periods where prices rose by 7% or more, dividends were responsible for only 13.6% of the total return pie vs. 38.9% when prices rose between 0% and 7%.
In Canada, the relative importance of dividends has also varied with capital gains. In all rolling 12-month periods since 1990 in which the TSX Composite Index experienced price appreciation, dividends were on average responsible for 25% of total returns. In those periods where prices rose by more than 7%, dividends’ share of total returns was only 15.6% as compared to 52.1% when prices rose between 0% and 7%. Continue Reading…
I was recently asked that question, and it brought back a flood of memories from my “near-retirement” days.
I suspect most of us were nervous before we retired, but it’s not something we talk about. I believe there’s value in sharing the psychological journey in those final days before retirement. For folks nearing retirement, it’s reassuring to know they’re not alone.
Recently I had the opportunity to talk about it with a reader who is on the cusp of retirement. We had a wide-ranging discussion and the conversation became the trigger for today’s post. I suspect many of the questions he asked are also on the minds of other readers who are approaching retirement.
This one’s for you, Mike. Thanks for letting me share our discussion with the readers of this blog. I trust they’ll all benefit from our discussion…
Were you nervous before you Retired?
That’s one of the questions a reader, Mike, asked me on a recent phone call. Mike’s a month away from retirement and reached out to me a few weeks ago. I typically decline reader requests for phone calls (unfortunately, a downside of writing a blog with a large following). If I said yes to every request, I’d be spending far too much of my time helping folks on a one-on-one basis, time that could otherwise be spent writing and reaching thousands of people with the same effort. It’s a “scalability” thing, and I trust you understand.
However…there was something about Mike.
His initial email hit a chord with me. Here’s what he said:
Good morning Fritz,
Have heard you on several podcasts and just finished your latest discussion with Jason Parker. I will be retiring in January and your point about helping others hit a cord. I would love the opportunity to speak with you about your blog. I’m currently a financial advisor and feel there is a huge need for financial literacy for just about everyone. As a former teacher, my passion is teaching/sharing. Would like to understand better how you got started with your blog, what are some of the watch outs, and any other insights you could provide.
Thanks for your consideration and congratulations on living your best life!
What caught my attention? The fact that he didn’t ask a single financial question and was focused on helping others. He had some ideas about teaching/sharing and he was considering starting a blog. I appreciate readers applying the lessons I’m sharing in their lives and searching for Purpose in retirement. I also had a bit more free time than I usually do, so I agreed to a phone call.
Following are some of the highlights of our discussion, in no particular order. I trust you’ll find them of interest.
Questions From A Soon To Be Retiree
Should I start a Blog In Retirement?
My first reaction to any question that says “Should I start…” is to say yes. It’s critical, especially in early retirement, to foster your creative curiosity and try anything that interests you. Many won’t “stick,” but you’ll likely find a few that do. Once you’ve found one or two, you’re on your way to a great retirement.
Mike has a passion for teaching and is exploring various avenues to reach others. I strongly encourage anyone who has an interest in starting a blog to give it a try. 7 years ago, I started this blog on a whim. I’m 100% self-taught and technically inept. It’s easy to start a blog these days, with Bluehost and WordPress both designed for folks who have never built a website. Starting this blog is one of the best things I’ve ever done and has become a Purpose of mine in retirement. I hope it works out as well for others who are considering it.
That said, it’s important to consider your motives. If you’re doing it to make money, I suspect you’ll fail. For 3 years, I wrote every week without making a dime and only started adding those annoying ads when I retired. I get some complaints about them but believe I shouldn’t have to incur costs when there’s an option of generating some revenue for my “work.” As blogs grow, the costs increase (Mailchimp costs me $220/month based on my ~13k subscribers), and I felt it was time to at least cover my costs. Making money has never been my motive, and it shouldn’t be yours. Even now, after 7 years, the income from this blog basically pays my health insurance. Nice to have, but not enough to change our life. Unless you’re in the 0.1%, you won’t get rich writing a blog. Continue Reading…
Uncover good companies for long-term investments and you will boost your portfolio returns over time. Learn more here and discover one of our top picks.
Long-term stock investment strategies aren’t built to make a fast dollar. They are built to prosper over time, and most importantly, teach you how to pick the right stocks.
In our view, your goal as an investor, particularly if you follow a conservative investing strategy like the one we recommend, is to make an attractive return on your investments over a period of years or decades. Failure means making bad investments that leave you with meager profits or losses. Continue reading to learn about good companies for long-term investments.
Visa Inc., symbol V on New York, is on our list of good companies for long-term investments
Visa has been a terrific performer for our subscribers since we first recommended the stock at $19 (adjusted for share splits) in the December 2010 issue of our Wall Street Stock Forecaster newsletter.
A big part of Visa’s appeal is that it gets most of its revenue from the fees it charges card issuers and merchants using its network. This unique business model means the banks — and not Visa — are responsible for evaluating customer creditworthiness and collecting payments, which helps to cut risk for investors.
The company first sold its stock to the public at $11 a share in March 2008. We held off recommending it at that time, as the best way to cut the risk of investing in initial public offerings is to wait till after the next market slump and/or recession comes along. Thanks to Visa’s unique business model, it was able to avoid big losses during the 2008-2009 financial crisis.
Even though rising interest rates and inflation could slow consumer spending, we feel Visa has many more years of growth ahead. The COVID-19 pandemic accelerated the shift to online shopping, while the easing of restrictions will spur the use of credit and debit cards to pay for airline tickets and hotel rooms.
Visa is also making shrewd acquisitions that enhance its expertise in new areas, such as buy-now-pay-later payment plans. These moves will let it stay ahead of smaller firms with potentially disruptive fintech (the combination of financial services and technology services).
The company also continues to reward investors. In the first half of fiscal 2022, it spent $7.05 billion on share buybacks. It still has $9.8 billion remaining under its current authorization.
Visa has also increased its dividend each year since the 2008 IPO.
Visa is a buy for long-term gains.
Spotting good companies for long-term investments lets you profit from long-term growth in the economy
For decades — as long as I’ve been involved with the stock market — some brokers have claimed that they favour the “buy and hold” investing strategy in principle, except when the market was so treacherous and unpredictable that their clients had to indulge in short-term trading, options or whatever to make any money. Continue Reading…
As I have written in the past, valuations are of no use for determining broad market returns over the short term.
To be clear, I am NOT implying that valuation doesn’t matter. Historical experience demonstrates that it has been an extremely powerful predictor of average returns over the long term. Without fail, whenever valuations have stood well below average levels, strong returns ensued over the next 7-10 years. Conversely, highly elevated valuations have preceded anemic or negative returns.
For investors interested in shorter-term market movements, sentiment indicators may harbor greater potential than their macroeconomic or valuation-based counterparts. In this month’s missive, I explore some of the more commonly cited indicators that purportedly possess short-term predictive capabilities to ascertain:
(1) Whether the historical record confirms the presence of any predictive power, and
(2) What these variables are signaling for markets in the near term.
The VIX Index: Embrace the Fear
The VIX Index represents the market’s expectations of the S&P 500 Index’s volatility over the next 30 days. Its level is derived from the prices of S&P 500 options with near-term expiration dates. Dubbed the “fear index,” the VIX is often used to gauge market sentiment, and in particular the degree of fear among market participants.
Historically, the VIX has served as a good, if imperfect indicator of market turning points:
Although it failed to provide a clear “get out of dodge” signal before the peak of the tech bubble in early 2000, the VIX’s historically stratospheric level in late 2002 indicated a level of extreme fear that signaled that better times were at hand.
In early 2007, the VIX stood at very depressed levels, indicating the high degree of complacency that contributed to the global financial crisis of 2008. Unfortunately, it was far too early in signaling the recovery. In October 2008, extremely elevated VIX levels were signaling the type of abundance of fear that often precedes rebounds, yet stocks still had plenty of downside before ultimately bottoming in March of 2009.
More recently, the VIX failed to provide a warning signal of the market turmoil of 2022. However, its extremely elevated stance in late October of 2022 signaled that a rebound was imminent.
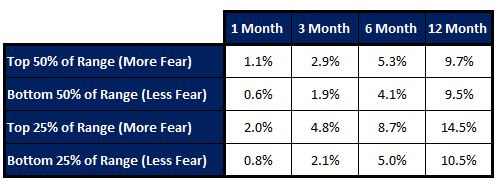
VIX Index Levels and S&P 500 Index Returns: 1997 – Present
Putting specific bear markets and recoveries aside, the above table demonstrates that elevated VIX/fear levels have on average preceded higher returns, and depressed VIX/lower fear levels have foreshadowed lower returns. The historical record lends credence to Buffett’s sage advice that it is wise for investors to be “fearful when others are greedy, and greedy when others are fearful.”
Put Call Ratio: Beware Cheap Insurance
Like the VIX Index, the put-call ratio (PCR) is widely used to gauge the overall mood of the market. Put options provide the right to sell stocks at a predetermined price and are often purchased as insurance to protect portfolios from market declines. Call options offer the right to buy stocks at a predetermined price and are frequently bought to capture upside participation when stock prices rise.
The PCR increases when the market participants’ desire for downside protection rises relative to their desire for upside participation. Alternately stated, a rise in the PCR is indicative of a rise in bearish sentiment. Conversely, the PCR falls when people become more focused on reaping gains than on avoiding losses, which is indicative of a rise in bullish sentiment.
Since 1997, the PCR has been a contrarian indicator, whereby elevated levels (high fear/low greed) have on average signaled higher returns and lower PCRs (low fear/high greed) have heralded subdued or negative results. Continue Reading…