Short-term trading may seem appealing to beginning investors, but it’s unpredictable and can lead to significant losses
TSINetwork.ca
Beginning investors may develop an unrealistic idea of how much money they can make by delving into short-term trading. It seems obvious to them that all it takes is some good advice from an expert.
However, any true investing expert understands that random factors play a big role in short-term stock price fluctuations. That’s why these movements are unpredictable. No outsider consistently profits from them.
In fact, there’s a lot of randomness in the stock market and a lot of conflicts of interest. You have to take that into account if you hope to succeed as an investor.
Many investors try to outperform the stock market by going in and out of it erratically, based on their assessment of risk and potential reward. The trouble is that these risk assessments rise and fall with day-to-day or month-to-month economic and business developments, which are also subject to the influence of random factors and conflicts of interest.
As a result, these investors tend to “buy on strength,” as the saying goes. That is, they do more of their buying when confidence is high and stock prices have gone up. By then, however, much of the rise they hoped to profit from will have already taken place.
They are also inclined to “sell on weakness,” when investors are generally nervous and prices have dropped. That way, they hold on to their stocks during much of the decline they hoped to avoid. They may even wind up selling at or near the bottom in prices.
It may seem like a self-evident truth, but it’s worth repeating. While it’s hard to outperform the market, it’s easy to underperform it. In fact, some investors do it almost every year.
Understanding the realities of short-term trading
Many people start out investing with unrealistic ideas of how much money they can make from short-term stock trading, and how quickly they’ll get rich.
Inexperienced investors are shocked when they learn that successful investors rarely if ever do any short-term trading. (That applies to everybody from “The Wealthy Barber” to Warren Buffett.) After all, many stockbrokers, investor newsletters, cable TV financial kibitzers and so on seem to talk about nothing but day-to-day or hour-to-hour market trends. They make it sound easy to GRQ (Get Rich Quick).
It’s easy to sort through yesterday’s investment news and pick out a reason that seems to explain why a stock or the entire market went up or down today. Trying to spot tomorrow’s winners today is vastly harder. Nobody does it consistently. Continue Reading…
Inflation is coming down in Canada and the U.S. And one can argue that the rate hikes have had little effect. After all, Canadians and Americans are spending money, and employment is strong. The economy has been very resilient. Perhaps inflation was transitory after all, caused by the pandemic and the invasion of Ukraine. This is not the traditional inflation fight script. The economic soft landing argument is getting more support. Was inflation transitory?
Total inflation in Canada is back ‘on target’ in the 2% to 3% range.
According to Statistics Canada, the June slowdown was driven primarily by a year-over-year drop of 21.6% in gasoline prices. Meanwhile, the largest contributors to the rise in consumer prices are food costs — which rose 9.1% in June — and mortgage interest costs (up 30.1%).
It’s likely a very good guess that rates are staying higher for longer. The bond market is certainly suggesting that as well.
The 5-year remains elevated.
Fixed-rate mortgage holders will likely be resetting at higher borrowing costs over the next 2 to 3 years – adding several hundred dollars a month to the typical mortgage payment. Of course, that takes money out of the economy and money that would have been spent on goods and services.
Next year may be sunnier than forecast
In the Globe & Mail, Ian McGugen offered a very interesting post. Ian looks to one of the most optimistic economists, and that is a growing group.
Jan Hatzius, chief economist at investment banker Goldman Sachs, has set himself apart from the crowd in recent months by declaring that the United States will not sink into a recession. Continue Reading…
As I have written in the past, predicting stock market returns is largely an exercise in futility. Over the past several decades, the forecasted returns for the S&P 500 Index provided by Wall Street analysts have been slightly less accurate than someone who would have merely predicted each year that stocks would deliver their long-term average return. Importantly, not one major Wall St. strategist predicted either the tech wreck of the early 2000s or the global financial crisis of 2008-9.
To be clear, I am still adamant that consistently accurate forecasts are beyond the reach of mere mortals (or even quant geeks like me). Any investor who could achieve this feat would reap returns that put Buffett’s to shame. However, there may be some hope on the horizon. Good is not the enemy of great. The objective of any investment process should not be perfection, but rather to make its adherents better off than they would be in its absence.
To this end, I have decided to sin a little and model some of the most commonly cited macroeconomic variables that influence stocks market returns, with the objective of (1) ascertaining whether and how these factors have historically influenced markets and (2) what these variables are signaling for the future.
Don’t Fight the Fed
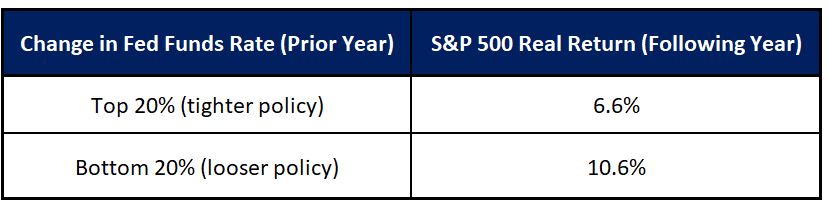
It is often stated that one shouldn’t fight the Fed. Historically, there has been an inverse relationship between changes in Fed policy and stock prices. All else being equal, increases in the Fed Funds rate have been a headwind for stocks while rate cuts have provided a tailwind.
Prior 1-Year Change in Fed Funds Rate vs. 1-Year Real Returns: S&P 500 Index (1960-Present)
As the preceding table illustrates, the difference in one-year real returns following instances when the Fed has been pursuing tighter monetary conditions has on average been 6.6%, as compared to 10.6% following periods when it has been in stimulus mode.
As of the end of June, the Fed increased its policy rate by 3.5% over the past 12 months. From a historical perspective, this change in stance lies within the top 5% of one-year policy moves since 1960 and is the single largest 12-month increase since the early 1980s. Given the historical tendency for stocks to struggle following such developments, this dramatic increase in rates is cause for concern.
Valuation, Voting, and Weighing
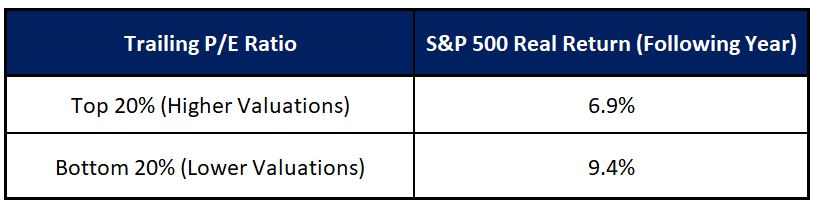
Over the past several decades, valuations have exhibited an inverse relationship to future equity market returns. Below-average P/E ratios have generally preceded above-average returns for stocks, while lofty P/E ratios have on average foreshadowed either below-average returns or outright losses.
Trailing P/E Ratio vs. 1-Year Real Returns: S&P 500 Index (1960-Present)
Since 1960, when P/E ratios stood in the bottom quintile of their historical range, the S&P 500 produced an average real return over the next 12 months of 9.4% compared with only 6.9% when valuations stood in the highest quintile. Sky high multiples have proven particularly poisonous, as indicated by the crushing bear market which followed the record valuations at the beginning of 2000.
To be clear, valuations have little bearing on the performance of stocks over the short term. However, their ability to predict returns over longer holding periods has been more pronounced. As Buffett stated, “In the short run, the market is a voting machine but in the long run, it is a weighing machine.”
Although valuations are currently nowhere near the nosebleed levels of the tech bubble of the late 1990s, they are nonetheless elevated. With a trailing P/E ratio hovering north of 21, the S&P 500’s valuation currently stands in the 84th percentile of all observations going back to 1960 and is at the very least not a ringing endorsement for strong equity market returns.
From TINA To TARA To TIAGA
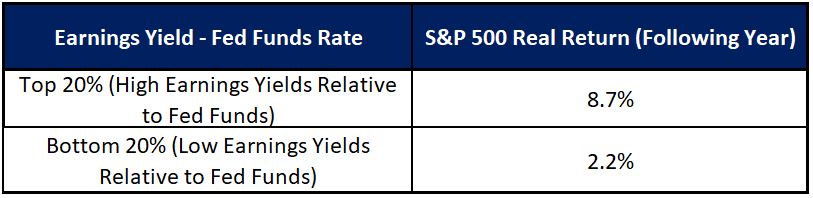
At any given point in time, stock market valuations must be considered in the context of the yields offered by high quality money market instruments and bonds. The difference between the earnings yield on stocks and interest rates has historically been positively correlated to future market returns.
Earnings Yields Minus Fed Funds Rate vs. 1-Year Real Returns: S&P 500 Index (1960-Present)
When the difference between earnings yields and the Fed Funds rate has stood in the top quintile of its historical range, the real return of the S&P 500 Index over the ensuing 12 months has averaged 8.7% versus only 2.2% following times when it has stood in the bottom quintile.
Until the Fed began to aggressively raise rates in early 2022, TINA (there is no alternative) was an oft-cited reason for overweighting stocks within portfolios. Yields on bank deposits and high-quality bonds yielded little to nothing, thereby spurring investors to reach out the risk curve and increase their equity allocations.
As the Fed continued to raise rates, increasingly higher yields made money markets and bonds look at least somewhat attractive for the first time in years, thereby causing market psychology to shift from TINA to TARA (there are reasonable alternatives). Continue Reading…
Are you interested in stock trading rules for beginners? The “four-year” rule is an important one to understand for growing your profits
TSInetwork.ca
Are you interested in stock trading rules for beginners? Most “market rules” turn out to be demonstrations of the fact that random events tend to occur in bunches. The “research” they grow out of generally consists of studying statistics until you find start-and-end dates of periods when a hypothetical indicator would have paid off.
In most cases, if you change the start and/or end dates, the market rules/indicators lose their advantage or go into reverse. Even if you stick with the same start and end dates, the indicator will still go into reverse eventually.
However, the four-year rule is an exception among other stock trading rules for beginners. That’s because it’s based on events that tend to recur in predictable phases of the four-year U.S. Presidential term.
Some statistics are worth a close look
From the election of Andrew Jackson in 1832 till the election of Donald Trump in 2016, the U.S. has gone through 47 complete four-year Presidential terms.
In the first years of each of these 47 four-year presidential terms (starting with the year after the Presidential Election year) the average result for the U.S. stock market was a gain of 3%.
In the second years (the mid-term election years), the annual gain averaged 4.0%. The average result for the third years (the pre-Presidential Election years) was a 10.4% gain. The average for the fourth years (the Presidential Election years) was a gain of 6.0%. (Source: Stock Traders Almanac 2022.)
This pattern probably comes about because of a couple of unchanging things about most U.S. Presidential Elections:
First, most U.S. political office holders, regardless of party, want to get re-elected, or pave the way to the election of a successor from their own party.
Second, U.S. Presidential Elections bring out many “swing voters” who might not bother to vote in less important elections. They tend to get interested in the Presidential Election because of the torrent of attention it inspires, in the media and in day-to-day conversation.
That’s why newly elected or re-elected presidents often introduce unpleasant necessities in the first year or at least first half of the term. (The best recent example is the need President Trump felt to confront China early in his term.) Swing voters (or voters generally, for that matter) will have had time to get over the shock of the news before the next Presidential Election. In fact, the unpleasant necessities of the first half of the term may have begun paying dividends by the second half. Continue Reading…
In his role as head of research at Merrill Lynch, Bob Farrell established a reputation as one of the leading market analysts on Wall Street. In his famous “10 Market Rules to Remember,” Farrell summarized his insights on market tendencies.
One of Farrell’s rules states, “When all the experts and forecasts agree — something else is going to happen,” which embodies the essence of contrarianism.
In this month’s missive, I explore the roots and causal factors underlying Farrell’s warning, drawing on historical examples. I also illustrate the potential benefits and pitfalls of going against the crowd. Additionally, I demonstrate that market sentiment is currently approaching levels that have historically preceded broad market declines. Lastly, I suggest that there are specific areas where investors should consider trimming exposure, realizing gains, and paying the taxman.
There is no shortage of historical examples of “sure things” ending badly. In the late 1990s, following two decades of above-average returns, both institutional investors and consultants broadly embraced the dangerous consensus that future stock market returns would be about 11%. Dissenters and naysayers were few and far between.
The basis for these forecasts was the extrapolation of recent results. Stocks had been delivering average annualized returns of 11%, therefore it was assumed they would do so going forward – simple. Few investors contemplated the possibility that the past 15 years were anomalous from a longer-term perspective. More importantly, there was little concern that an extended period of above-average returns might have been borrowed from future returns by pushing up valuations to unsustainable levels.
The sad ending to this ebullience was the first three-year decline in equities since 1930. For the seven years ending March 31, 2007, following the market’s peak in early 2000, the annualized return of the S&P 500 was 0.9%. Importantly, these subpar returns encompassed a bitter and painful peak-trough loss of about 50%.
A similar occurrence of widespread adulation ending badly occurred only a half-decade later in 2005, when everyone “knew” residential real estate was a “surefire” way to amass wealth. Zealots justified unsustainable values with oft-cited mantras such as “They’re not making any more land,” “You can live in it,” etc. This blind optimism pushed real estate prices to unsustainable levels which all but guaranteed the subsequent collapse and some painful experiences for the “it can only go up” crowd.
Sorry, Beatles – All You Need is NOT Love
More often than not, what is obvious to the masses is wrong. There are valid explanations, both financial and behavioral, that cause the things which everyone believes to be true to turn out to be untrue.
In July 1967, the Beatles released their famous single All You Need Is Love. With all due respect to John, Paul, George, and Ringo, nothing could be further from the truth in the world of investing. Specifically, the more popular a particular investment becomes, the less its profit potential, if for no other reason than if everyone likes something, such adulation is likely to be reflected in its price.
In what is referred to as the bandwagon effect, investors often become enthusiastic about a particular investment or asset class after it has already produced strong returns. Believing that past outperformance is a sign of strong future returns, the herd then hops en masse on the proverbial bandwagon. This widespread fervor then causes prices to overshoot any rational approximation of value, thereby setting the stage for inevitable disappointment.
In the world of investing, “everyone knows” should come with a “buyer beware” warning. Investments that are heralded as sure things are bound to be fairly priced at best and often become dangerously overvalued. Great opportunities lead to great prices, which by definition means their greatness has been paid for in full, stripping them of their greatness. Conversely, it’s only when people disagree that opportunities to achieve above-average returns exist.
Risk: Reality vs. Perception
Managing risk is at least as important as (and inextricable from) achieving decent returns. Not only do irrational sentiment and expectations result in poor returns, but also give rise to elevated risk. Risk evolves in the same paradoxical manner as returns. As an asset follows the journey from normal to over-owned and overpriced, not only does its potential return deteriorate, but its risk increases.
When everybody becomes convinced that something will produce spectacular returns, then by extension they also believe that it involves little or no risk. This perception often leads investors to bid it up to the point where it becomes excessively risky. In contrast, when broadly negative opinion drives all the optimism out of an asset’s price, its risk profile becomes relatively small. Put another way, investment risk tends to reside most where it is least perceived, and vice versa.
In the world of investments, Bob Farrell trumps the Fab Four. Good investments are generally associated with skepticism, indifference, and even neglect, which sets the stage for high returns with lower risk. Inversely, widespread acceptance and adulation sow the seeds of high-risk and poor returns.
No Good Deed shall go Unpunished
As is the case with many aspects of markets, both timing and patience play an important role in contrarian investing.
Investment trends regularly go to extremes. It is this very tendency that results in calamities and opportunities. Unfortunately, life for managers is not as simple as buying cheap assets and selling their overvalued counterparts. As John Maynard Keynes stated, “The market can remain irrational longer than you can remain solvent.”
Not only can overvalued assets remain stubbornly so for extended periods of time but can become even more overvalued before they ultimately come back down to earth. By the same token, undervalued assets can remain cheap and become even cheaper before any payoff materializes. Sentiment can be a self-fulfilling prophecy for an indeterminable amount of time before reversing, turning previously favored investments into assets non grata, and the subjects of yesterday’s scorn into tomorrow’s darlings. Continue Reading…