Markets can be Scary but more importantly, they are Resilient
LowrieFinancial.com: Canva custom creation
By Steve Lowrie, CFA
Special to the Financial Independence Hub
Most investors understand or perhaps accept the fact that they are not able to time stock markets (sell out before they go down or buy in before they advance).
The simple rationale is that stock markets are forward looking by anticipating or “pricing in” future expectations.
While the screaming negative headlines may capture attention, stock markets are looking out to what may happen well into the future.
Timing bond markets is even harder than timing stock markets
When it comes to interest rates and inflation, my observation is that the opposite is true. Most investors seem to think they can zig or zag their bond investments ahead of interest rate changes. This is perplexing, as you can easily make the case based on evidence that trying to time bond markets is even more difficult than trying to time equity markets.
Another observation is that many investors tend to be slow to over-react. Reacting to today’s deafening headlines ignores that fact that all financial markets are extremely resilient. Whether good or bad economic news, good or bad geopolitical events, markets will work themselves out and march onto new highs, albeit sometimes punctuated by sharp and unnerving declines. Put another way, declines are temporary, whereas advances are permanent. And remember, this applies to both bond and stock markets.
It is easy to understand why we might be scared about the recent headline inflation numbers and concerned about rising interest. It is very important to keep this in context, which is what we will address today.
I see the bad moon a-risin’
I see trouble on the way
I see earthquakes and lightnin’
I see bad times today
Don’t go around tonight Well it’s bound to take your life There’s a bad moon on the rise
Creedence Clearwater Revival
The Curious Case of Missing Inflation
Image by Shutterstock/Outcome
Prior to the global financial crisis of 2008, if you had asked me what would happen if the Fed and other central banks slashed rates to zero and then left them there for over a decade, I would have told you that it wouldn’t be long before the world faced a serious inflation problem. I would have been dead wrong!
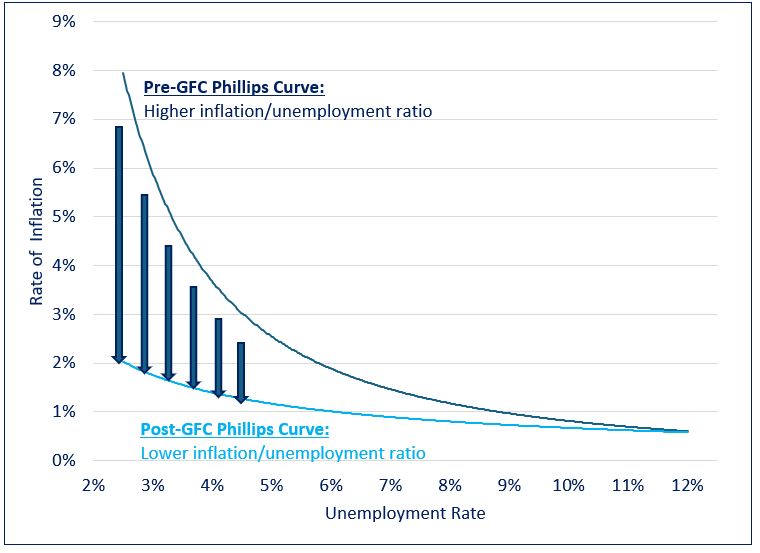
The Phillips curve is an economic concept developed by A. W. Phillips that describes the relationship between inflation and unemployment. The theory holds that there is an inverse tradeoff between the two variables. All else being equal, lower unemployment leads to higher inflation, while higher unemployment is associated with lower inflation.
Phillips’ theory proved largely resilient for most of the postwar era. However, a notable exception occurred in the years following the global financial crisis (GFC). From 2009 to 2021, despite unprecedented amounts of monetary and fiscal stimulus and record low unemployment, global prices remained unexpectedly subdued.
The Evolution of the Phillips Curve
As the chart above illustrates, in the years following the GFC the Phillips curve seemed to have shifted downward. This change allowed global economies to sustain low levels of unemployment that historically would have been accompanied by runaway inflation.
The classic unemployment vs. inflation tradeoff seemed to have vanished, leaving central bankers in the enviable position of being able to leave rates at uber stimulative levels for an extended period without spurring runaway inflation. This dynamic remained in place until 2021, when the rubber of unprecedented quantities of monetary and fiscal stimulus met the road of Covid-related supply-chain disruptions. This combination brought an abrupt end to the disinflation party of the past decade, causing central banks to raise rates at a blistering pace the likes of which had not been seen since the Volcker era of the 1980s.
Declining Interest Rates: How do love thee?
The long-term effects of low inflation and record low rates on asset prices cannot be overstated. On the earnings front, low rates make it easier for consumers to borrow money for purchases, thereby increasing companies’ sales volumes and revenues. They also enhance companies’ profitability by lowering their cost of capital and making it easier for them to invest in facilities, equipment, and inventory. Lastly, higher asset prices create a virtuous cycle: they cause a wealth effect where people feel richer and more willing to spend, thereby further spurring company profits and even higher asset prices. Continue Reading…
Here are some of the ways ETFs can be used strategically to help you sleep better at night.
Image courtesy BMO ETFs/Getty Images
By Erin Allen, VP, Online Distribution, BMO ETFs
(Sponsor Blog)
Volatility is often seen as the price of admission for achieving investment returns, but too much of it can feel like paying a hefty fee for a ride on an intense roller coaster, only to find yourself feeling queasy by the end and unable to enjoy the rest of the amusement park.
If the recent stock market turbulence in early August has left you contemplating panic selling, take a moment to breathe. Market corrections are a normal and healthy aspect of investing, and your portfolio doesn’t have to experience such dramatic ups and downs.
Why? Well, various defensively oriented ETFs can offer strategic ways to manage and mitigate risk, helping you stay the course and remain invested through the market’s inevitable fluctuations. Here are some ideas featuring BMO ‘s ETFs lineup:
Low-volatility ETFs
Imagine the broad market, such as the S&P 500 index, as a vast sea where the waves represent market volatility, and your investment portfolio is your boat navigating these waters.
How your boat responds to these waves is dictated by its beta, a measure that indicates both the direction and magnitude of your portfolio’s fluctuations relative to the market.
To put it simply, if the market’s “waves” have a beta of 1, and your portfolio also has a beta of 1, this means your portfolio will typically move in sync with the market, rising and falling to the same degree.
Now, consider if your boat were lighter and more susceptible to the waves, symbolized by a beta of two. In this scenario, your portfolio would be expected to swing twice as much as the market: more pronounced highs and lows.
Conversely, imagine your boat is a sturdy cargo ship with a beta of 0.5. In this case, your portfolio would react more calmly to market waves, experiencing only half the ups and downs of the market. This stability is what low-beta stocks can offer, and they can be conveniently accessed through various ETFs.
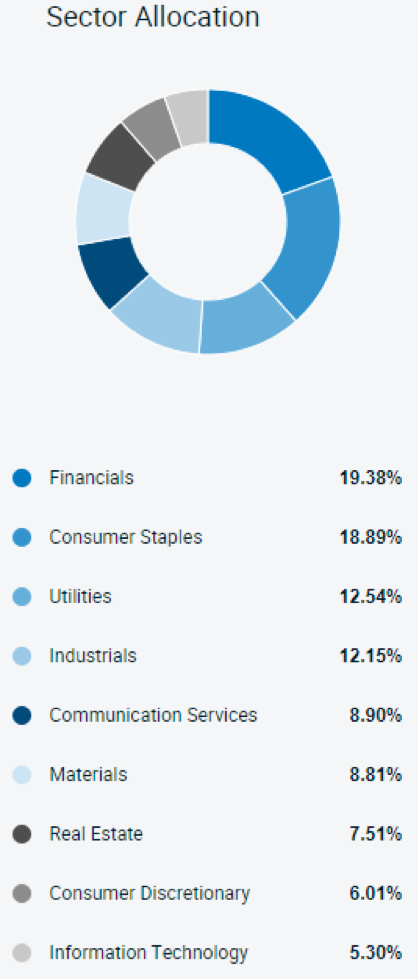
One such example is the BMO Low Volatility Canadian Equity ETF (ZLB)1, which selects Canadian stocks for their low beta. Compared to the broad Canadian market, ZLB is overweight in defensive sectors like consumer staples and utilities, which are less sensitive to economic cycles.
Holding allocations are as of August 19, 2024; sourced here1.
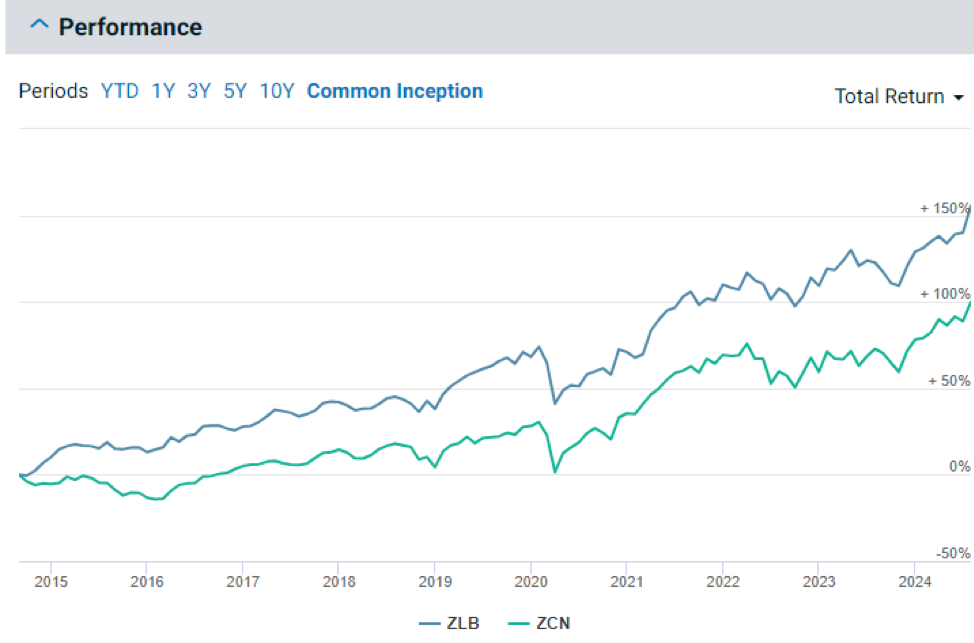
This ETF not only offers reduced volatility and smaller peak-to-trough losses compared to the BMO S&P/TSX Composite ETF (ZCN)2 but has also managed to outperform it — demonstrating that it is very much possible to achieve more return for less risk2.
While ETFs like the ZLB1 are engineered for reduced volatility through low-beta stock selection, it’s important to remember that they still hold equities.
In extreme market downturns, such as the one experienced in March 2020 during the onset of COVID-19, these funds can still be susceptible to market risk. This is pervasive and unavoidable if you’re invested in stocks; it affects virtually all equities regardless of individual company performances.
To fortify a portfolio against such downturns, diversification into other asset classes, particularly bonds, is crucial. However, not just any bonds will do — specific types, like those held by the BMO Ultra Short-Term Bond ETF (ZST)6, are particularly beneficial in these scenarios.
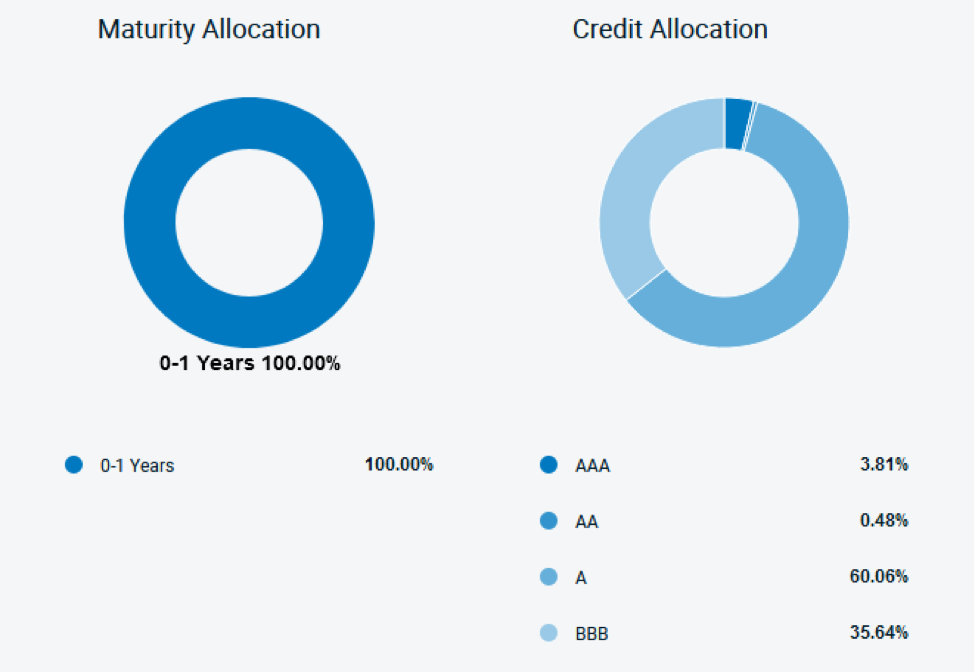
ZST, which pays monthly distributions, primarily selects investment-grade corporate bonds6. The focus on high credit quality, predominantly A and BBB rated bonds, is critical for reducing risk as these ratings indicate a lower likelihood of default and thus, offer greater safety during economic uncertainties.
Moreover, ZST targets bonds with less than a year until maturity6. This short duration is pivotal for those looking to minimize interest rate risk. Short-term bonds are less sensitive to changes in interest rates compared to long-term bonds, which can experience significant price drops when rates rise.
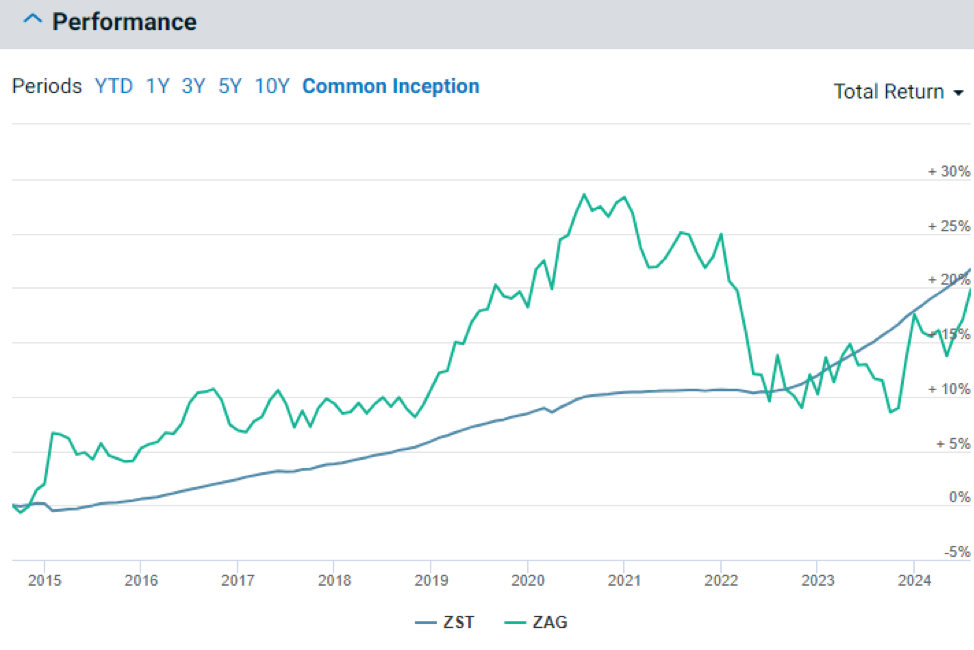
Charts as of July 31st, 2024 6
This strategic combination of high credit quality and short maturity durations7 is why, as demonstrated in the chart below, ZST has been able to steadily appreciate in value without experiencing the same level of volatility as broader aggregate bond ETFs like the BMO Aggregate Bond ETF (ZAG)8.
Buffer ETFs
If you recall the days of using training wheels when learning to ride a bike, you’ll appreciate the concept of buffer ETFs. Just as training wheels keep you from tipping over while also limiting how fast and freely you can ride, buffer ETFs aim to moderate the range of investment outcomes — both up and down.
Buffer ETFs may sound complex, but the principle behind them is straightforward. These ETFs utilize options to limit your downside risk while also capping your potential upside returns.
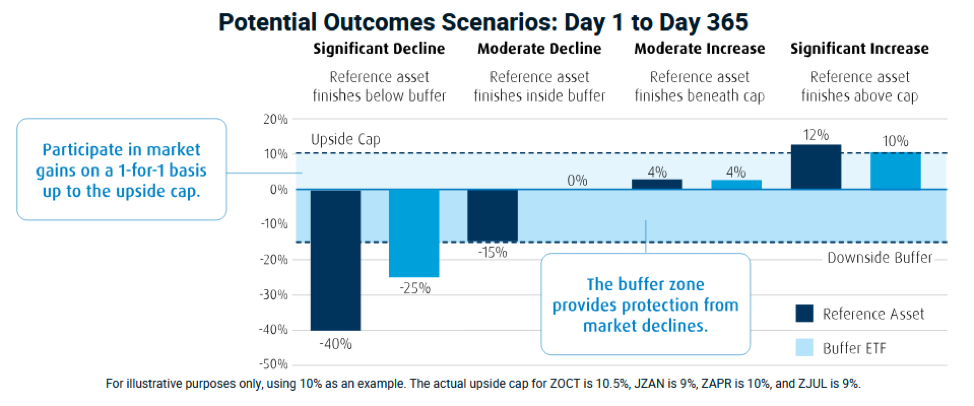
For example, a buffer ETF might offer to limit your exposure to a maximum 10% price return of a reference asset (like the S&P 500 index) over a year while absorbing the first -15% of any losses during the same period.
If the reference asset rises, your investment increases alongside it, up to a 10% cap. However, if the reference asset declines, the ETF absorbs the first 15% of any loss. Only after this “downside buffer” is exhausted would you start to experience losses.
BMO offers four such buffer ETFs, each named according to the start month of their outcome period when the initial upside cap and buffer limits are set. These include: Continue Reading…
The term “investment synergy” entered common investor use during the takeover craze of the 1960s — but we see a new synergy that’s a big plus for investors.
Image courtesy TSInetwork.ca
The term “synergy” entered common investor use during the takeover craze of the 1960s, when businesses started to expand by taking over companies in unrelated fields. This was supposed to make the combined companies grow faster than if they had stuck to their own fields.
The acquirers borrowed a term from biology to explain their rationale: this mix-rather-than-match growth strategy brought synergistic benefits. Synergy refers to an interaction between two or more drugs. The total effect of the drugs is greater than the sum of the individual effects of each drug if taken separately. For instance, today’s treatments for cancer, prostate and other health issues often call for prescribing two or more drugs. The combined impact may be more powerful and beneficial than you’d expect from adding up what they could do separately.
However, the synergy effect can also be negative. For example, combining alcohol with tranquilizers or opiates can lead to negative outcomes, even death.
The impact of 1960s investment synergy-seeking growth was uneven. Sometimes it worked, but it was better at producing temporary gains in stock prices than lasting gains in corporate earnings. In later decades, however, it turned out that unwinding synergy-seeking takeovers could lead to even larger profits.
This unwinding broke companies up into a “parent” and one or more “spinoffs.” The parent would then hand out shares in the spinoff to its own shareholders, as a special dividend.
A number of academic researchers have studied the outcome of spinoffs. Most found that spinoffs produce some of the most dependable profits you can find in the stock market, at least for patient investors. The academic findings were so impressive that we called spinoffs “the closest thing to a sure thing that you can find in investing.” (In fact, we were so impressed that it spurred us to launch our Spinoffs & Takeovers newsletter.)
You can find a number of processes in finance and investing that seem vaguely biological or scientific. For instance, consider Moore’s Law. It refers to the 1965 observation made by Gordon Moore (co-founder of Intel Corp.) that the number of transistors in a dense integrated circuit (now called a microprocessor) doubles about every two years. As a result, costs drop by half, and computing speed doubles. (Manufacturing progress later cut that time down to 18 months.)
This high growth rate was due to improvements in the basic design of early transistors. The continuing improvements spurred fast growth in the profits of Intel and other microprocessor stocks, and sharp gains in their stock prices in the 1980s and 1990s. Around 2005, however, the rise in computer processing speed began to slow. Now some bearish analysts predict that Moore’s Law is dead. They say the effect is bound to peter out because microprocessors can only get so small before they quit working. Meanwhile, cramming too many processors on a chip can lead to over-heating. Continue Reading…
So don’t ask me no questions
And I won’t tell you no lies
So don’t ask me about my business
And I won’t tell you goodbye
Lynyrd Skynyrd
Image courtesy Outcome/Shutterstock
By Noah Solomon
Special to Financial Independence Hub
I know virtually nothing about investing in private companies. However, I do know a thing or two about the theoretical and practical aspects of asset allocation and portfolio construction. In this vein, I will discuss the value of private equity (PE) investments within a portfolio context. Importantly, I will explain why PE investments may contribute less to one’s portfolio than is widely perceived.
Before I get into it, I am compelled to state one important caveat. Generalized statements about PE are less meaningful than is the case with public equities. The dispersion of returns across public equity funds is far lower than across PE managers. Whereas most long stock funds fall within +/- 5% of the average over a several year period, there is a far wider dispersion among underperformers and outperformers in the PE space. As such, it is important to note that the following analysis does not apply to any specific PE investment but rather to PE as an asset class in general.
The Perfect Asset Class?
PE allocations are broadly perceived as offering higher returns than their publicly traded counterparts. In addition, they are regarded as having lower volatility than and lower correlation to stocks. Given these perceived attributes, PE investments can be regarded as the “magic sauce” for increasing portfolio returns while lowering portfolio volatility. In combination, these attributes can significantly enhance portfolios’ risk-adjusted returns. However, the assumptions underlying these features are highly questionable.
Saturation, Lower Returns, & Echoes of Charlie Munger
It is reasonable to expect that average returns within the PE industry will be lower than in decades past. The number of active PE firms has increased more than fivefold, from just under two thousand in 2000 to over 9000 today. This impressive increase pales in comparison to growth in assets under management, which went from roughly $600 billion in 2000 to $7.6 trillion as of the end of 2022. It seems unlikely if not impossible that the number of attractive investment opportunities can keep pace with the dramatic increase in the amount of money chasing them.
Another reason to suspect that PE managers’ returns will be lower going forward is that their incentives and objectives have changed. The smaller PE industry of yesteryear was incentivized to deliver strong returns to maximize performance fees. In contrast, today’s behemoth managers are motivated to maximize assets under management and management fees. The name of the game is to raise as much money as possible, invest it as quickly as possible, and begin raising money for the next fund. The objective is no longer to produce the best returns, but rather to deliver acceptable returns on the largest asset base possible. As the great Charlie Munger stated, “Show me the incentive and I’ll show you the outcome.”
There are no Bear Markets in Private Equity!
It is also likely that PE investments on average have both higher volatility and greater correlation to stocks than may appear. The values of public equities are determined by exchange-quoted prices every single day. In contrast, private assets are not marked to market daily. Not only do PE managers value their holdings infrequently, but they also must employ a significant degree of subjectivity in determining the value of their holdings. Importantly, there is an inherent bias for not adjusting private valuations when public equities suffer losses. Continue Reading…