Tag Archives: stocks

Private Equity: A Portfolio Perspective

So don’t ask me no questions
And I won’t tell you no lies
So don’t ask me about my business
And I won’t tell you goodbye

  • Lynyrd Skynyrd
Image courtesy Outcome/Shutterstock

By Noah Solomon

Special to Financial Independence Hub

I know virtually nothing about investing in private companies. However, I do know a thing or two about the theoretical and practical aspects of asset allocation and portfolio construction. In this vein, I will discuss the value of private equity (PE) investments within a portfolio context. Importantly, I will explain why PE investments may contribute less to one’s portfolio than is widely perceived.

Before I get into it, I am compelled to state one important caveat. Generalized statements about PE are less meaningful than is the case with public equities. The dispersion of returns across public equity funds is far lower than across PE managers. Whereas most long stock funds fall within +/- 5% of the average over a several year period, there is a far wider dispersion among underperformers and outperformers in the PE space. As such, it is important to note that the following analysis does not apply to any specific PE investment but rather to PE as an asset class in general.

The Perfect Asset Class?

PE allocations are broadly perceived as offering higher returns than their publicly traded counterparts. In addition, they are regarded as having lower volatility than and lower correlation to stocks. Given these perceived attributes, PE investments can be regarded as the “magic sauce” for increasing portfolio returns while lowering portfolio volatility. In combination, these attributes can significantly enhance portfolios’ risk-adjusted returns. However, the assumptions underlying these features are highly questionable.

Saturation, Lower Returns, & Echoes of Charlie Munger

It is reasonable to expect that average returns within the PE industry will be lower than in decades past. The number of active PE firms has increased more than fivefold, from just under two thousand in 2000 to over 9000 today. This impressive increase pales in comparison to growth in assets under management, which went from roughly $600 billion in 2000 to $7.6 trillion as of the end of 2022. It seems unlikely if not impossible that the number of attractive investment opportunities can keep pace with the dramatic increase in the amount of money chasing them.

Another reason to suspect that PE managers’ returns will be lower going forward is that their incentives and objectives have changed. The smaller PE industry of yesteryear was incentivized to deliver strong returns to maximize performance fees.  In contrast, today’s behemoth managers are motivated to maximize assets under management and management fees. The name of the game is to raise as much money as possible, invest it as quickly as possible, and begin raising money for the next fund. The objective is no longer to produce the best returns, but rather to deliver acceptable returns on the largest asset base possible. As the great Charlie Munger stated, “Show me the incentive and I’ll show you the outcome.”

There are no Bear Markets in Private Equity!

It is also likely that PE investments on average have both higher volatility and greater correlation to stocks than may appear. The values of public equities are determined by exchange-quoted prices every single day. In contrast, private assets are not marked to market daily. Not only do PE managers value their holdings infrequently, but they also must employ a significant degree of subjectivity in determining the value of their holdings. Importantly, there is an inherent bias for not adjusting private valuations when public equities suffer losses. Continue Reading…


Are Alternative Investments really the Holy Grail of Investing?

Amazon.ca

By Michael J. Wiener

Special to Financial Independence Hub 

Tony Robbins’ latest book, The Holy Grail of Investing, written with Christopher Zook, is a strong sales pitch for investors to move into alternative investments such as private equity, private credit, and venture capital.

I decided to give it a chance to challenge my current plans to stay out of alternative investments.  The book has some interesting parts — mainly the interviews with several alternative investment managers — but it didn’t change my mind.

The book begins with the usual disclaimers about not being intended “to serve as the basis for any financial decision” and not being a substitute for expert legal and accounting advice.  However, it also has a disclosure:

“Tony Robbins is a minority passive shareholder of CAZ Investments, an SEC registered investment advisor (RIA).  Mr. Robbins does not have an active role in the company.  However, as shareholder, Mr. Robbins and Mr. Zook have a financial incentive to promote and direct business to CAZ Investments.”

This disclosure could certainly make a reader suspect the authors’ motives for their breathless promotion of the benefits of alternative investments and their reverence for alternative investment managers.  However, I chose to ignore this and evaluate the book’s contents for myself.

The most compelling part of the pitch was that “private equity produced average annual returns of 14.28 percent over the thirty-six-year period ending in 2022.  The S&P 500 produced 9.24 percent.”  Unfortunately, the way private equity returns are calculated is misleading, as I explained in an earlier post.  The actual returns investors get is lower than these advertised returns.

Ray Dalio and uncorrelated investment strategies

The authors frequently repeat that Ray “Dalio’s approach is to utilize eight to twelve uncorrelated investment strategies.”  However, if the reported returns of alternative investments are fantasies, then their correlation values are fantasies as well.  I have no confidence as an investor that my true risk level would be as low as it appears.

Much of the rest of the authors’ descriptions of alternative investments sounds good, but there is no good reason for me to believe that I would get better returns than if I continue to own public equities.

I choose not to invest in individual stocks because I know that I’d be competing against brilliant investors working full-time.  I don’t place my money with star fund managers because I can’t predict which few managers will outperform by enough to cover their fees.  These problems look even worse to me in the alternative investment space.  I don’t lack confidence, but I try to be realistic about going up against the best in the world. Continue Reading…

June Checkup: Healthcare & Technology

Image courtesy Harvest ETFs

By Ambrose O’Callaghan, Harvest ETFs

(Sponsor Blog)

The United States stock markets have delivered positive returns through much of 2024, continuing the positive momentum that was established in the previous year.

However, that performance has increasingly been powered by a smaller segment of large-cap companies. Indeed, readers have undoubtedly heard about the outsized performance of the “Magnificent 7” in the tech space over the past year. If we strip out the “big six” of Amazon, Meta, Nvidia, Microsoft, Apple, and Alphabet from the S&P 500, we have experienced three calendar quarters of negative earnings growth across the rest of the market.

Investors took profits in the month of April. Demand resumed in the month of May, but with a broader range of equities. Nvidia continued to show its dominance, but there were other sectors and stocks that were able to catch up with the leaders to close out the first half of 2024.

The summer season is historically slow in the markets. Harvest’s portfolio management team expects volatility to persist for both bonds and equities. Moreover, the team emphasizes that this summer is a key moment to stay active, attentive, and invested. A prudent strategy in this environment involves looking under the surface for opportunities while generating cash flow from call options to support total returns.

June Healthcare check up

The healthcare sector pulled back slightly in the month of May 2024. Negative moves in the healthcare sector over the course of May 2024 were driven by stock specific events. Macroeconomic data sets impacted the healthcare sector in line with others. Within healthcare, the managed care subsectors experienced volatility earlier in 2024 and changes to reimbursement structures impacted valuations in the near term. The Tools & Diagnostics sub-sector has also proven volatile due largely to a slower-than-expected recovery in China.

Regardless, there are still very promising opportunities in the GLP-1 drug category space for diabetes and obesity. The uptake of these drugs in the U.S. has been significant at a still-early stage in their lifespan. A recent study from Manulife Canada found that drug claims for anti-obesity medications in Canada rose more than 42% from 2022 to 2023.

Harvest Healthcare Leaders Income ETF (HHL:TSX) offers exposure to the innovative leaders in this vital sector. This equally weighted portfolio of 20 large-cap global Healthcare companies aims to select stocks for their potential to provide attractive monthly income as well as long-term growth. HHL is the largest active healthcare ETF in Canada and boasts a high monthly cash distribution of $0.0583.

Harvest Healthcare Leaders Enhanced Income ETF (HHLE:TSX) is built to provide higher income every month by applying modest leverage to HHL. It last paid out a monthly cash distribution of $0.0913 per unit. That represents a current yield of 10.44% as at June 14, 2024.

Where does the technology sector stand right now?

Investors poured back into technology stocks in May 2024 after taking profits in the month of April. However, they were more discriminating than in previous months and showed a preference for hardware stocks, specifically semiconductors.

Nvidia maintained its leadership position. It has soared past a $3 trillion market capitalization in the first half of June 2024. However, other AI-related tech stocks encountered turbulence which may give some investors pause around the broader bullish case for AI. Continue Reading…

Noah Solomon: The Times they are A-Changin’

Shutterstock/ Photo Contributuor PHLD Luca.

Come gather ’round people
Wherever you roam
And admit that the waters
Around you have grown
And accept it that soon
You’ll be drenched to the bone
If your time to you is worth savin’
And you better start swimmin’
Or you’ll sink like a stone
For the times they are a-changin’

  • Bob Dylan © Sony/ATV Music Publishing LLC

By Noah Solomon

Special to Financial Independence Hub

In this month’s commentary, I will discuss both how and why the environment going forward will differ markedly from the one to which investors have grown accustomed. Importantly, I will explain the repercussions of this shift and the related implications for investment portfolios.

The Rear View Mirror: Where we’ve been

After being appointed Fed Chairman in 1979, Paul Volcker embarked on a vicious campaign to break the back of inflation, raising rates as high as 20%. His steely resolve ushered in a prolonged era of low inflation, declining rates, and the favourable investment environment that prevailed over the next four decades.

Importantly, there have been other forces at work that abetted this disinflationary, ultra-low-rate backdrop. In particular, the influence of China’s rapid industrialization and growth cannot be underestimated. Specifically, the integration of hundreds of millions of participants into the global pool of labour represents a colossally positive supply side shock that served to keep inflation at previously unthinkably well-tamed levels in the face of record low rates.

It’s all about Rates

The long-term effects of low inflation and declining rates on asset prices cannot be understated. According to Buffett:

“Interest rates power everything in the economic universe. They are like gravity in valuations. If interest rates are nothing, values can be almost infinite. If interest rates are extremely high, that’s a huge gravitational pull on values.”

On the earnings front, low rates make it easier for consumers to borrow money for purchases, thereby increasing companies’ sales volumes and revenues. They also enhance companies’ profitability by lowering their cost of capital and making it easier for them to invest in facilities, equipment, and inventory. Lastly, higher asset prices create a virtuous cycle: they cause a wealth effect where people feel richer and more willing to spend, thereby further spurring company profits and even higher asset prices.

Declining rates also exert a huge influence on valuations. The fair value of a company can be determined by calculating the present value of its future cash flows. As such, lower rates result in higher multiples, from elevated P/E ratios on stocks to higher multiples on operating income from real estate assets, etc.

The effects of the one-two punch of higher earnings and higher valuations unleashed by decades of falling rates cannot be overestimated. Stocks had an incredible four decade run, with the S&P 500 Index rising from a low of 102 in August 1982 to 4,796 by the beginning of 2022, producing a compound annual return of 10.3%. For private equity and other levered strategies, the macroeconomic backdrop has been particularly hospitable, resulting in windfall profits.

From Good to Great: The Special Case of Long-Duration Growth Assets

While low inflation and rates have been favourable for asset prices generally, they have provided rocket fuel for long-duration growth assets.

The anticipated future profits of growth stocks dwarf their current earnings. As such, investors in these companies must wait longer to receive future cash flows than those who purchase value stocks, whose profits are not nearly as back-end loaded.

All else being equal, growth companies become more attractive relative to value stocks when rates are low because the opportunity cost of not having capital parked in safe assets such as cash or high-quality bonds is low. Conversely, growth companies become less enticing vs. value stocks in higher rate regimes.

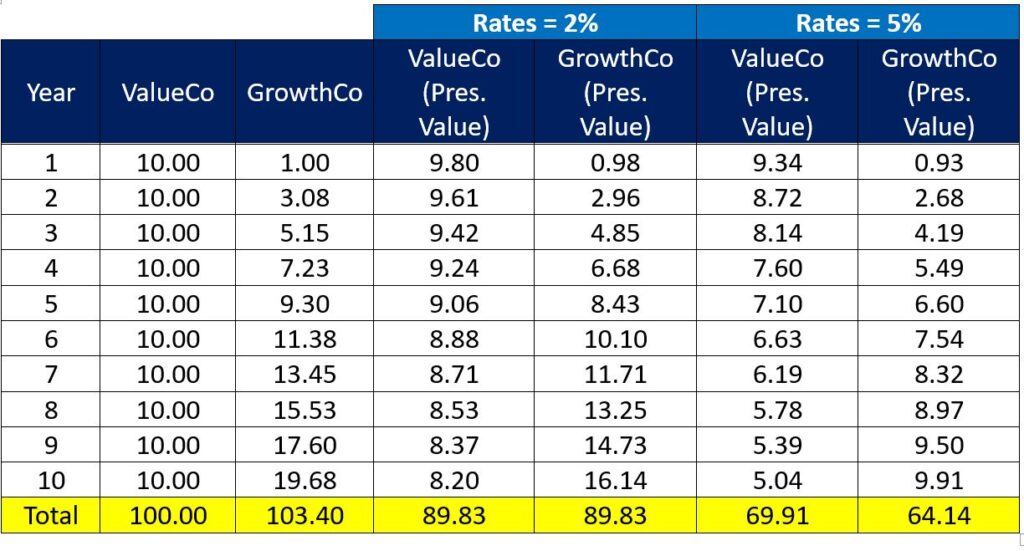
Example: The Effect of Higher Interest Rates on Value vs. Growth Companies

The earnings of the value company are the same every year. In contrast, those of the growth company are smaller at first and then increase over time.

  • With rates at 2%, the present value of both companies’ earnings over the next 10 years is identical at $89.83.
  • With rates at 5%, the present value of the value company’s earnings decreases to $69.91 while those of the growth company declines to $64.14.
  • With no change in the earnings of either company, an increase in rates from 2% to 5% causes the present value of the value company’s earnings to exceed that of its growth counterpart by 9%.

Losing an Illusion makes you Wiser than Finding a Truth

There are several features of the global landscape that will make it challenging for inflation to be as well-behaved as it has been in decades past. Rather, there are several reasons to suspect that inflation may normalize in the 3%-4% range and remain there for several years.

  • In response to rising geopolitical tensions and protectionism, many companies are investing in reshoring and nearshoring. This will exert upward pressure on costs, or at least stymie the forces that were central to the disinflationary trend of the past several decades.
  • The unfolding transition to more sustainable sources of energy has and will continue to stoke increased demand for green metals such as copper and other commodities.
  • ESG investing and the dearth of commodities-related capital expenditures over the past several years will constrain supply growth for the foreseeable future. The resulting supply crunch meets demand boom is likely to cause an acute shortage of natural resources, thereby exerting upward pressure on prices and inflation.
  • The world’s population has increased by approximately one billion since the global financial crisis. In India, there are roughly one billion people who do not have air conditioning. Roughly the same number of people in China do not have a car. As these countries continue to develop, their changing consumption patterns will stoke demand for natural resources, thereby exerting upward pressure on prices.
  • Labour unrest and strikes are on the rise. This trend will further contribute to upward pressure on wages and prices.

A Word about Debt

The U.S. government is amassing debt at an unsustainable rate, with spending up 10% on a year-over-year basis and a deficit running near $2 trillion. Following years of unsustainable debt growth (with no clear end in sight), the U.S. is either near or at the point where there are only four ways out of its debt trap:

  1. Raise taxes
  2. Cut spending/entitlements
  3. Default
  4. Stealth default (see below) Continue Reading…

Franklin Templeton mid-year outlook: Caution lights on Recession

Jeffrey Schulze

The 12 variables used to forecast Recessions are currently “signalling caution,” says Jeffrey Schulze, CFA.

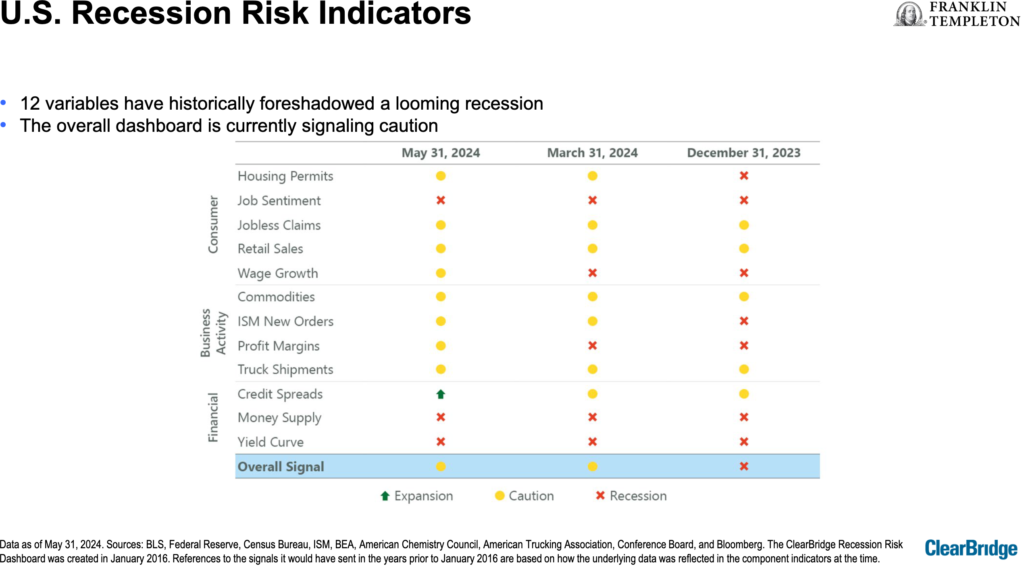
Speaking Wednesday in Toronto at Franklin Templeton’s mid-year outlook, Schulze — Managing Director, Head of Economic and Market Strategy for Clearbridge Investments — told financial advisors and media that as of May 2024,  the 12 variables he tracks have “historically foreshadowed a looming recession … the overall dashboard [shown below] is currently signalling caution.”


Three indicators — Job Sentiment, Money Supply and Yield Curve — have been flashing red since the end of 2023 and continue to be, as you can see in the above chart taken from a presentation made available to attendees. The only green light is Credit Spreads, while the other eight — which include Housing Permits, Jobless Claims and Profit Margins — are all a cautionary yellow.

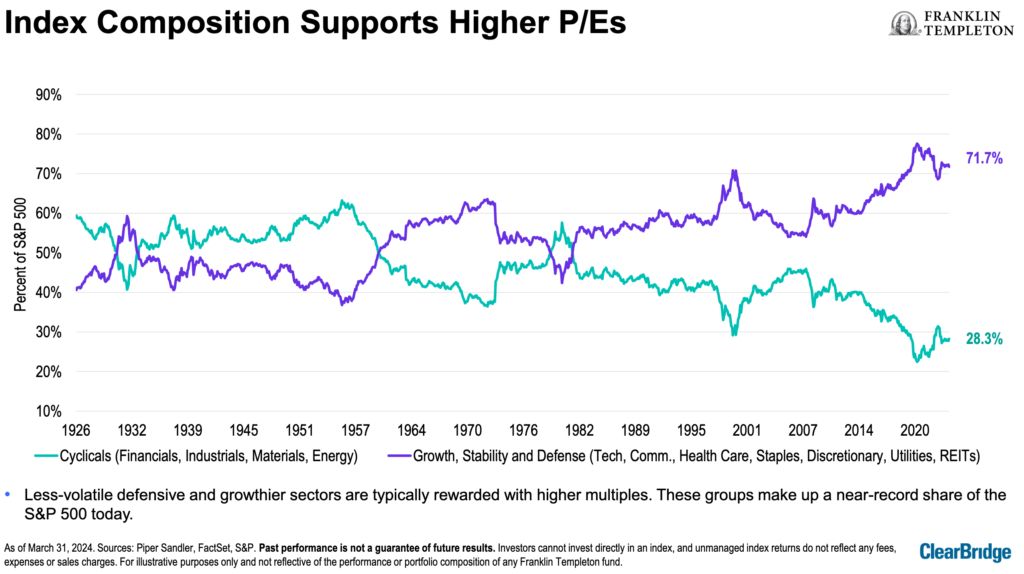
However, stock valuations do not appear to be too stretched at present. The composition of major stock indexes, such as the S&P500, support higher P/E ratios, Schulze said. “Less-volatile defensive and growthier sectors are typically rewarded with higher multiples. These groups make up a near-record share of the S&P 500 today.” As you can see in the chart below and in the higher purple line of the graph, these Defensive stocks include Tech, Consumer Staples, Utilities, and Health Care.

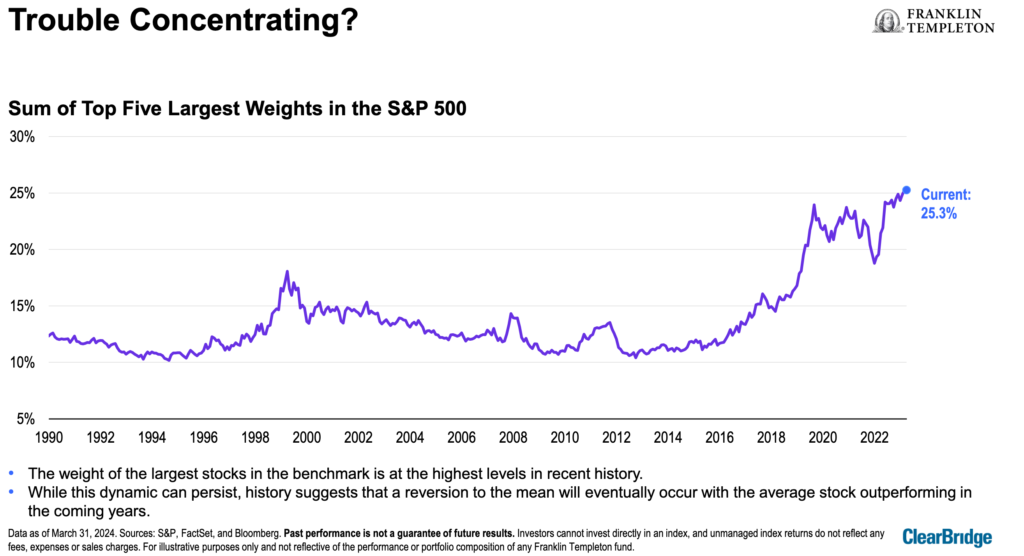
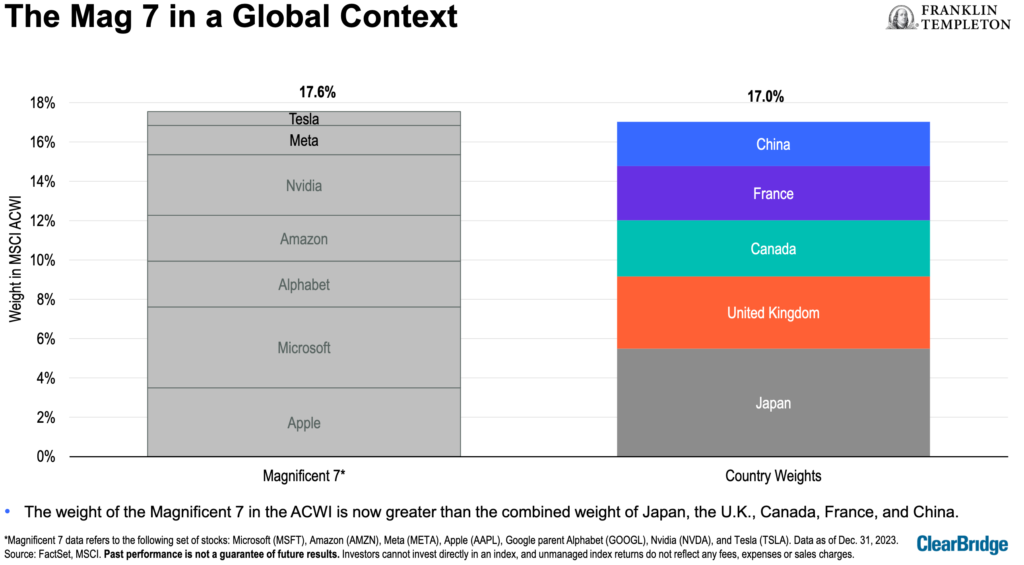
However, Schulze did note a “troubling” record-high concentration of the largest S&P500 names by market weight. As you can see in the chart below, the five largest-cap components now account for more than a quarter (25.3%) of the index, which is “the highest levels in recent history … While this dynamic can persist, history suggests that a reversion to the mean will eventually occur with the average stock outperforming in the coming years.”


In fact, the combined weight of the so-called Magnificent 7 tech stocks now exceeds the combined market weight of the stock markets of Japan, the U.K., Canada, France, and China!


However, “after behaving fairly monolithically in 2023, the performance of the Mag 7 members have diverged substantially so far in 2024,” Schulze said. A slide of the “Divergent 7”  showed Tesla down 28.3% and Apple flat, while the others were higher, led by the 121.4% surge in the price of Nvidia this year.

A key driver of the Mag 7 outperformance has been superior earnings growth, Schulze said, but “this advantage is expected to dissipate in the coming year,  which could be the catalyst for a sustained leadership rotation.”

Companies that grow their dividends are overdue to start outperforming. “Over the past year, dividend growers have trailed the broader market to a degree rarely seen over the past three decades … Past instances of similar underperformance have been followed with a strong bounce-back for dividend growers.”

A positive for markets is the “copious” amount of cash sitting on the sidelines and being readied to deploy on buying stocks. After the October 2022 lows, investors flocked into money market funds with a net increase of US$1.5 trillion, or 32%, Schulze said:  “Should the Fed embark upon its widely anticipated cutting cycle later this year, investors may reallocate. This represents a potential source of upside for equities.” Continue Reading…