Tag Archives: stocks

The changing perceptions of Normal

Image courtesty Outcome/Creative Commons

By Noah Solomon

Special to Financial Independence Hub

In response to rapidly accelerating inflation, central banks began raising rates aggressively at the beginning of 2022. Ever since, wild swings in bond markets have had a tremendous impact on virtually every single asset class.

This month, I examine the recent spike in rates from a historical perspective. Importantly, I will discuss the likely range of interest rates over the foreseeable future and the associated implications for financial markets.

When the Fed and other central banks were confronted with financial disaster in late 2008, they slashed interest rates to zero and deployed additional stimulative measures to ward off what many thought could be another Great Depression. Global rates then remained at levels that were both well below historical averages and the rate of inflation for the next 13 years.

In 2008, the runaway inflation of the 1980s and the painful medicine of record high rates that were required to subdue it were still relatively fresh in people’s minds. At that time, had you asked anyone what would be the most likely result of keeping rates near zero for over a decade, their most likely response would have been runaway inflation. And yet, inflation remained strangely subdued. According to most experts, this unexpected result is largely attributable to a relatively benign geopolitical climate and a related push toward global outsourcing.

This led to the notion of a “new normal” in which inflation was permanently expunged. Over the span of only 13 years, people went from fearing inflation to believing that it was a relic of the past unworthy of serious consideration. This false sense of comfort caused central banks and investors alike to be caught off guard in late 2021 when they realized that inflation had not been permanently vanquished but was merely hibernating.

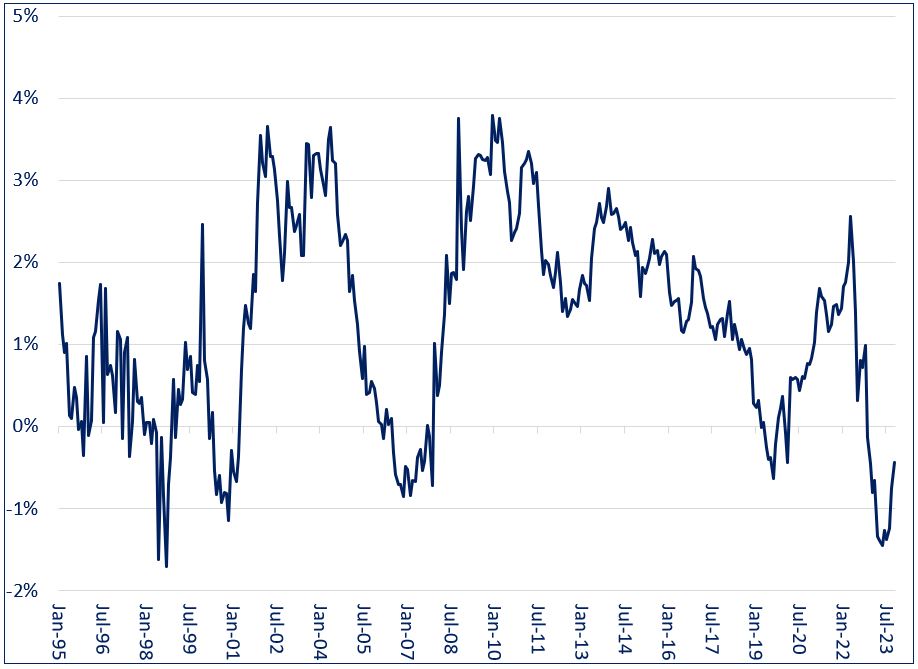
These sentiments were evident in bond markets. After rates were slashed to zero during the global financial crisis, investors were skeptical that they would remain there for long before stoking inflation. Longer-term rates remained well above their short-term counterparts, with the yield on 10-year U.S. Treasuries retaining an average 1.9% premium above the Fed Funds rate from 2009 – 2020.

However, 13 years of ultra-low rates with no sign of inflation allayed such fears, with the yield spread crossing into negative territory late last year and reaching a low of -1.5% in May of 2023. Even the rapid acceleration in inflation in late 2021 failed to fully disavow investors of the notion that the era of low inflation had come to an end, with current 10-year rates falling below their overnight counterparts.

10 U.S. Treasury Yield Minus Fed Funds Rate (1995 – Present)


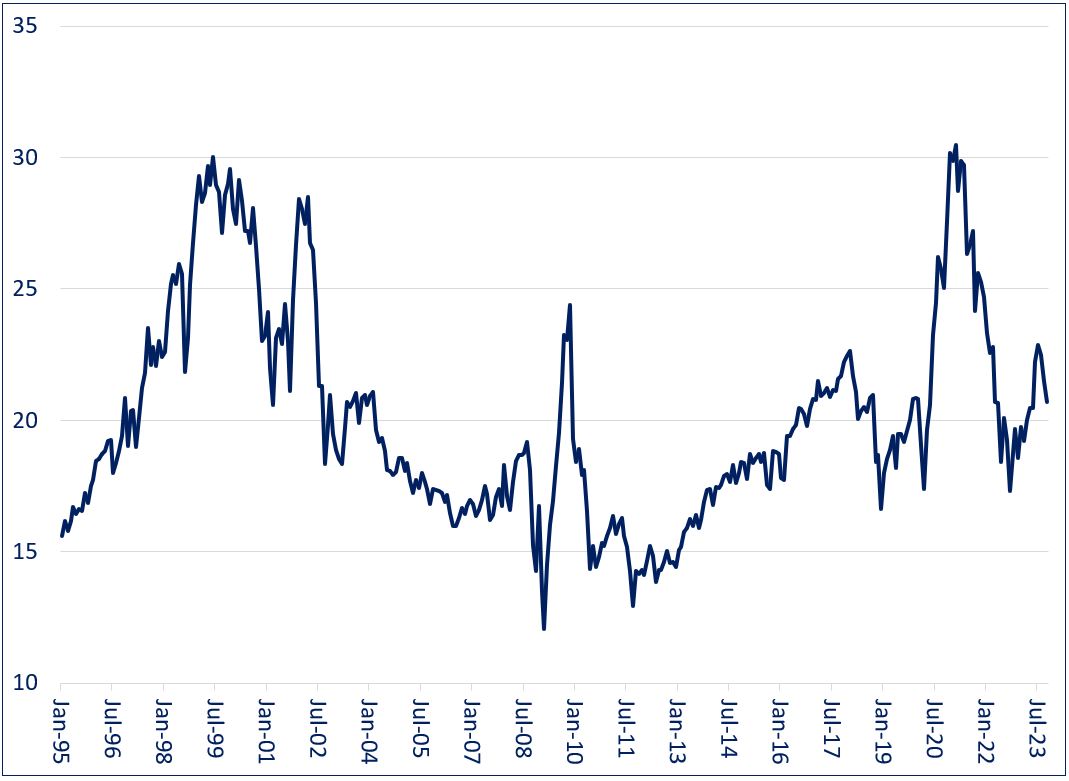
Equity markets danced to the same tune as their bond counterparts. When central banks cut interest rates to zero during the global financial crisis, investors were dubious that inflation would not soon rear its ugly head. Multiples remained relatively normal, with the P/E ratio of the S&P 500 Index averaging 16.4 for the five years beginning in 2009.

Over the ensuing several years, investors became complacent that the world would never again experience inflation issues, with the S&P 500’s P/E ratio climbing as high as 30 by early 2021. Multiples have since remained somewhat elevated by historical standards, indicating that markets have not fully embraced the fact that inflation may not be as well-behaved as what they are used to.

S&P 500 P/E Ratio (1995 – Present)


The Rising Tide of Declining Rates: Not to be Underestimated

According to legendary investor Marty Zweig:

“In the stock market, as with horse racing, money makes the mare go. Monetary conditions exert an enormous influence on stock prices. Indeed, the monetary climate – primarily the trend in interest rates and Federal Reserve policy – is the dominant factor in determining the stock market’s major direction.”

The 2,000-basis point decline in interest rates from 1980 to 2020 not only turbocharged aggregate demand (and by extension corporate revenues), but also dramatically lowered companies’ cost of capital. In tandem, these two developments were nothing short of a miracle for corporate profits and asset prices. Continue Reading…

These three ETFs are responsible for most of my wealth

AlainGuillot.com

By Alain Guillot

Special to Financial Independence Hub

I was a day trader for almost 10 years.

Oh, I was so smart. I was smarter than the market and all its participants. But I was not, I was delusional. I wasted my time trying to guest the direction of the markets. I had good months in which I felt I was going to be a millionaire, and then in one bad trade I would lose most of my gains.

The one lesson I discovered, and maybe was worth the price of all my losses was that passive investment works.

The strategy create by John Bogle many decades ago is till paying huge dividends. Mr. Bogle was the founder of Vanguard Funds, the inventor of Passive Investing, a strategy created for the masses. Ever since I started passive investing my portfolio has been going up at a staggering rate.

My investments are composed of three main investments:

VFV (Vanguard S&P 500 US Index ETF)
XIU (iShares S&P/TSX 60 Index ETF)
VIU (Vanguard FTSE Developed all caps ex North America)

Plus other individual stocks that mostly lose me money. Continue Reading…

The waiting is the hardest part, and the most profitable times for investors


By Dale Roberts

Special to Financial Independence Hub

Investors are starting to notice that their portfolios have been treading water for a couple of years. Over the last two years, a global balanced growth portfolio would essentially be flat. Of course, move out to 3-year, 5-year and 10-year time horizons and we have very solid to generous returns.

At times investors have to wait. We build and springload the portfolio waiting for the next aggressive move higher. In fact, these holding periods can be beneficial: we are loading up on stocks at stagnating or lower prices. We’re able to buy more shares. The waiting is the hardest part for investors. But it is essential that we understand the benefits to sticking to our investment plan.

In January of 2021 I wondered aloud in a MoneySense post if the markets might not like what they see when we get to the other side of the pandemic. That’s an interesting post that looks back at the year 2020, the year the world changed with the first modern day pandemic. That suspicion is ‘kinda’ playing out as the markets stall and try to figure things out.

That’s not to suggest that my hunch was an investable idea. We have to stay invested.

Stick to your plan when the market gets stuck

Patience is the most important practice when it comes to wealth building. When done correctly, building life-changing wealth happens in slow motion and it is VERY boring.

Boring is good.

Waiting can be boring. But maybe it can look and feel more ‘exciting’ if we know what usually happens after the wait. Stock markets work like evolution. There are long periods of stagnation and status quo and then rapid moves and change.

Instead of boring, maybe it should feel like a kid waiting for Christmas. The good stuff is on its way.

Here’s an example of a waiting period, from 1999. The chart is from iShares, for the TSX 60 (XIU/TSX). The returns include dividend reinvestment.

And here’s the stock market ‘explosion’ after the wait.

That’s more than a double from the beginning of the waiting period.

And here’s the wait from 2007, moving through the financial crisis. Ya, that’s a 7-year wait. Talk about the 7-year itch, many investors filed for divorce from the markets.

It was a costly divorce.

Markets went on a very nice run for several years. Continue Reading…

Why would anyone own bonds now?


By Mark Seed, myownadvisor

Special to Financial Independence Hub 

“Many investors have been saying for years that rates can only go up from here, rates can only go one direction, rates will eventually go up. Will they?” – My Own Advisor, September 2021.

My, how things can and do change.

In today’s post, I look back at what I wrote in September 2021 to determine if I still feel that way for our portfolio.

Why would anyone own bonds now?

Why own bonds?

For years, decades, generations in fact, bonds have made sense for a diversified, balanced portfolio.

The main reason is this: bonds can reduce volatility due to their low or negative correlation with stocks. The more that investors learn about diversification, the more likely they are to add bonds to their portfolios.

That said, they don’t always make sense for everyone, all the time, always.

I’ll take a page from someone who was much smarter than I am on this subject:

Ben Graham on 100% stocks and cash

Ben Graham, on stocks, bonds and cash. Source: The Intelligent Investor.

Another key takeaway from this specific chapter of The Intelligent Investor is the 75/25 rule. This implies more conservative investors that don’t meet Ben Graham’s criteria above could consider splitting your portfolio between 75% stocks and 25% bonds. This specific split allows an investor to capture some upside by investing in mostly stocks while also protecting your investments with bonds.

Because stocks offer more potential upside, there is higher risk. Bonds offer more stability, so they come with lower returns than stocks in the long run.

As a DIY investor, this just makes so much sense since I’ve seen this playout in my/our own portfolio when it comes to our 15+ years of DIY investment returns. Our long-term returns exceed the returns I would have had with any balanced 60/40 stock/bond portfolio over the same period.

There is absolutely nothing wrong with a 60/40 balanced portfolio held over decades, of course.

From Russell Investments earlier this year:

“Fixed income has historically been considered the ballast in a portfolio, offering stability and diversification against equity market fluctuations. Over the last 40 years, a balanced portfolio of 60% Canadian equities and 40% Canadian bonds would have returned 8.5% annualized with standard deviation of 9.3%. While a portfolio consisting solely of fixed income would have had lower return with lower risk, a portfolio consisting solely of equities would have had only slightly higher return but substantially higher risk.”

Source: https://russellinvestments.com/ca/blog/the-60-40-portfolio

1/1983 – 12/2022 Canada Equities Canada Bonds Balanced Portfolio 
Annualized Return 8.8% 7.2%  8.5%
Annualized Volatility 14.4% 5.3%  9.3%

Pretty darn good from 60/40.

So, while I continue to believe the main role of bonds in your portfolio is essentially safety – not investment returns – we can see above that bonds when mixed with stocks can be enablers/stabilizers and deliver meaningful returns over long investment periods as well.

As Andrew Hallam, Millionaire Teacher has so kindly put it over the years, including some moments on this site to me:

… when stocks fall hard, bonds act like parachutes for your portfolio. Bonds might not always rise when the equity markets drop. But broad bond market indexes don’t crash like stocks do …

Is that enough to own bonds in your portfolio?

Maybe.

Here are a few reasons to own bonds, in no particular order: Continue Reading…

Risk, Return & the Essence of Adding Value

Image courtesy Outcome/Shutterstock

By Noah Solomon

Special to Financial Independence Hub

This month, I explore how the relationship between risk and return forms the bedrock of sound (or poor) investment results. I will also demonstrate why the management of these two elements constitutes the essence of adding or destroying value for investors. Lastly, (reader beware), I include a rant about investor complacency and the detrimental effects it can have on one’s wealth.

Good is Not the Enemy of Great: It is Great

David VanBenschoten was the head of the General Mills pension fund. In each of his 14 years in this role, the fund’s return had never ranked above the 27th percentile or below the 47th percentile.

Using simple math, one might assume that over the entire period the fund would have stood in the 37th percentile, which is the midpoint of its lowest and highest ranks. However, despite never knocking the lights out in any given year, VanBenschoten managed to achieve top-tier results over the entire period. By consistently attaining 2nd quartile performance in each and every year, over the 14-year period the fund achieved an enviable 4th percentile ranking.

The Hippocratic Oath and Investing

The seemingly irreconcilable difference between the average of VanBenschoten’s rankings and his overall rank over the whole 14-year period stems as much from the performance of other funds as from his own results.

To achieve outstanding performance, one must deviate from the crowd. However, doing so is a proverbial double-edged sword, as it can lead to vastly superior or inferior results. The preceding rankings indicate that most of the managers who were at the top of the pack in some years also had a commensurate tendency to be near the bottom in others, thereby tarnishing their overall rankings over the entire period.

In contrast, the General Mills pension fund, by being consistently warm rather than intermittently hot or cold, managed to outperform most of its peers. Managers who aim for top decile performance often end up shooting themselves in the foot. The moral of the story is that when it comes to producing superior results over the long term, consistently avoiding underperformance tends to be more important than occasionally achieving outperformance. In this vein, managers should take the physicians’ Hippocratic Oath and pledge to “first do no harm.”

Robbing Peter to Pay Paul: The Bright and Dark Sides of Asymmetry

The Latin term Sine Que Non describes an action that is essential and indispensable. In the world of investing, the ability to produce asymmetrical results meets this definition. It is the ultimate determinant of skill.

A manager who delivers twice the returns of their benchmark but has also experienced twice the volatility neither creates nor destroys value. They have simply robbed Peter (higher volatility) to pay Paul (commensurately higher returns). Since markets tend to go up over time, clients may marvel at the manager’s superior long-term returns. However, this does not change the fact that no value has been created – clients have merely paid in full for higher returns in the form of higher volatility.

If this same manager delivered 1.5 times the benchmark returns while experiencing twice the volatility, not only would they have failed to add value but would have destroyed it – they would have simply robbed Peter by exposing him to higher volatility while paying Paul less in the form of excess returns. In contrast, if the manager had produced twice the returns of the benchmark while experiencing only 1.5 times its volatility, then they deserve a firm pat on the back. They would have achieved asymmetrically positive results by paying Paul far more in outperformance than what they stole from Peter in higher volatility.

The Efficient Market Hypothesis: Why bother?

The efficient-market hypothesis (EMH) states that asset prices reflect all available information, causing securities to always be priced correctly and making markets efficient. By extension, the EMH asserts that you cannot achieve higher returns without assuming a commensurate amount of incremental risk, nor can you reduce risk without sacrificing a commensurate amount of return. It argues that it is impossible to consistently “beat the market” on a risk-adjusted basis. When applied to the decision to hire an active manager rather than a passive index fund, the EMH can be neatly summarized as “why bother?”

Continue Reading…