Tag Archives: valuations

Extremes breed Opposites

Darling, I don’t know
Why I go to extremes
Too high or too low
There ain’t no in-betweens
And if I stand or I fall
It’s all or nothing at all
Darling, I don’t know
Why
I go to extremes


  • I Go to Extremes, by Billy Joel
Image Shutterstock, courtesy of Outcome

By Noah Solomon

Special to Financial Independence Hub

The stock market crash of 1929, which was followed by the Great Depression, was arguably the best thing to happen to investors in the history of modern markets.

I am in no way suggesting that investors took pleasure in having their life savings largely obliterated, nor am I implying that bear markets are enjoyable. However, the tremendous pain that people experienced left them with a deep distrust of stocks that lasted for decades. It was this wariness that kept valuations in check, thereby paving the way for strong returns.

Both the passage of time and rising markets eventually led investors to relinquish their pessimism. Eventually, acceptance morphed into adulation, the widespread view that stocks harbored no risk, and an “it can only go up” mindset that culminated in the late 1990s tech bubble. This excessive optimism caused valuations to become untethered from reality, with the S&P 500 Index reaching its highest valuation in history and huge market capitalizations being awarded to companies with little or no earnings.

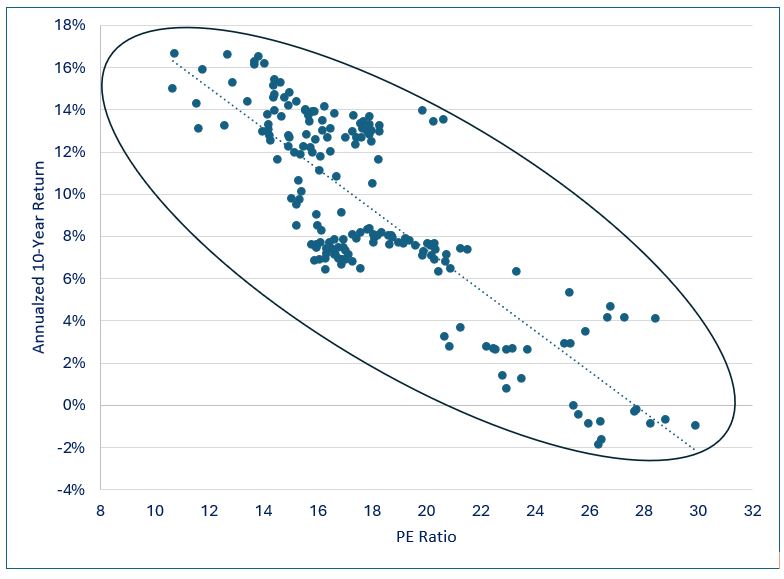
The irrational enthusiasm which created and propelled one of the greatest bubbles in modern history also set the stage for its ultimate demise in the form of a painfully long and deep bear market. Over shorter periods, fear can result in missed opportunities and regret while greed may get rewarded. However, over the long term, starting points of excessive pessimism set the stage for healthy markets while starting points of excessive optimism pave the way for disappointment. This observation is captured in the following graph, which clearly demonstrates that higher starting valuations lead to lower returns, and vice versa.

S&P 500 Index: PE Ratio vs. 10-Year Annualized Returns


This relationship brings to mind the following guiding principles of legendary investor Howard Marks:

  • It’s not what you buy, it’s what you pay that counts.  
  • Good investing doesn’t come from buying good things, but from buying things well.  
  • There’s no asset so good that it can’t become overpriced and thus dangerous, and there are few assets that are so bad that they can’t get cheap enough to be a bargain.  
  • The riskiest thing in the world is the belief that there’s no risk.

Forget Forecasting: Context is Everything

I know that booms, recessions, bull markets, and bear markets have happened and that they will happen. Where I run into trouble is knowing when they will happen. I am in good company when it comes to this deficiency, as economic forecasting has by and large proven to be an exercise in futility. As famed economist John Kenneth Galbraith stated, “The only function of economic forecasting is to make astrology look respectable”.

Given that predicting when changes in economic conditions will occur is a fool’s errand, investors should instead concern themselves with how markets will react if they occur. Importantly the same change can have a vastly different effect on markets depending on where valuations stand. Specifically, stock market multiples can be a gauge of the extent to which prices will decline in reaction to an adverse shift in the economic backdrop. Continue Reading…

Offence vs Defence

  • Ch-ch-ch-ch-changes
  • Turn and face the strange
  • Ch-ch-changes
  • Don’t want to be a richer man
  • Ch-ch-ch-ch-changes
  • Turn and face the strange
  • Ch-ch-changes
  • There’s gonna have to be a different man
  • Time may change me
  • But I can’t trace time — Changes, by David Bowie
Image courtesy Outcome/Shutterstock

By Noah Solomon

Special to Financial Independence Hub

There is a basic principle that most people follow when it comes to their spending decisions. In essence, people generally try to either

(1) Get the most they can for the least amount of money, or

(2) Spend the least amount of money on the things they want (i.e. get the best deal)

In other words, rational utility maximizers try to be as efficient as possible when parting with their hard-earned dollars.

Strangely, many investors abandon this principle when it comes to their portfolios. With investing, what you get is return (hopefully more than less), and what you pay (other than fees) is risk. People often focus on return without any regard for the amount of risk they are taking. Alternately, many make the mistake of reducing risk at any cost, regardless of the magnitude of potential returns they leave on the table.

The foundation of successful investing necessitates achieving an optimal balance between return and risk. Different types of assets (volatile speculative stocks, stable dividend paying stocks, bonds, etc.) have very different risk and return characteristics. Relatedly, a portfolio’s level of exposure to different asset classes is the primary determinant of its risk and return profile, including how efficient the balance is between the two.

Offense, Defense, & Bobby Knight

Robert Montgomery “Bobby” Knight was an American men’s college basketball coach. Nicknamed “the General,”h e won 902 NCAA Division I men’s basketball games, a record at the time of his retirement. He is quoted as saying:

“As coaches we talk about two things: offense and defense. There is a third phase we neglect, which is more important. It’s conversion from offense to defense and defense to offense.”

Nobody can escape the fact that you can’t have your cake and eat it too. You can’t increase potential returns without taking greater risk. Similarly, you can’t reduce the possibility of losses without reducing the potential for returns.

Picking up Pennies in Front of a Steamroller vs. Shooting Fish in a Barrel

Notwithstanding this unfortunate tradeoff, there are times when investors should focus heavily on return on capital (i.e. being more aggressive), times when they should be more concerned with return of capital (i.e. being more defensive), and all points in between.

Sometimes, there is significantly more downside than upside from taking risk. Although it is still possible to reap decent returns in such environments, the odds aren’t in your favour. Reaching further out on the risk curve in such regimes is akin to picking up pennies in front of a steamroller:  the potential rewards are small relative to the possible consequences. At the other end of the spectrum, there are environments in which the probability of gains dwarfs the probability of losses. Although there is a relatively small chance that you could lose money in such circumstances, the wind is clearly at your back. At these junctures, dialing up your risk exposure is akin to shooting fish in a barrel – the likelihood of success is high while the risk of an adverse event is small.

John F. Kennedy & the Chameleonic Nature of Markets

Former President John F. Kennedy asserted that “The one unchangeable certainty is that nothing is certain or unchangeable.” With regard to markets, the risk and return profiles of different asset classes are not stagnant. Rather, they change over time depending on a variety of factors, including interest rates, economic growth, inflation, valuations, etc.

Given this dynamic, it follows that determining your optimal asset mix is not a “one and done” treatise, but rather a dynamic process that takes into account changing conditions. Yesterday’s optimal portfolio may not look like today’s, which in turn may be significantly different than the one of the future.

It’s not just the risk vs. return profile of any given asset class that should inform its weight with portfolios, but also how it compares with those for other asset classes. As such, investors should use changing risk/return profiles among asset classes to “tilt” their portfolios, increasing the weights of certain types of investments while decreasing others.

In “normal” times, the expected return from stocks exceeds the yields offered by cash and high-grade bonds by roughly 3% per annum. However, this difference can expand or contract depending on economic conditions and relative valuations among asset classes.

In the decade plus era following the global financial crisis, not only did rates remain at historically low levels, but the prospective returns on equities were abnormally high given the positive impact that low rates have on spending, earnings growth, and multiples. Against this backdrop, the prospective returns from stocks far exceeded yields on safe harbour investments. Under these conditions, it is no surprise that investors who had outsized exposure to stocks vs. bonds were handsomely rewarded.

Expected Return on Stocks vs. Yield on High Grade Bonds: Post GFC Era

As things currently stand, the picture is markedly different. Following the most significant rate-hiking cycle in decades, bonds are once again “back in the game.” Moreover, lofty equity market valuations (at least in the U.S.) suggest that the S&P 500 Index will deliver below-average returns over the next several years. Continue Reading…

The History of Shiny New Toys: Are U.S. Tech valuations stretched?


Just as I thought it was going alright
I found out I’m wrong when I thought I was right
It’s always the same, it’s just a shame, that’s all
I could say day and you’d say night
Tell me it’s black when I know that it’s white
Always the same, it’s just a shame, and that’s all

— That’s All, by Genesis

Shutterstock/Outcome

By Noah Solomon

Special to Financial Independence Hub

As we enter 2025, the general consensus is that stocks are set to deliver another year of decent returns. Most strategists contend that we will be in a goldilocks environment characterized by positive readings on economic growth, profits, inflation, and rates.

This sentiment is particularly evident in the current valuation level of the S&P 500 Index. Regardless of which metric one uses, the index is extremely elevated relative to its historical range. Interestingly, U.S. stocks are an outlier when compared to other major markets (including Canada), which are trading at valuations that are in line with historical averages.


The Best of Times and the Worst of Times

Unfortunately, the history books are quite clear about what can happen to markets that attain peak valuations. The four largest debacles in the history of modern markets were all preceded by peak valuations.

  • In 1929, the U.S stock market traded at the highest PE multiple in its history up to that time. This lofty multiple presaged the worst 10 years in the history of the U.S. stock market.
  • In 1989, the Japanese stock market was trading at 65 times earnings. The aggregate value of Japanese stocks exceeded that of U.S. stocks despite the fact that the U.S. economy was three times the size of its Japanese counterpart. Soon after, things went from sensational to miserable, with Japanese stocks suffering a particularly prolonged and steep decline.
  • In early 2000, the S&P 500 Index, aided and abetted by a tremendous bubble in technology, media, and telecom stocks, reached the highest multiple in its history. Not long thereafter, the index suffered a peak trough decline of roughly 50% over the next few years.
  • In early 2008, the S&P 500 stood at its highest valuation in history, with the exception of the multiples that preceded the Great Depression and the tech wreck. The ensuing debacle brought the global economy to the brink of collapse and required an unprecedented amount of monetary stimulus and government bailouts.

The bottom line is that markets have historically been a very poor predictor of the future. At times when asset prices were most convinced of heaven, they could not have been more wrong. The loftiest valuations have not merely been followed by tough times, but by the worst of times. Time and gain, peak multiples have foreshadowed the worst results, which brings to mind one of my favorite quotes from John Kenneth Galbraith:

“There can be few fields of human endeavor in which history counts for so little as in the world of finance. Past experience, to the extent that it is part of memory at all, is dismissed as the primitive refuge of those who do not have the insight to appreciate the incredible wonders of the present.”

The Common Feature

There is one common feature to these sorrowful tales of peak multiples which ended in tears. In each case, peak valuations followed a prolonged period of near-perfect environments characterized by strong economic and profit growth unmarred by any obvious clouds on the horizon.

  • The years preceding the Great Depression entailed an economy that had not merely been growing but booming.
  • Prior to 1989, the Japanese economy enjoyed decades of torrid growth, prompting some economists and strategists to predict that it would eventually eclipse the U.S. economy.
  • In early 2008, the U.S. economy was being propelled by a real estate bubble underpinned by an “it can only go up” mindset and a related explosion in lax credit and lending standards.

The S&P 500 Index currently stands at its highest multiple in the postwar era, save for the late 1990s tech bubble. Optimists justify this development by pointing to what they believe to be a rosy future with respect to the U.S. economy, earnings, inflation, and interest rates. Sound familiar?

I’m not saying that highly elevated multiples necessarily foreshadow imminent doom. However, when juxtaposing the current valuation of the S&P 500 with historical experience, one should consider becoming more defensive. As famous philosopher George Santayana stated, “Those who cannot remember the past are condemned to repeat it.”

Driving without Airbags or Seatbelts

The underlying cause of the aforementioned market crashes is not merely economies and profits that were contracting, but that asset prices were priced for exactly the opposite. This left markets woefully exposed when the proverbial music stopped.

Think of market risk like you think about driving a car. If you are driving a car with airbags and you are wearing a seatbelt, then chances are you will emerge with minimal or no injuries if you get into an accident. However, if your car has no airbags and you are not wearing a seatbelt, then the chances that you will sustain serious injuries (or worse) are materially higher. Similarly, when multiples are at or below average levels and profits hit a rough patch, the resulting carnage in asset prices tends to be muted. Conversely, if any financial bumps in the road occur when valuations lie significantly higher than historical averages, then the ensuing losses will be much more severe. Also, even if you manage to complete your journey without any mishaps, it’s not clear that having no airbags and not wearing a seatbelt made your ride much more enjoyable or comfortable than if this had not been the case. Continue Reading…

Is it reasonable to have irrationally high return expectations?

Image courtesy Pexels: Jakub Zerdzicki

By John De Goey, CFP, CIM

Special to Financial Independence Hub

When I ask clients and prospective clients about the return expectations they have for their portfolios, the responses vary wildly …  anywhere from ‘about 5%’ to ‘over 10%.’  Almost all of these expectations are too high.

 Admittedly, clients have different risk profiles leading to different asset allocations and ultimately, different outcomes. That’s reasonable.  A problem crops up when otherwise reasonable people have been socialized into having out-sized expectations.  How does one ethically re-calibrate expectations for irrational optimists who nonetheless think they’re within their rights to have those expectations?

The behavioural finance concept is overconfidence, although the attitude involves elements of optimism bias, cognitive dissonance and old-fashioned hubris, too. To quote J.M. Keynes: “Markets can remain irrational longer than you can remain solvent.” Few investors are prepared to acknowledge that the recent bull market seems unlikely to continue and that a recession appears to be on the horizon.

Learning from past Crashes

If we have learned anything from the great crashes of 1929, 1974, 2001 and more recently, the global financial crisis, it is that investors (often spurred by accommodative policy positions) can come to think of themselves as being all but invincible when central bankers are accommodative. Too often, they also lose their nerve when markets tumble and stay low for a prolonged period.

A good deal of personal finance is grounded in social psychology: especially group psychology.  People can get ahead through investing not only by being shrewd about valuations and such, but also by accurately anticipating how other market participants might react to a given set of circumstances.  Of course, it cuts both ways: and having reasonable expectations in the first place often assists investors in staying the course.

My concern is with the messaging being offered by many in the personal finance community these days is something I call “Bullshift.”  The industry shifts peoples’ attention to make them feel more bullish. To hear many in the business tell it, there’s no appreciable need to be concerned about high valuations, high debt levels (both public and private), a long-inverted yield curve and interest rates at generational highs.  Any one of these considerations would ordinarily give a rational investor pause. Taken together, they pose a clear and present danger for investors in the second half of 2024. Few seem concerned and it is that very lack of concern that concerns me.

Misleading investors with “Bullshift”

There is a directionally and mathematically accurate ad running by Questrade making the rounds that doesn’t tell the whole picture, either. Again, even the ‘good guys’ tend to mislead the average investor with Bullshift. The advertisement shows what you would earn over a long timeframe at 8% and what you would earn at 6%.

My question to you is simple: is it reasonable to assume an 8% return is even possible? There is longstanding evidence that higher-cost active investment strategies actually fail to outperform cheaper strategies such as passive index investing and that product cost certainly does matter. Continue Reading…

Why Debt-to-Market-Cap matters more than Debt-to-Equity

Understanding the Importance of the Debt-to-Market-Cap Ratio in Stock Analysis

Image courtesy TSINetwork.ca

When evaluating stocks, it’s crucial to assess their resilience during economic downturns and their potential for future prosperity. While the commonly used debt/equity ratio offers insights into a company’s financial leverage, it fails to capture certain nuances. In this article, we explore the significance of the debt-to-market-cap ratio in stock analysis and why it surpasses the debt/equity ratio.

By understanding the intricacies of this approach, investors can make more informed decisions and increase their chances of identifying companies poised for long-term success.

I was recently asked why I use debt-to-market-cap in my analyses, which is different from the debt/equity ratio seen in most other reports. My answer is two-fold. In analyzing a stock, you need to form an idea of how much it would get hurt in a recession. To put it another way, how likely it is to survive a business slump and go on to prosper when good times return? To do that, you need to look at a number of factors. These include the interest rate on its debt, how sensitive it is to the economic cycle, its pluses and minuses in relation to competitors, its vulnerability to adverse legal and regulatory decisions, its credit history and current credit rating … and so on.

Analyzing Debt-to-Equity Ratio

Many successful investors start by looking at the debt/equity ratio. This ratio comes in several variations, but the basic idea is that you measure a company’s financial leverage by comparing its debt with its shareholders’ equity. You assume an attractive company can earn a higher return on its total capital than the interest rate it pays on the debt portion of its capital. If so, the excess goes to shareholders’ equity, raising the total return to shareholders.

But leverage works both ways. If the total return falls short of the interest costs, the difference comes out of shareholders’ equity. When a company loses money, it still has to pay the interest and one day settle the debt. Generally, it does so by dipping into shareholders’ equity. In extreme cases, losses wipe out shareholders’ equity, and the stock becomes worthless. Then bondholders and lenders take over the assets to try to get back their investment. A high ratio of debt to equity increases the risk that the company (that is, the shareholders’ equity in the company) won’t survive a business slump.

However, this ratio can mislead because it compares a hard number with a soft one. Debt is usually a hard number. Bonds and other loans generally come with fixed interest rates, fixed terms of repayment and so on. Equity numbers are softer or ‘‘fuzzier.’’ They mostly reflect asset values as they appear on the balance sheet (minus debt, of course). But the balance-sheet figures may be misleading. They may be too high, if the company’s assets have shrunk in value since the company acquired them (that is, lost more value than the company’s accounting shows). In that case, the company may need to correct its balance sheet figures by cutting them or “taking a writedown.”

Or the equity value may be too low if the company’s assets have gained value since the company acquired them. This can happen with real estate, patents and other assets (which we refer to as “hidden assets”).Much of a company’s real value may rest in its “goodwill” — its brands, or the reputation and relationship it has built with customers over the years. This value would only appear on the balance sheet if it was bought rather than built up by the company’s operations.

Analyzing Debt-to-Market-Cap

Efficient market theory also leads us to favour debt-to-market-cap over debt-to-equity. This theory says that it’s impossible to beat the market, because the market is efficient and eventually reflects all information, good or bad. This idea had a lot to do with the creation of index funds. Market cap — the value of all shares the company has outstanding — benefits from the “wisdom of crowds.” Continue Reading…