Tag Archives: valuations

Valuation: Good for Long but not for Short

Graphic courtesy Outcome/QuoteInspector.com.

By Noah Solomon

Special to Financial Independence Hub

As I have written in the past, valuations are of no use for determining broad market returns over the short term.

To be clear, I am NOT implying that valuation doesn’t matter. Historical experience demonstrates that it has been an extremely powerful predictor of average returns over the long term. Without fail, whenever valuations have stood well below average levels, strong returns ensued over the next 7-10 years. Conversely, highly elevated valuations have preceded anemic or negative returns.

For investors interested in shorter-term market movements, sentiment indicators may harbor greater potential than their macroeconomic or valuation-based counterparts. In this month’s missive, I explore some of the more commonly cited indicators that purportedly possess short-term predictive capabilities to ascertain:

(1) Whether the historical record confirms the presence of any predictive power, and
(2) What these variables are signaling for markets in the near term.

The VIX Index: Embrace the Fear

The VIX Index represents the market’s expectations of the S&P 500 Index’s volatility over the next 30 days. Its level is derived from the prices of S&P 500 options with near-term expiration dates. Dubbed the “fear index,” the VIX is often used to gauge market sentiment, and in particular the degree of fear among market participants.

Historically, the VIX has served as a good, if imperfect indicator of market turning points:

  • Although it failed to provide a clear “get out of dodge” signal before the peak of the tech bubble in early 2000, the VIX’s historically stratospheric level in late 2002 indicated a level of extreme fear that signaled that better times were at hand.
  • In early 2007, the VIX stood at very depressed levels, indicating the high degree of complacency that contributed to the global financial crisis of 2008. Unfortunately, it was far too early in signaling the recovery. In October 2008, extremely elevated VIX levels were signaling the type of abundance of fear that often precedes rebounds, yet stocks still had plenty of downside before ultimately bottoming in March of 2009.
  • More recently, the VIX failed to provide a warning signal of the market turmoil of 2022. However, its extremely elevated stance in late October of 2022 signaled that a rebound was imminent.

VIX Index Levels and S&P 500 Index Returns: 1997 – Present

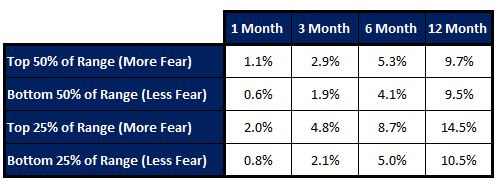
Putting specific bear markets and recoveries aside, the above table demonstrates that elevated VIX/fear levels have on average preceded higher returns, and depressed VIX/lower fear levels have foreshadowed lower returns. The historical record lends credence to Buffett’s sage advice that it is wise for investors to be “fearful when others are greedy, and greedy when others are fearful.”

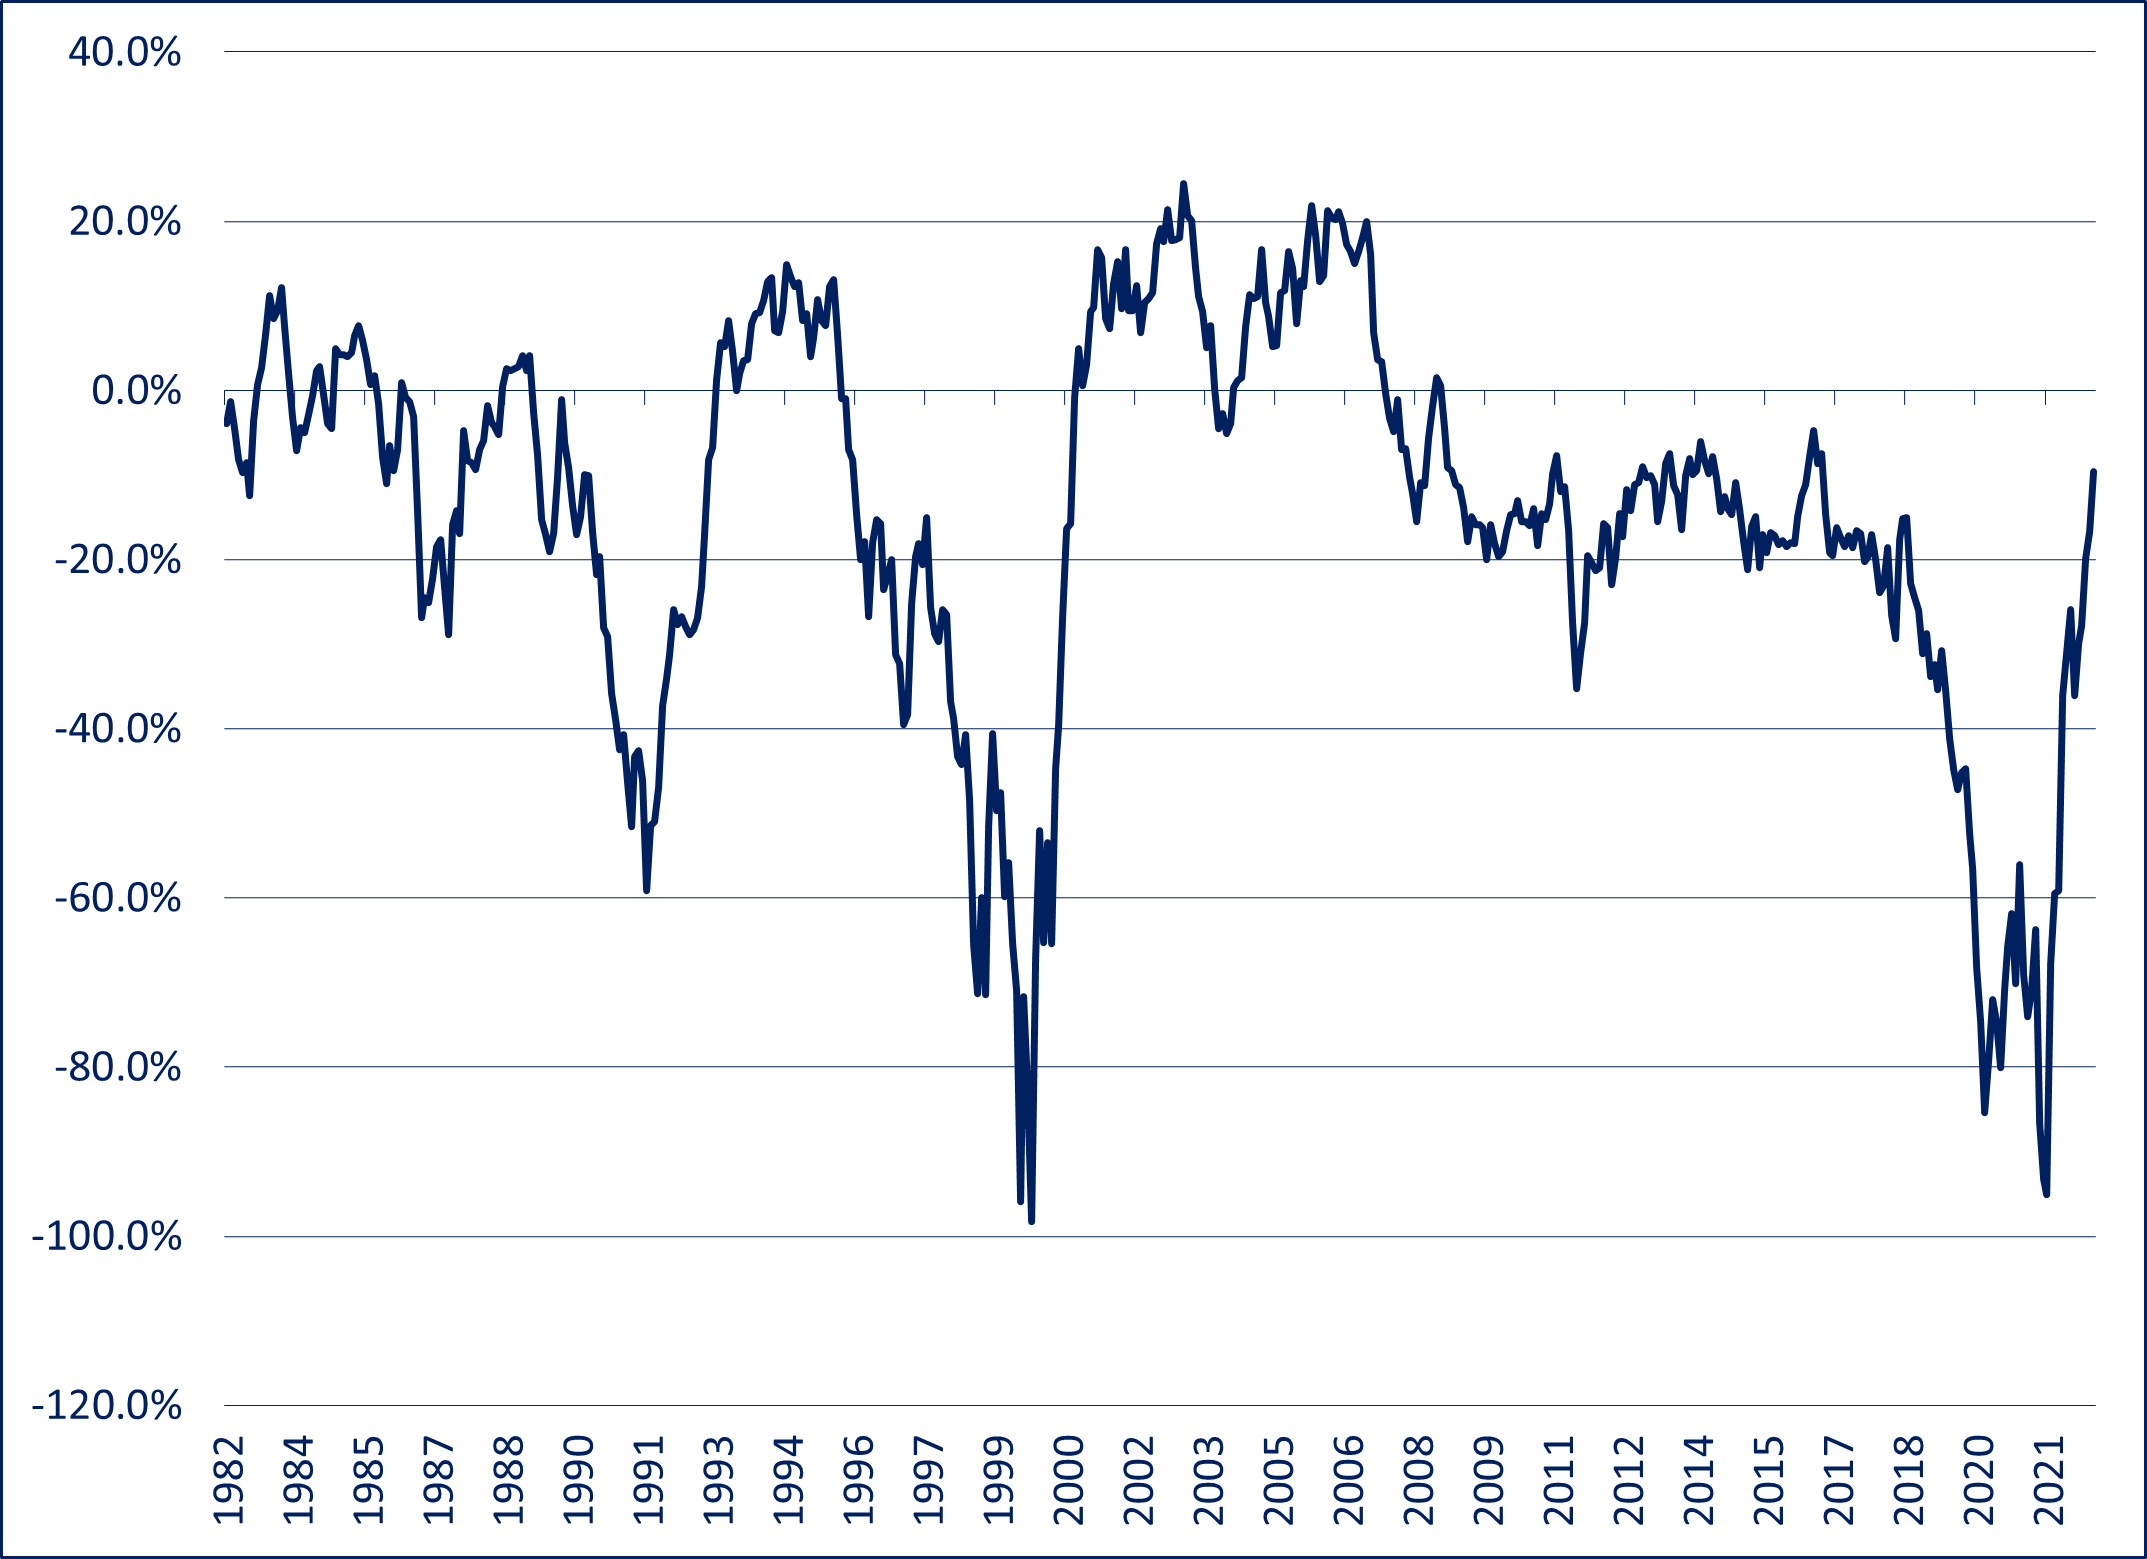
Put Call Ratio: Beware Cheap Insurance

Like the VIX Index, the put-call ratio (PCR) is widely used to gauge the overall mood of the market. Put options provide the right to sell stocks at a predetermined price and are often purchased as insurance to protect portfolios from market declines. Call options offer the right to buy stocks at a predetermined price and are frequently bought to capture upside participation when stock prices rise.

The PCR increases when the market participants’ desire for downside protection rises relative to their desire for upside participation. Alternately stated, a rise in the PCR is indicative of a rise in bearish sentiment. Conversely, the PCR falls when people become more focused on reaping gains than on avoiding losses, which is indicative of a rise in bullish sentiment.

Since 1997, the PCR has been a contrarian indicator, whereby elevated levels (high fear/low greed) have on average signaled higher returns and lower PCRs (low fear/high greed) have heralded subdued or negative results. Continue Reading…

The Greatest Paradox

Image Outcome/Public domain CC0 photo

By Noah Solomon

Special to Financial Independence Hub

In his role as head of research at Merrill Lynch, Bob Farrell established a reputation as one of the leading market analysts on Wall Street. In his famous “10 Market Rules to Remember,” Farrell summarized his insights on market tendencies.

One of Farrell’s rules states, “When all the experts and forecasts agree — something else is going to happen,” which embodies the essence of contrarianism.

In this month’s missive, I explore the roots and causal factors underlying Farrell’s warning, drawing on historical examples. I also illustrate the potential benefits and pitfalls of going against the crowd. Additionally, I demonstrate that market sentiment is currently approaching levels that have historically preceded broad market declines. Lastly, I suggest that there are specific areas where investors should consider trimming exposure, realizing gains, and paying the taxman.

There is no shortage of historical examples of “sure things” ending badly. In the late 1990s, following two decades of above-average returns, both institutional investors and consultants broadly embraced the dangerous consensus that future stock market returns would be about 11%. Dissenters and naysayers were few and far between.

The basis for these forecasts was the extrapolation of recent results. Stocks had been delivering average annualized returns of 11%, therefore it was assumed they would do so going forward – simple. Few investors contemplated the possibility that the past 15 years were anomalous from a longer-term perspective. More importantly, there was little concern that an extended period of above-average returns might have been borrowed from future returns by pushing up valuations to unsustainable levels.

The sad ending to this ebullience was the first three-year decline in equities since 1930. For the seven years ending March 31, 2007, following the market’s peak in early 2000, the annualized return of the S&P 500 was 0.9%. Importantly, these subpar returns encompassed a bitter and painful peak-trough loss of about 50%.

A similar occurrence of widespread adulation ending badly occurred only a half-decade later in 2005, when everyone “knew” residential real estate was a “surefire” way to amass wealth. Zealots justified unsustainable values with oft-cited mantras such as “They’re not making any more land,” “You can live in it,” etc. This blind optimism pushed real estate prices to unsustainable levels which all but guaranteed the subsequent collapse and some painful experiences for the “it can only go up” crowd.

Sorry, Beatles – All You Need is NOT Love

More often than not, what is obvious to the masses is wrong. There are valid explanations, both financial and behavioral, that cause the things which everyone believes to be true to turn out to be untrue.

In July 1967, the Beatles released their famous single All You Need Is Love. With all due respect to John, Paul, George, and Ringo, nothing could be further from the truth in the world of investing. Specifically, the more popular a particular investment becomes, the less its profit potential, if for no other reason than if everyone likes something, such adulation is likely to be reflected in its price.

In what is referred to as the bandwagon effect, investors often become enthusiastic about a particular investment or asset class after it has already produced strong returns. Believing that past outperformance is a sign of strong future returns, the herd then hops en masse on the proverbial bandwagon. This widespread fervor then causes prices to overshoot any rational approximation of value, thereby setting the stage for inevitable disappointment.

In the world of investing, “everyone knows” should come with a “buyer beware” warning. Investments that are heralded as sure things are bound to be fairly priced at best and often become dangerously overvalued. Great opportunities lead to great prices, which by definition means their greatness has been paid for in full, stripping them of their greatness. Conversely, it’s only when people disagree that opportunities to achieve above-average returns exist.

Risk: Reality vs. Perception

Managing risk is at least as important as (and inextricable from) achieving decent returns. Not only do irrational sentiment and expectations result in poor returns, but also give rise to elevated risk. Risk evolves in the same paradoxical manner as returns. As an asset follows the journey from normal to over-owned and overpriced, not only does its potential return deteriorate, but its risk increases.

When everybody becomes convinced that something will produce spectacular returns, then by extension they also believe that it involves little or no risk. This perception often leads investors to bid it up to the point where it becomes excessively risky. In contrast, when broadly negative opinion drives all the optimism out of an asset’s price, its risk profile becomes relatively small. Put another way, investment risk tends to reside most where it is least perceived, and vice versa.

In the world of investments, Bob Farrell trumps the Fab Four. Good investments are generally associated with skepticism, indifference, and even neglect, which sets the stage for high returns with lower risk. Inversely, widespread acceptance and adulation sow the seeds of high-risk and poor returns.

No Good Deed shall go Unpunished

As is the case with many aspects of markets, both timing and patience play an important role in contrarian investing.

Investment trends regularly go to extremes. It is this very tendency that results in calamities and opportunities. Unfortunately, life for managers is not as simple as buying cheap assets and selling their overvalued counterparts. As John Maynard Keynes stated, “The market can remain irrational longer than you can remain solvent.”

Not only can overvalued assets remain stubbornly so for extended periods of time but can become even more overvalued before they ultimately come back down to earth. By the same token, undervalued assets can remain cheap and become even cheaper before any payoff materializes. Sentiment can be a self-fulfilling prophecy for an indeterminable amount of time before reversing, turning previously favored investments into assets non grata, and the subjects of yesterday’s scorn into tomorrow’s darlings. Continue Reading…

Timeless Financial Tips #1: “It’s Already Priced In”

Lowrie Financial: Canva Custom Creation

By Steve Lowrie, CFA

Special to Financial Independence Hub

Understanding How Market Pricing Works

Let’s talk about the price of stocks.

It stands to reason: To make money in the market, you need to sell your holdings for more than you paid. Of course, we’re all familiar with good old buy low, sell high. But despite its simplicity, many investors fall short. Instead, they end up doing just the opposite, or at least leaving returns on the table that could have been theirs to keep.

You can defend against these human foibles by understanding how stock pricing works and using that knowledge to your advantage.

Good News, Bad News, and Market Views

How do you know when a stock or stock fund is priced for buying or selling?

The short answer is, we don’t.

And yet, many investors still let current events dominate their decisions. They sell when they fear bad news means prices are going to fall. Or they buy when good news breaks. They invest in funds that do the same.

While this may seem logical, there’s a problem with it: You’re betting you or your fund manager can place winning trades before markets have already priced in the news.

To be blunt, that’s a losing bet.

You’re betting that you know more about what the price should be at any given point than what the formidable force of the market has already decided. Every so often, you might be right. But the preponderance of the evidence suggests any “wins” are more a matter of luck than skill.

Me and You Against the World

Whenever you try to buy low or sell high, who is the force on the other side of the trading table?

It’s the market.

The market includes millions of individuals, institutions, banks, and brokerages trading hundreds of billions of dollars every moment of every day. It includes highly paid analysts continuously watching every move the markets make. It includes AI-driven engines seeking to get their trades in nanoseconds ahead of everyone else.

And you think you can beat that?

We believe it’s far more reasonable to assume, by the time you’ve heard the news, the collective market has too, and has already priced it in. Continue Reading…

Value Investing: Looking beneath the surface

Image from Outcome/QuoteInspector.com.

By Noah Solomon

Special to Financial Independence Hub

It goes without saying that 2022 was a less than stellar year for equity investors. The MSCI All Country World Index of stocks fell 18.4%. There was virtually nowhere to hide, with equities in nearly every country and region suffering significant losses. Canadian stocks were somewhat of a standout, with the TSX Composite Index falling only 5.8% for the year.

Looking below the surface, there was an interesting development underlying these broader market movements, with value stocks far outpacing their growth counterparts. Globally, value stocks suffered a loss of 7.5% as compared to a decline of 28.6% in growth stocks. This substantial outperformance was pervasive across countries and regions, including the U.S., Europe, Asia, and emerging markets. In the U.S., 2022’s outperformance of value stocks was the highest since the collapse of the tech bubble in 2000.

These historically outsized numbers have left investors wondering whether value’s outperformance has any legs left and/or whether they should now be tilting their portfolios in favor of a relative rebound in growth stocks. As the following missive demonstrates, value stocks are far more likely than not to continue outperforming.

Context is everything: Value is the “Dog” that finally has its Day

From a contextual perspective, 2022 followed an unprecedented period of value stock underperformance.

U.S Value vs. U.S. Growth Stocks – Rolling 3 Year Returns: 1982-2022


Although there have been (and will be) times when value stocks underperform their growth counterparts, the sheer scale of value’s underperformance in the several years preceding 2022 is almost without precedent in modern history. The extent of value vs. growth underperformance is matched only by that which occurred during growth stocks’ heyday in the internet bubble of the late 1990s.

Shades of Tech Bubble Insanity

The relative performance of growth vs. value stocks cannot be deemed either rational or irrational without analyzing their relative valuations. To the extent that the phenomenal winning streak of growth vs. value stocks in the runup to 2022 can be justified by commensurately superior earnings growth, it can be construed as rational. On the other hand, if the “rubber” of growth’s outperformance never met the “road” of superior profits, then at the very least you need to consider the possibility that crazy (i.e. greed, hope, etc.) had indeed entered the building.

The extreme valuations reached by many growth companies during the height of the pandemic bring to mind a warning that was issued by a market commentator during the tech bubble of the late 1990s, who stated that the prices of many stocks were “not only discounting the future, but also the hereafter.”

U.S. Value Stocks: Valuation Discount to U.S. Growth Stocks: (1995-2022)


Based on forward PE ratios, at the end of 2021 U.S. value stocks stood at a 56.3% discount to U.S. growth stocks. From a historical perspective, this discount is over double the average discount of 27.9% since 1995 and is matched only by the 56.6% discount near the height of the tech bubble in early 2000. This valuation anomaly was not just a U.S. phenomenon, with global value stocks hitting a 57.5% discount to global growth stocks, more than twice their average discount of 27.6% since 2002 and even larger than that which prevailed in early 2000 at the peak of the tech mania. Continue Reading…

All good things must come to an end: There by the grace of Paul Volcker went Asset Prices

Image courtesy Creative Commons/Outcome

By Noah Solomon

Special to Financial Independence Hub

During the OPEC oil embargo of the early 1970s, the price of oil jumped from roughly $24 to almost $65 in less than a year, causing a spike in the cost of many goods and services and igniting runaway inflation.

At that time, the workforce was much more unionized, with many labour agreements containing cost of living wage adjustments which were triggered by rising inflation.

The resulting increases in workers’ wages spurred further inflation, which in turn caused additional wage increases and ultimately led to a wage-price spiral.The consumer price index, which stood at 3.2% in 1972, rose to 11.0% by 1974. It then receded to a range of 6%-9% for four years before rebounding to 13.5% in 1980.

Image New York Times/Outcome

After being appointed Fed Chairman in 1979, Paul Volcker embarked on a vicious campaign to break the back of inflation, raising rates as high as 20%. His steely resolve brought inflation down to 3.2% by the end of 1983, setting the stage for an extended period of low inflation and falling interest rates. The decline in rates was turbocharged during the global financial crisis and the Covid pandemic, which prompted the Fed to adopt extremely stimulative policies and usher in over a decade of ultra-low rates.

Importantly, Volcker’s take no prisoners approach was largely responsible for the low inflation, declining rate, and generally favourable investment environment that prevailed over the next four decades.

How declining Interest Rates affect Asset Prices: Let me count the ways

The long-term effects of low inflation and declining rates on asset prices cannot be understated. According to [Warren] Buffett:

“Interest rates power everything in the economic universe. They are like gravity in valuations. If interest rates are nothing, values can be almost infinite. If interest rates are extremely high, that’s a huge gravitational pull on values.”

On the earnings front, low rates make it easier for consumers to borrow money for purchases, thereby increasing companies’ sales volumes and revenues. They also enhance companies’ profitability by lowering their cost of capital and making it easier for them to invest in facilities, equipment, and inventory. Lastly, higher profits and asset prices create a virtuous cycle – they cause a wealth effect where people feel richer and more willing to spend, thereby further spurring company profits and even higher asset prices.

Declining rates also exert a huge influence on valuations. The fair value of a company can be determined by calculating the present value of its future cash flows. As such, lower rates result in higher multiples, from elevated P/E ratios on stocks to higher multiples on operating income from real estate assets, etc.

The effects of the one-two punch of higher earnings and higher valuations unleashed by decades of falling rates cannot be overestimated. Stocks had an incredible four decade run, with the S&P 500 Index rising from a low of 102 in August 1982 to 4,796 by the beginning of 2022, producing a compound annual return of 10.3%. For private equity and other levered strategies, the macroeconomic backdrop has been particularly hospitable, resulting in windfall profits.

It is with good reason and ample evidence that investing legend Marty Zweig concluded:

“In the stock market, as with horse racing, money makes the mare go. Monetary conditions exert an enormous influence on stock prices. Indeed, the monetary climate – primarily the trend in interest rates and Federal Reserve policy – is the dominant factor in determining the stock market’s major direction.”

To be sure, there are other factors that provided tailwinds for markets over the last 40 years. Advances in technology and productivity gains bolstered profit margins. Limited military conflict undoubtedly played its part. Increased globalization and China’s massive contributions to global productive capacity also contributed to a favourable investment climate. These influences notwithstanding, 40 years of declining interest rates and cheap money have likely been the single greatest driver of rising asset prices.

All Good things must come to an End

The low inflation which enabled central banks to maintain historically low rates and keep the liquidity taps flowing has reversed course. In early 2021, inflation exploded through the upper band of the Fed’s desired range, prompting it to begin raising rates and embark on one of the quickest rate-hiking cycles in history. Continue Reading…