

 Posted By
By Travis Zhang
Special to Financial Independence Hub
Ask a Canadian what they make and you’ll get a confident number: “Eighty-five.” Ask what actually hit their account last Friday and the confidence evaporates. “Uh… two-something?”
That second number is the one that pays the rent. It is also the one that most of us have never looked at closely.
Here is the gap. An Ontario salary of $85,000, at 2026 rates, divides into a tidy $3,269 every two weeks. What actually lands after income tax, CPP and EI is $2,449. The missing $820 is not a mistake on your pay stub. It is the difference between the number we brag about and the number we live on.
I run CanPay Insights, a free take-home pay calculator for every province, checked against the CRA’s own payroll tables. Since August 7 it has quietly logged 8,183 anonymous calculations: no accounts, no IP addresses, just the shape of what people asked.
One honest caveat before the fun part. These are people who went looking for a pay calculator, not a random sample of Canadians. Think of it less as a census and more as a window into who does this arithmetic, and when.
The people doing the math are not the ones with the corner office
Fifty-eight per cent of calculations were for full-time hourly work, and another 13% for part-time hourly work. Salaried employees? Just 21%. And 44% of the incomes entered were under $50,000.
It makes sense. If you’re on salary, your paycheque is boringly identical every two weeks. If you’re paid by the hour, with a different shift schedule every week, every cheque is a small mystery. The people closest to the edge of their budget are the ones checking the math most often.
Peak pay anxiety: 3 p.m.
Forty-four per cent of calculations happened between 9 a.m. and 5 p.m., local time, with the busiest hour around 3 p.m. Translation: a lot of people are working out their pay at work. Possibly while looking at a job posting in another tab. We won’t tell.
The other end of the clock is more telling. Twenty-one per cent of calculations happened between 10 p.m. and 6 a.m. The data can’t say why, but I have a guess, and so do you: nobody runs payroll math at 2 a.m. for fun. And 71% of all checks came from a phone, which fits both the lunch-break and the lying-awake theories.
Your savings rate is probably better (and harder) than you think
Most savings rates are quoted against gross income. But you can only save from what reaches your account.
Take an Ontario earner on $60,000 who puts away $500 every paycheque. Against gross pay, that’s a respectable 21.7%. Against the $1,821 that actually arrives every two weeks, it’s 27.5%. The second number is the honest one. It tells you how much of the money you can actually touch is going to future-you, and how tight the rest of the month will feel.
The same logic cuts the other way. Every raise, bonus and side hustle is smaller than its headline once tax, CPP and EI take their share. Plan on gross numbers and you will reach your goals more slowly than your spreadsheet promises.
Four habits worth stealing
Negotiate in take-home dollars. A $5,000 raise from $55,000 to $60,000 in Ontario adds $3,479 a year to your take-home pay, about $134 a paycheque. In Quebec, the same raise adds $3,137. Still worth fighting for. Just know what you’re fighting for.
Compare provinces on what you keep.
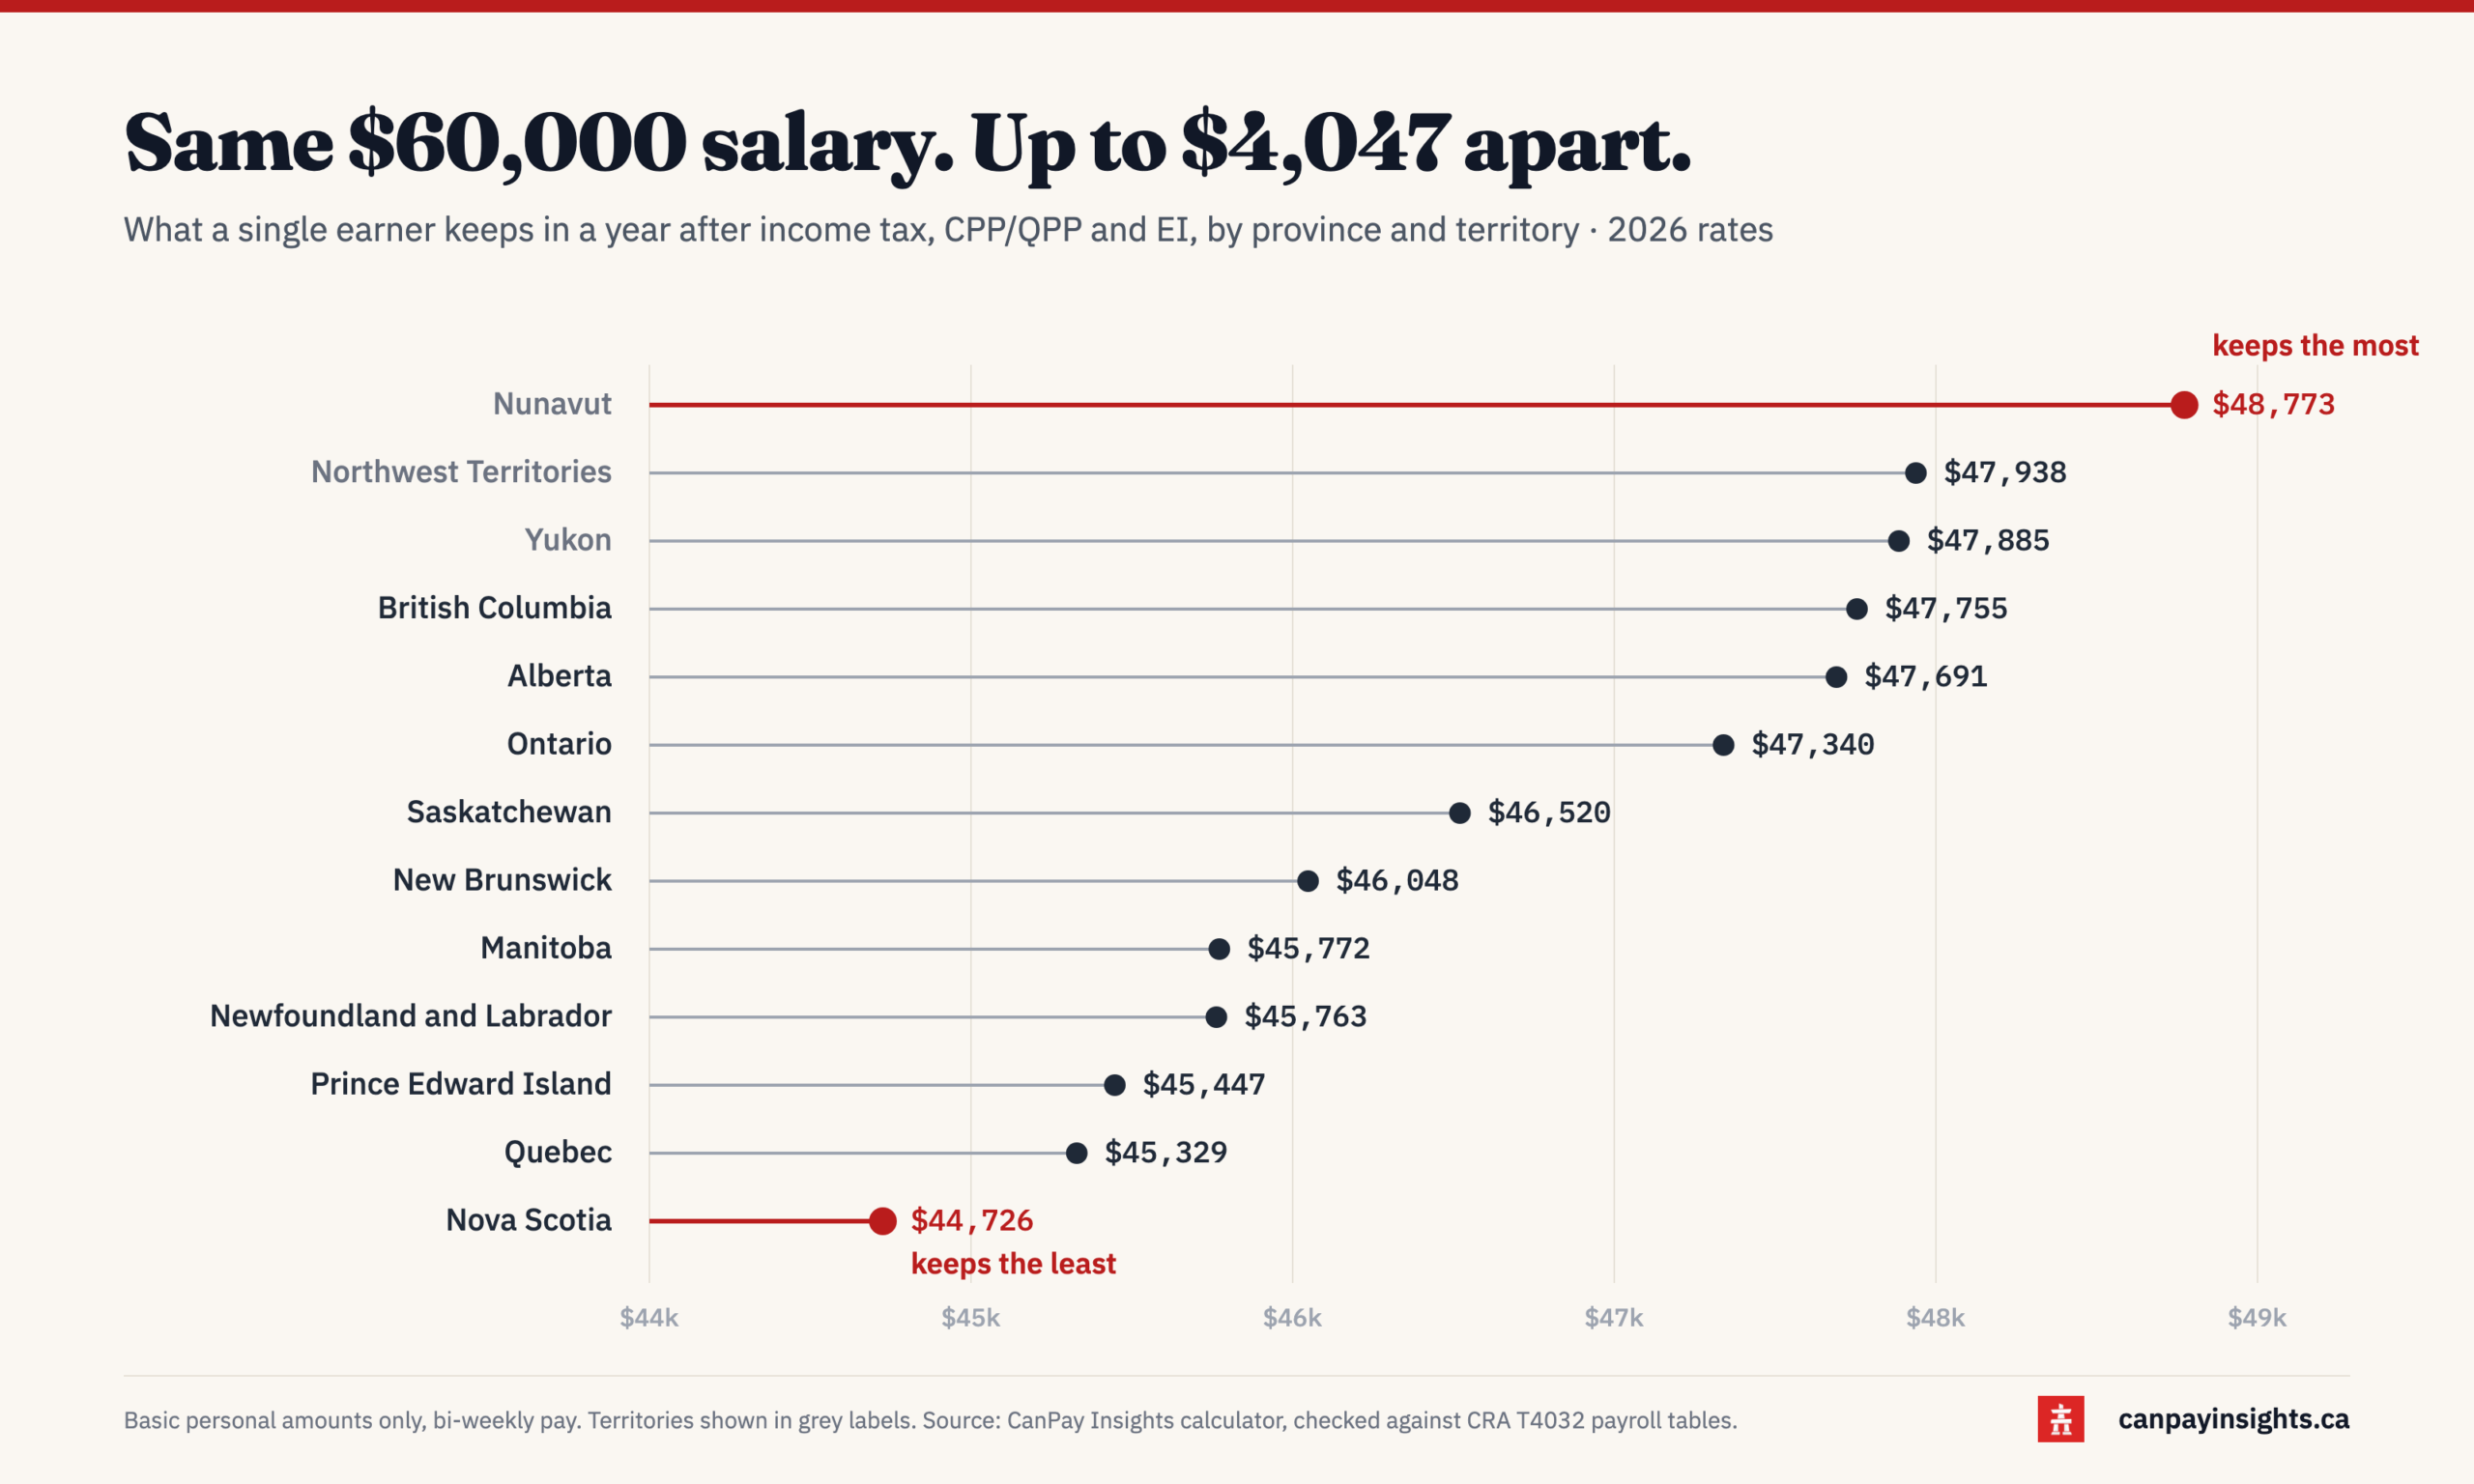
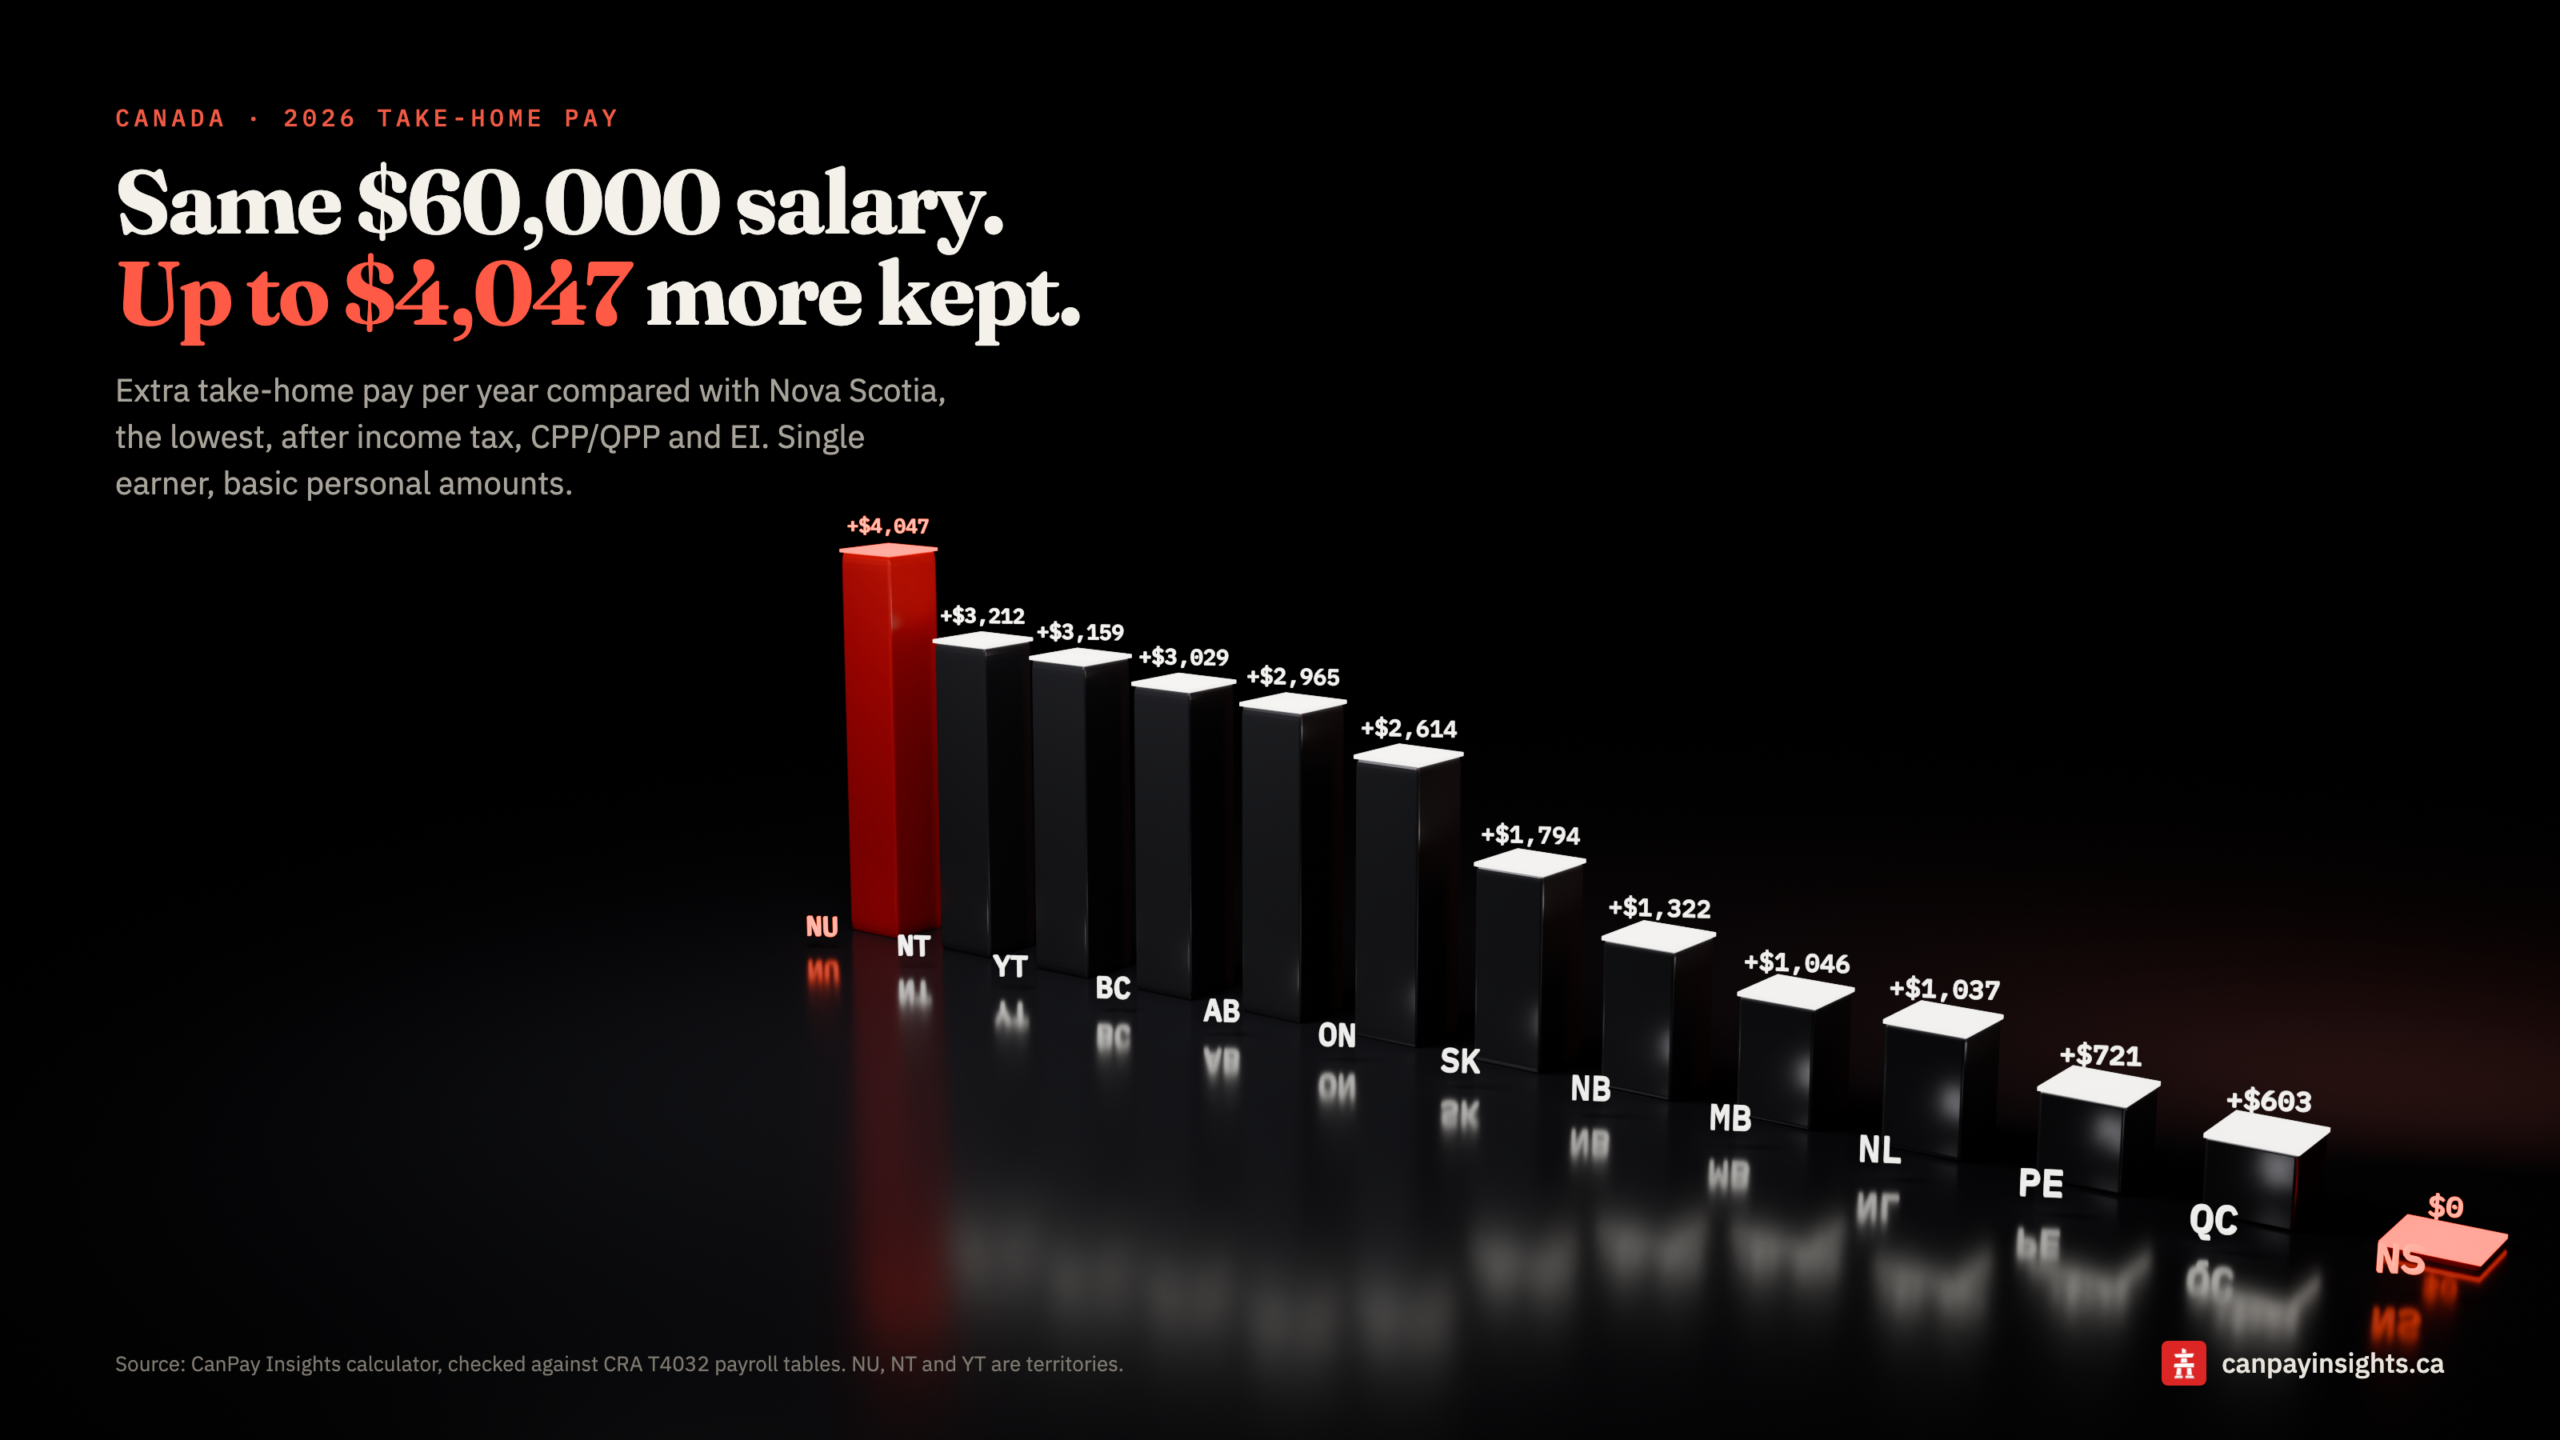
At $60,000, you keep $47,340 in Ontario, $47,691 in Alberta and $45,329 in Quebec. Taxes are only one
line in the moving-cost spreadsheet, but they belong there.
Before you scale back, check what you’d actually lose. Thinking about going part-time or easing into retirement? In Ontario, dropping from $85,000 to $60,000 cuts gross pay by $25,000 but take-home pay by only $16,339, from $63,679 to $47,340, because the dollars you give up were the most heavily taxed ones. That holds for someone with no other income; pensions, CPP or RRIF withdrawals change the math, so run your own numbers.
Let your RRSP do some of the heavy lifting. Contributions made through payroll reduce the tax taken off each cheque, so saving costs your take-home pay less than the amount that goes into the account. How much less depends on your marginal tax rate, which is a number worth looking up before you pick a contribution.
Know your real number, and the rest of the plan gets a lot more honest. The aggregated data behind this piece, refreshed monthly, is public at canpayinsights.ca/data.
 Travis Zhang is the founder of CanPay Insights (canpayinsights.ca), a
free Canadian take-home pay calculator checked against the CRA’s
payroll deduction tables.