By Justin Bender, CFA, CFP
Special to the Financial Independence Hub
Is it just me, or do investors have a knack for overcomplicating things?
Take the argument about active versus passive investing. We’ve known for more than 30 years that, after costs, the return on the average passively managed dollar must beat the return on the average actively managed dollar. Nobel laureate William Sharpe demonstrated this for us in his 1991 article, “The Arithmetic of Active Management,” and nothing has changed since then.
Despite that scary word, “arithmetic,” you don’t need to be a math major to accept Sharpe’s conclusions and invest accordingly. Still, you may want to see for yourself what he’s talking about. In the first episode of our Index and Chill video/blog series, we’ll show you why active investors (as a group) are destined to underperform passive investors.
Dividing and Conquering the Canadian Stock Market
To demonstrate how Sharpe’s theory plays out in action, let’s illustrate his work using the Canadian stock market as our example. The Canadian stock market is made up of hundreds of companies, with a total value of around 3 trillion dollars. If we sort these 300 or so companies from largest to smallest based on the value of their shares available to regular investors, we find familiar names at the top of our list, including Shopify, Enbridge, and the Big Five banks.
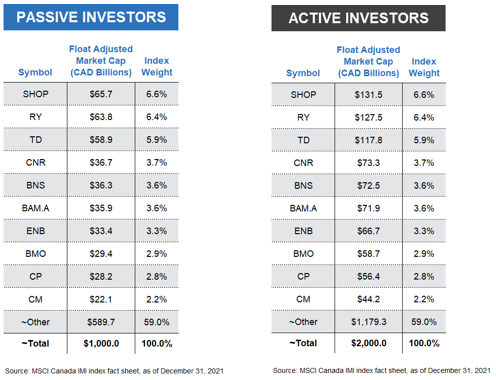
Dividing each company’s value by the total value of the Canadian stock market provides us with a percentage weight for each, otherwise known as its “index weight.” For example, at the end of 2021, Shopify had the largest index weight, at around 6.6%, followed by RBC and TD, which made up 6.4% and 5.9% of the Canadian stock market, respectively. These weights guide index fund managers on how much to allocate to each company in their funds.
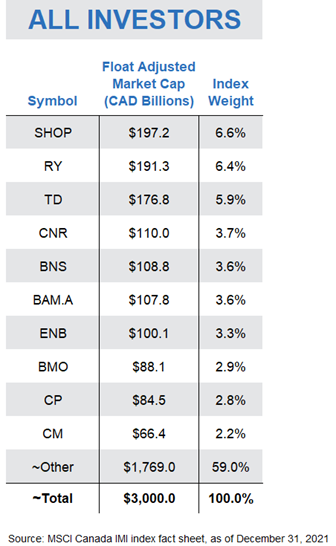 So, here’s where Sharpe’s work applies: At any point in time, investors as a group must hold all available shares of these companies. So, it stands to reason that, as a group, investors also collectively receive the total return of the Canadian stock market. In other words, if the Canadian stock market returns 10% this year, or around 300 billion dollars, everyone invested in the market will receive 300 billion dollars to divvy up amongst themselves.
Zero-Sum Games
Of course, some market participants will receive a higher return. But for each winner, there must be one or more losers.
This is the concept behind zero-sum game theory. The holdings of all investors in a particular market combine to form that market. So, if one investor’s dollars outperform the market over a particular period, another investor’s dollars must underperform, ensuring that the dollar-weighted return of all investors equals the return of the market.
Let’s use a super-simplified example to illustrate this point. Sticking with our $3 trillion-dollar Canadian stock market, let’s assume there are only two investors in the entire market. Investor 1’s portfolio is worth 1 trillion dollars and Investor 2’s portfolio is worth 2 trillion dollars. Combined, they are the Canadian stock market.
Of course, Investor 1 and Investor 2 wouldn’t be much fun if they didn’t have different opinions about which stocks were going to outperform over the next year. Based on their preferences, they trade with each other until they are both relatively happy with their portfolio.
Over the next year, let’s say the Canadian stock market returns 10%, providing a total dollar return of 300 billion to our two investors. But Investor 1’s stock picks end up returning 0%, while Investor 2’s portfolio earns an impressive 15%, or 300 billion dollars. Investor 2 was able to earn an additional 100 billion dollars by “winning” this amount from unlucky Investor 1. But again, as a group, there was no way the pair could earn more than 300 billion dollars. In a zero-sum game, the winner’s gain comes at the expense of the loser’s loss, with zero “extra” money floating around unaccounted for.
Setting the Stage: Active vs. Passive Participation
Now, let’s look at how this zero-sum game stuff applies to active versus passive investing.
To illustrate, we’ll return to our $3 trillion Canadian stock market, and each company’s weighting within the total market.
But instead of imagining Canada’s total market is divided between two active investors, let’s establish a slightly more realistic model. We’ll assume passive investors as a group hold one-third, or $1 trillion of all Canadian company shares, and active investors as a group hold the remaining two-thirds, or $2 trillion. We’ll once again assume the overall Canadian stock market returns 10% this year, but with one critical caveat. That 10% is before costs. As we know, extra investment costs can add up quickly from management fees, bid-ask spreads, commissions, and other tricks of the trade.
I want to also point out that the particular split between passive vs. active makes no difference to our exercise. Since these passive and active investors as a group are the total Canadian stock market, and since the passive group’s holdings have the same percentage weights as the overall market, the active group’s holdings must also have the exact same percentage weights. In other words, however you slice it up, the pie is the pie, with the same ratio of ingredients in the mix.
Passive Pursuits
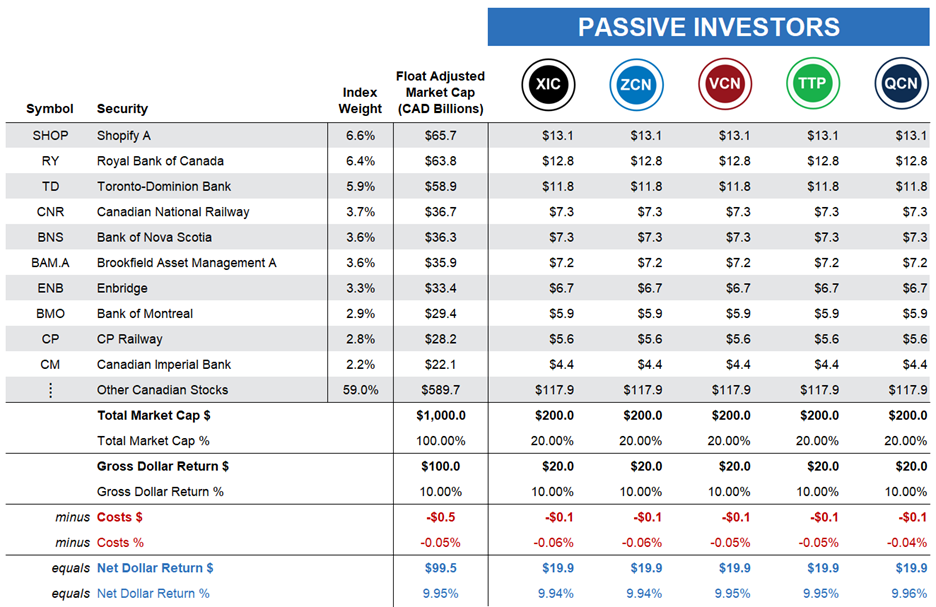
Let’s now look at how our passive investors would have fared with their $1 trillion market share. With these assumptions, if the market returned 10%, the passive investor group would be expected to earn $100 billion, before costs.
Now, suppose you are one of five passive investors in the Canadian market, with about $200 billion to invest — or one-fifth of the passive investors’ $1 trillion market share.
You don’t have a fancy business degree, and you’ve never even glanced at a company’s financial statements. You’d rather just buy and hold a low-cost index fund or ETF that tracks the broad Canadian stock market, so you invest your $200 billion in the iShares Core S&P/TSX Capped Composite Index ETF (XIC). XIC’s fund managers would use your money to purchase hundreds of Canadian stocks on your behalf, each according to its weight in the index. For example, they would purchase $12.8 billion of Royal Bank stock, or 6.4% of your $200 billion … and so on.
A year goes by, and in our illustration, you receive the stock market return of 10%, before costs. That’s $20 billion on your $200 billion investment. And because passive investing costs are low, your after-fee return will be around 9.94%, or just slightly less than the market return.
Your four fellow passive investors choose comparable broad-market Canadian equity ETFs that deliver similar after-cost returns. So, on average, the passive group earns around 9.95% after costs.
Active Adventures
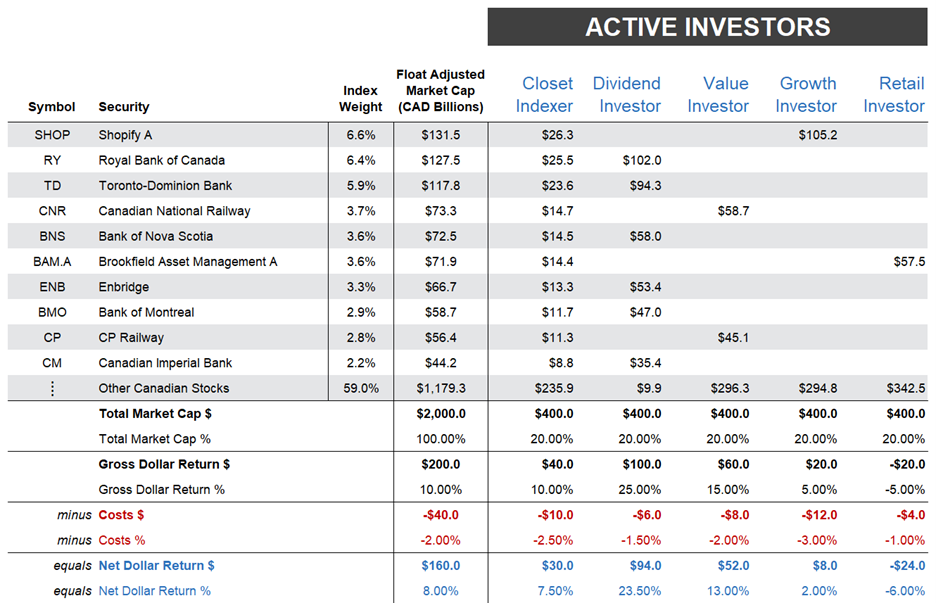
Next, let’s turn to our active investors, who continue to hope or believe they can beat the market, even after costs. We’ll again assume there are only five investors in our active management group, and they all have the same $400 billion each to invest.
However, unlike our passive camp, our active investors do not all share a similar approach to investing; each will pursue a different tactic.
Our first active investor selects a portfolio of funds recommended by their favorite banker who is a so-called “closet indexer.” This banker is afraid of losing their job if their recommendations stray too far from the popular benchmarks, so their preferred funds closely follow a passive approach … but with a catch. Their fund management fees are a hefty 2.5%. As a result, our closet indexer earns the market return of 10% before fees, but their net, after-cost return shrinks to 7.5%.
Our second active investor loves companies that pay high dividends, like those big banks and Enbridge. Their strategy ends up paying dividends, earning investors 25% before costs. Even after incurring a 1.5% management fee, they still end up handily beating the 10% market return, with a net return of 23.5%.
Our third and fourth investors are polar opposites. One is a value investor who likes to scoop up unloved railway stocks, and anything else they feel is trading at a discount to its true worth. The other is a growth investor who puts their money into hot sectors, like technology, and invests in companies like Shopify. Over the year, the value investor earns 15% before fees, and 13% after fees, beating the market by 3%. The growth investor earns a gross return of only 5%, and this return drops to only 2% after fees.
Finally, our retail investor is a wild card who likes to pick random stocks based on gut feel. Their stock picks lose 5% over the next year, and their excessive trading costs reduce their results by another percentage point, for a negative 6% net return.
The Market is (Still) the Market
So, where does that leave our active investors once the dust has settled?
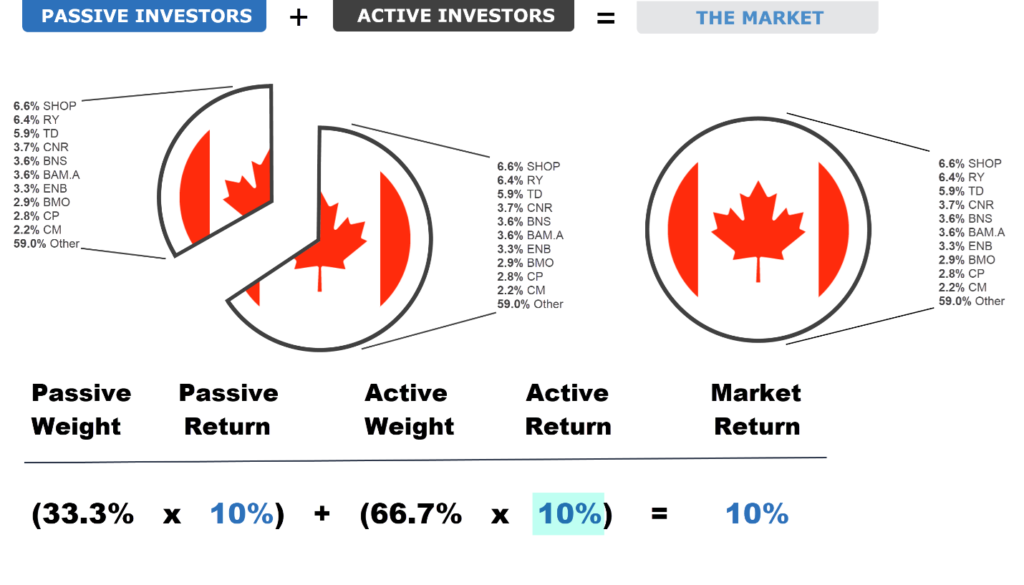
First, just as expected, the active group earned a 10% gross market return on average. Let me explain how that worked:
- By definition, our passive investors had to earn the market’s return before costs, since they all invested in the same percentage weightings as the entire market.
- If we add our passive group to our active investor camp, the two groups combined are the entire market.
- Therefore, as a group, the active investors also had to earn the market’s return before costs. It’s the only outcome possible.
Which brings us to our main conclusion: We now know that both passive and active groups earned 10% before costs, and that active investors as a group incurred about 2% more costs than their passive counterparts. This means the active group had to underperform the market return by their added costs, which lowered their average take as a group to 8%.
The Arithmetic of Active Management Strikes Again
In short, active investing is a zero-sum game before costs. But after costs, it turns into a negative-sum game.
Of course, as we just saw, that does not mean every active investor will underperform the market. Among the five active investors, there were winners and losers. The dividend investor and the value investor both happened to outperform the market after costs, while the closet indexer, growth investor, and retail investor all underperformed the market
Let’s circle back to William Sharpe, who noted in his landmark research:
“Properly measured, the average actively managed dollar must underperform the average passively managed dollar, net of costs. Empirical analyses that appear to refute this principle are guilty of improper measurement.”
But Sharpe also clarifies:
“It is perfectly possible for some active managers to beat their passive brethren, even after costs.”
This is an important point, which we have demonstrated today. Over any period, it’s highly likely there will be some winning active managers.
So now you know the theory behind why active investors (as a group) are destined to underperform passive investors. In our next blog/video combo, we’ll check out how many active managers have been underperforming their passive benchmarks in the real world.
 Justin Bender, CFA, CFP is a Portfolio Manager with PWL Capital in Toronto, where he helps clients reach their financial goals through disciplined, low-cost investing. With more than a decade of experience managing portfolios, Justin is focused on keeping costs and taxes low for his clients. His skills as an analyst and researcher have made him widely respected in the ETF industry.
After graduating from the University of Guelph, Justin spent two years with a large mutual fund company and quickly learned that the financial industry doesn’t always serve its clients well. He spent his lunch hours reading books by John Bogle (the legendary founder of Vanguard) and hoped to one day work with a firm that put investors first. He joined PWL in 2007 and obtained his Certified Financial Planner designation the following year. He earned the Chartered Financial Analyst designation in 2010. This post originally appeared on the Canadian Portfolio Manager blog and is republished on the Hub with permission.


