
 By Bilal Hasanjee, Senior Investment Strategist, Vanguard Canada
Special to the Financial Independence Hub
In the current record-breaking inflation and rising interest rate environment across all major markets, stocks and bonds have declined in values simultaneously.
As a result, many analysts and commentators have speculated on the death of the 60% stock/40% bond portfolios. But we have seen this before. Based on Vanguard’s research, balanced portfolios have proved critics wrong before and we believe they will prove them wrong, again. Here are five reasons why a 60% stock/40% bond portfolio is NOT dead.
Reason 1: Stock-bonds simultaneous decline is not long lasting
A simultaneous decline or positive correlation in stocks and bonds has typically not lasted long and the phenomenon has never occurred over a three-year span. A similar trend is visible on a 60/40 (stocks/bonds) portfolio.
Drawdowns in 60/40 portfolios have occurred more regularly than simultaneous declines in stocks and bonds; however, their frequency of occurrence also declines over longer periods. More regular occurrence is due to the far-higher volatility of stocks and their greater weight in that asset mix. One-month total returns were negative one-third of the time over the last 46 years. The one-year returns of such portfolios were negative about 14% of the time, or once every seven years or so, on average.
Figure 1
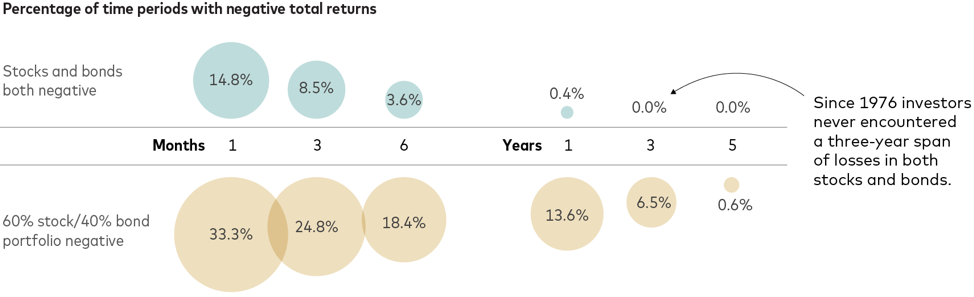
Source: Vanguard
Data reflect rolling period total returns for the periods shown and are based on underlying monthly total returns for the period from February 1976 through April 2022. The S&P 500 Index and the Bloomberg US Aggregate Bond Index were used as proxies for stocks and bonds.
Past performance is no guarantee of future returns. The performance of an index is not an exact representation of any particular investment, as you cannot invest directly in an index.
Stock-Bonds correlation remains negative in the long term
Our study of 60-day and 24-month stock-bonds rolling correlations from 1992 to 2022 suggests that over a long-term, correlation between stocks and bonds remains negative. That said, long-term inflation is one of the determinants of correlation between the two asset classes
Figure 2: Long-term correlations expected to remain negative
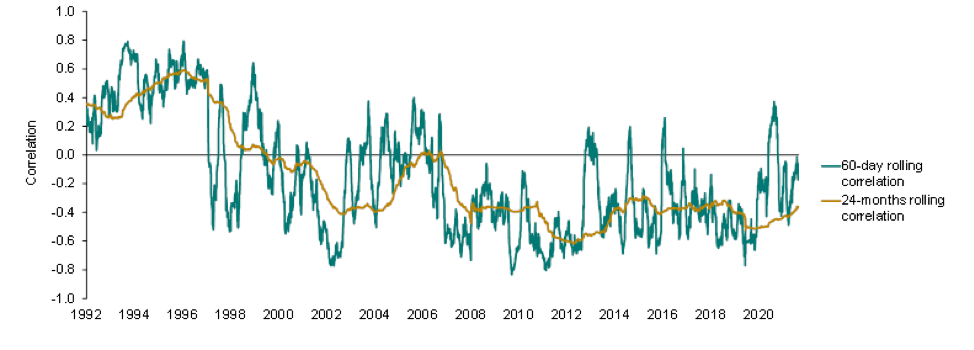
Notes: Rolling correlations are calculated on total returns of the S&P 500 Index and the S&P U.S. Treasury Bond Current 10-year Index, using daily return data for the period between 1989 and May 31, 2022.
Sources: Vanguard, using data from Refinitiv, as of May 31, 2022. Past performance is no guarantee of future returns.
The performance of an index is not an exact representation of any particular investment, as you cannot invest directly in an index.
Reason 2: Long-term expected returns from 60/40 are still achievable
The goal of a 60/40 portfolio is to achieve long-term annualized returns of roughly 7%. This is meant to be achieved over time and on average, and not every year. The annualized return of 60% U.S. stock and 40% U.S. bond portfolio from January 1, 1926, through December 31, 2021, was 8.8%.1 On a forward-looking basis, Vanguard Capital Markets Model (VCMM) projects the long-term average return to be around 7% for the 60/40 portfolio, over the next 10 years. Market volatility means diversified portfolio returns will always remain uneven, comprising periods of higher or lower: and, yes, even negative returns.
The average return we expect can still be achieved if periods of negative returns (like this year) follow periods of high returns. During the three previous years (2019–2021), a 60/40 portfolio delivered an annualized 14.3% return, so losses of up to –12% for all of 2022 would just bring the four-year annualized return to 7%, back in line with historical norms.
Our forecast points to improved stocks and bond returns
On the flip side, the math of average returns suggests that periods of negative returns must be followed by years with higher-than-average returns. Indeed, with the painful market adjustments year-to-date, the return outlook for the 60/40 portfolio has improved, not declined. Driven by lower equity valuations and higher bond yields, our 10-year annualized average return outlook for the 60/40 is now higher by 1.3 percentage points than before the recent market adjustment.
Reason 3: Selling bonds in a rising rate environment is like selling low and buying high (in short, don’t try to time the market)
Chasing performance and reacting to headlines are doomed to fail as a timing strategy every time, since it amounts to buying high and selling low. Far from abandoning balanced portfolios, investors should keep their investment programs on track, adding to them in a disciplined way over time.
Why market timing is not a good strategy
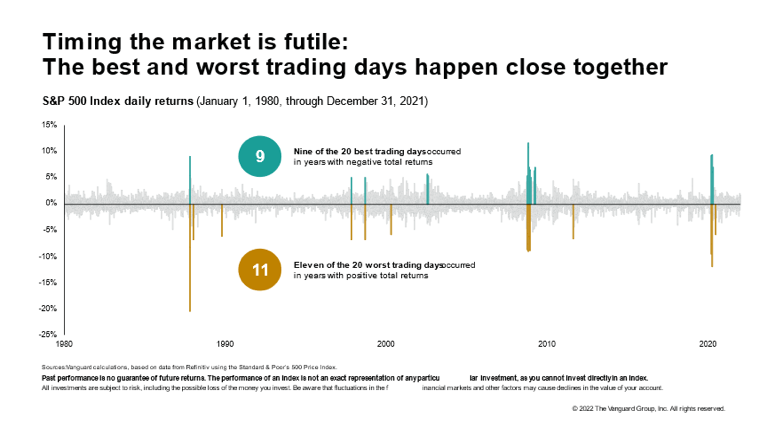
One reason investors shouldn’t try to time the market is they run the risk of missing out on strong performance, which can seriously hamper long-term investment success. Historically, the best and worst trading days have tended to cluster in brief time periods, often during periods of heightened market uncertainty and distress, making the prospect of successful market-timing improbable. Our research shows that the best and worst trading days often occur within days of each other. Nine of the 20 best trading days as measured by the S&P 500 Index from January 1, 1980, through December 31, 2021, occurred during years of negative total returns. Meanwhile, 11 of the 20 worst trading days occurred in years with positive total returns, another sign of the futility of market timing.
Figure 3: Timing the market is futile
Reason 4: Rising rates increase total returns of bonds
Returns on bonds comprise two components: price appreciation and coupons. In a rising interest rate scenario, negative returns generated by price declines can be more than offset by higher coupons if investors’ investment horizon is longer than their bond portfolio duration. For example, during the 27-month period between July 2016 and October 2018, U.S. Treasuries experienced a significant rise in yields across the curve. Using that period as the investment horizon, the yield of the 2-year Treasury note rose 226 basis points, and the yield of the 10-year Treasury note rose 165 basis points. The right-hand panel of the chart shows the same thing for the Bloomberg US Long Treasury Index. For its duration of 18.5 years, much longer than the period under review, higher annualized coupon payments of 2.61% were overwhelmed by the annualized market price decline of ‒8.16%, resulting in a deterioration of ‒5.27% in the index’s annualized total return.
Figure 4: The difference that duration made to total return in a rising rate environment
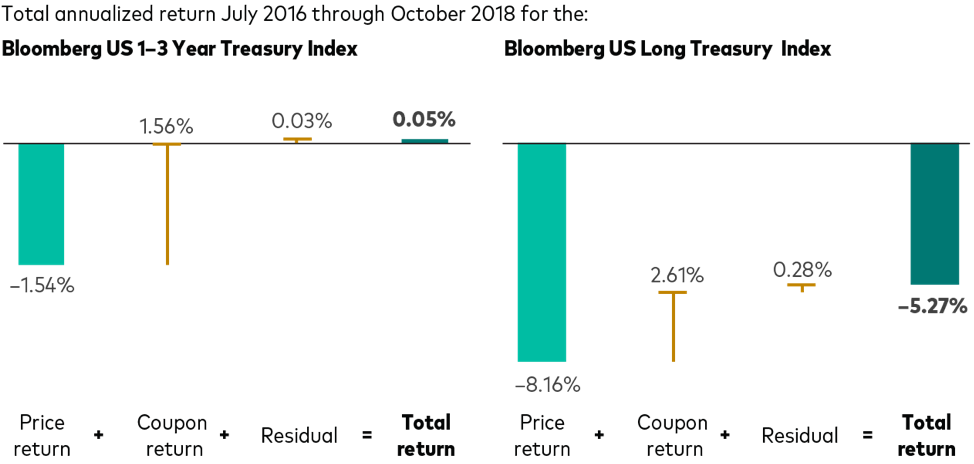
Notes: The residual change refers to the component of total return not explained by price or coupon return. This is commonly known as “roll return” and includes the effects of duration and convexity. Convexity is the sensitivity of duration (change in a bond’s price for a given change in interest rates) to a change in interest rates. It describes the tendency of bond prices to rise more than implied by duration for a given decrease in interest rates, and vice versa. Past performance is no guarantee of future returns. The performance of an index is not an exact representation of any particular investment, as you cannot invest directly in an index.
Sources: Bloomberg and Vanguard.
Reason 5: Bonds as a ballast: High-quality bonds reduce downside risk in a portfolio
High-quality bonds reduce the impact of a market downturn in a multi-asset portfolio. As you can see in Figure 9, during GFC 2008, a portfolio of high-quality bonds earned significant total returns versus low quality bonds and stocks. Thus, having a balanced portfolio of 60% stocks and 40% high-quality bonds helps create a ballast in the portfolio to withstand periods of heightened market volatility.
Figure 5: Cumulative % return during the global financial crisis (12 October 2007 to 9 March 2009)
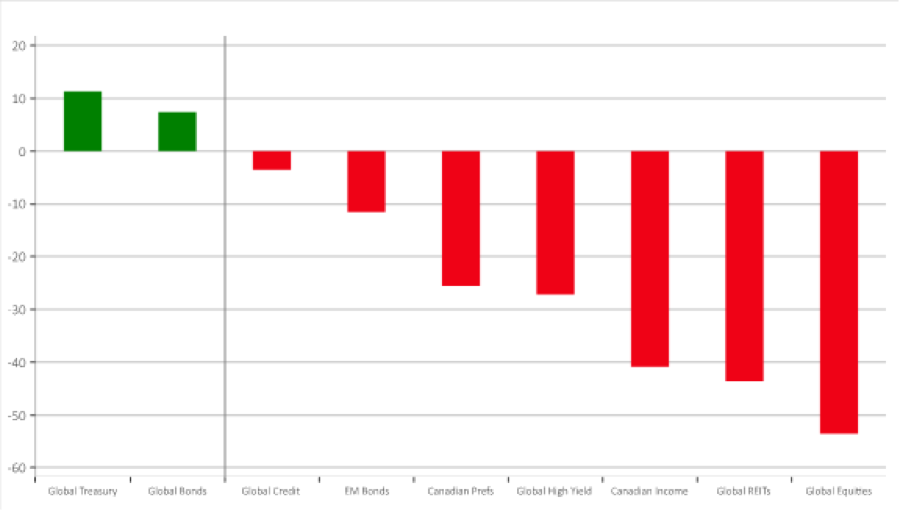
Source: Bloomberg, Macrobond and Vanguard Calculations
The history repeated itself during the Coronavirus scare in March 2020 (Figure 10)
Figure 6: Relative asset class performance during Coronavirus scare
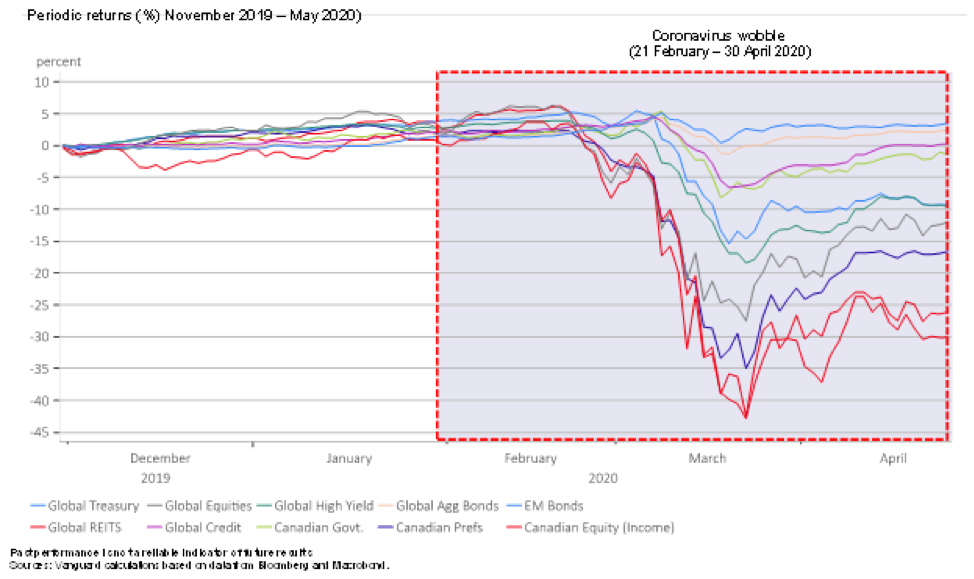
Source: Bloomberg, Macrobond and Vanguard Calculations
60/40 has been tested time and again … and has passed with flying colours
Stretches like the beginning of 2022 — and some bear markets that have lasted much longer — test investors’ patience and this requires persistence and a long-term perspective. And the balanced portfolio (for example, 60% stocks / 40% bonds) has faced difficult markets before and has rewarded investors with the discipline to stick with it.
Footnotes:

 1Source: Vanguard calculations using data from Standard & Poor’s, Dow Jones, MSCI, CRSP, Morningstar, and Bloomberg. U.S. stock returns are represented by the S&P 90 beginning in 1926; the S&P 500 Index from March 1957 through 1971; Dow Jones U.S. Total Stock Market Index (formerly known as the Dow Jones Wilshire 5000 Index) from January 1972 through April 22, 2005; MSCI US Broad Market Index through June 2, 2013; and CRSP US Total Market Index thereafter. U.S. bond returns are represented by the Dimson-Marsh-Staunton database from Morningstar, Inc., beginning in 1926; Bloomberg U.S. Aggregate Bond Index from January 1976 through December 31, 2009; and Bloomberg U.S. Aggregate Float Adjusted Index thereafter.

Bilal Hasanjee, CFA, MBA, MSc Finance, is a Senior Investment Strategist for Vanguard Canada.
