All posts by Financial Independence Hub

The all-weather portfolio. Ready for almost anything

By Dale Roberts

Special to the Findependence Hub

I recently posted a portfolio concept for the all-weather portfolio for 2022. The idea behind an all-weather portfolio is that it can prosper during periods of sun, rain, storms, hurricanes, earthquakes and tsunamis. Of course, in the above analogy weather serves as a proxy for the economic conditions that might arrive. The all-weather portfolio is ready for most anything.

On Seeking alpha I posted the all-weather portfolio for 2022. The portfolio is designed for U.S. investors, though Canadians can certainly mimic the approach or apply the greater concepts. The big idea of the all-weather portfolio is to hold assets in four buckets. It is an extension of the Permanent Portfolio.

There is a bucket of investment assets ready to thrive no matter what the weather offers (economic conditions). For example, for the last 40 years or so we’ve had favourable weather. Inflation has been low and economic growth has been modest, but positive. We’ve been in a disinflationary environment. Inflation has been low and mostly falling.

The weather has been nice

Stock markets and bond markets perform quite well during these disinflarionary periods.

To view some longer dated returns have a look at the RBC Select Balanced Fund. Of course, you could do better by way of an all-in-one asset allocation ETF.

Stocks have performed quite well over time. That said, investors needed to be armed with some very impressive umbrellas (and risk tolerance) to withstand the Great Financial Crisis (2008-2009) and the dot-com crash of the early 2000’s. Stock markets declined in spectacular fashion in both of these events.

Given that we were still in the midst of a mostly disinflationary period, bonds did the trick in lowering the volatility of the typical balanced portfolio. Bonds will mostly go up when stocks go down, offering that useful inverse relationship. We can think of bonds as portfolio shock absorbers.

These two major stock market corrections came and went, and we returned to our mostly fair-weather disinflationary times. Modest economic growth returned as well.

And now for something completely different

Yes, the above subhead is referencing a catch phrase made famous by Monty Python’s Flying Circus.

Monty Python’s Flying Circus

The comedy troupe was certainly different. And so is today’s economic environment. We have inflation, real inflation. It might even turn into stagflation when most everything fails for the investor. Stagflation is a period of persistent inflation that is accompanied by economic decline. The worst of all worlds you might say. Some nasty weather.

What works during stagflation or unexpected inflation (persistent inflation above those central bank 2-3% targets)? It’s not stock markets; it’s certainly not bonds. Oooops. That’s the traditional balanced portfolio. Continue Reading…

Rethinking the 4% Safe Withdrawal Rate


By Fritz Gilbert, TheRetirementManifesto

Special to the Financial Independence Hub

The 4% safe withdrawal rule is a well-known “rule of thumb” for those planning for retirement.

One thing it has going for it is that it’s simple to apply.

If you have $1 Million, the 4% safe withdrawal rule says you can spend $40,000 (4% of $1M) in year one of retirement, increase your spending by the rate of inflation each year, and you’ll never run out of money.

Simple, indeed.

But, I’d argue that simplicity comes at a potentially very serious cost.  Like, potentially running out of money in retirement.

Today, I’ll present my argument against the 4% safe withdrawal rule given our current economic situation, and propose 3 modifications I’d recommend as you determine how much you can safely spend in retirement.

Rethinking the 4% Safe Withdrawal Rule

I read a lot of information on retirement planning, and lately, I’ve been seeing more content challenging the 4% safe withdrawal rule.  I agree with those concerns and felt a post outlining my position was warranted.

As a brief background, the 4% Safe Withdrawal Rule is based on the “Trinity Study,” which appeared in this original article by William Bergen in the February 1998 issue of the Journal of the American Association of Individual Investors.  For further background, here’s an article that Wade Pfau published on the study.  I’ll save you the details, you can study them for yourself at the links provided.

The conclusion, based on the study, is summarized below:

“Assuming a minimum requirement of 30 years of
portfolio longevity, a first-year withdrawal of 4 percent,
followed by inflation-adjusted withdrawals in
subsequent years, should be safe.”


My Concerns With The 4% Safe Withdrawal Rule

In short, some key factors about the study are relevant, especially as we “Rethink The 4% Safe Withdrawal Rule”

  • It’s based on historical market performance from 1926 – 1992.  

My Concern:  Relying on past performance to predict future returns can mislead the investor, especially given the unique valuations in today’s markets (more on that below).  This point is driven home by this recent Vanguard article that projects future returns based on current market valuations:

4% safe withdrawal rule assumptions

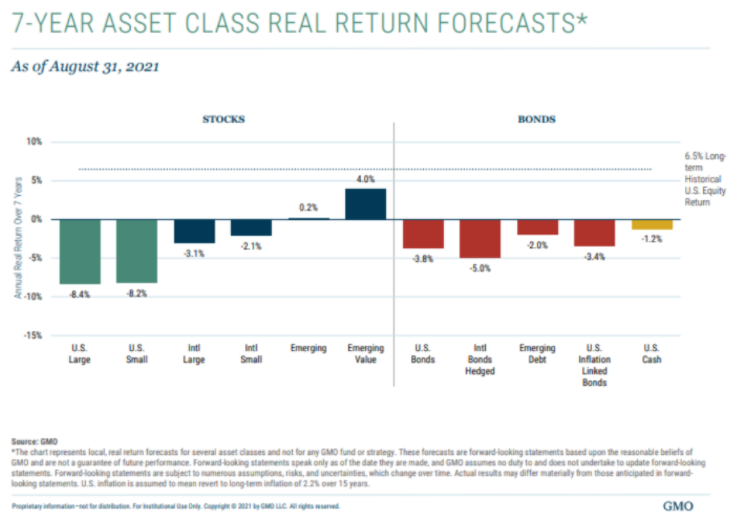
If you think the Vanguard outlook is depressing, check out this forecast from GMO as presented in this Wealth of Common Sense article titled “The Worst Stock and Bond Returns Ever”:

stock and bond forecast

  • Note the VG forecast is nominal (before inflation) whereas the GMO is real (after inflation).

Why Are Future Returns Expected to Be Below Average?

The biggest driver for the projected below-average returns is the high valuation in today’s equity market (particularly in the USA), and the fact that interest rate increases would negatively impact bond yield.  In my view the CAPE Ratio is one of the best indicators of market valuations.  Below is the current CAPE ratio as I write this post on November 16, 2021:

CAPE Ratio

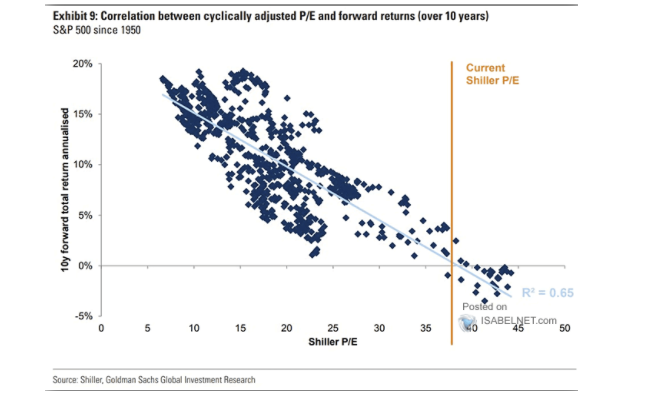
The reason current valuations matter is the fact that they’re highly correlated to future returns, as indicated from this concerning chart that I saw last weekend on cupthecrapinvesting:

CAPE ratio correlation to future returns

Based on today’s CAPE ratio, the historical correlation suggests the forward total returns over the next 10 years could be close to 0%.  Scary stuff for someone who’s planning on equity growth to pay for their retirement expenses.  Scary stuff for someone who’s committed to the 4% safe withdrawal rule.


In addition to the bearish outlook for US equities, bonds could be negatively impacted if when interest rates increase.  To get a sense of how low the US 10-year Treasury yields are now compared to long-term averages, below is the current chart of 10-year yields from CNBC:

4% safe withdrawal rate rule - bond impact

Bond prices are inversely related to interest rates, so as rates go up, bond prices go down.  So, if you’re holding 60% stocks and 40% bonds, it’s possible that you could see decreases in both asset classes.

As cited in this Marketwatch article, The Fed has begun signaling that interest rates are “on the table” for 2022, especially if the current bout of inflation proves to be less than a transitory event (for the record, I suspect it will be more than transitory, but what do I know?).

This brings us to the next concern …


My Other Big Concern With The 4% Safe Withdrawal Rule:

In addition to my concern above (the risk of an extended period of below-average market returns), I don’t like the part of the rule which states you should “increase your spending the following year based on the rate of inflation.”  As most of you know, inflation has been on a bit of a tear lately, as demonstrated in this chart from usinflationcalculator.com:

Based on the 4% Safe Withdrawal Rule, you would be increasing spending next year based on the higher inflation rate, which could well be the same time you’re seeing lower than expected returns.

I don’t know about you, but that doesn’t sit well with me.


Suggested Modifications to the 4% Safe Withdrawal Rule

It wouldn’t be fair to cite my concerns with the 4% Safe Withdrawal Rule without suggesting an alternative. Following are the 3 modifications I’d suggest for your consideration.  I’m applying all 3 of these modifications in our personal retirement strategy. Continue Reading…

The Rear-View Mirror and U.S. stocks: A Contrarian Indicator

By Noah Solomon

Special to the Financial Independence Hub

As we have written before, sentiment and emotions can have an outsized influence on investor psychology and investment decisions. Relatedly, there is a powerful inclination among investors to perceive markets that have outperformed as being less risky than those that have underperformed.

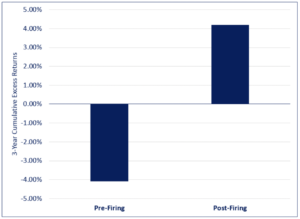
Interestingly, this tendency exists not just among individual investors, but is also prevalent in the professional investment community. A 2008 study by finance Professors Amit Goyal and Sunil Wahal explored the performance of investment managers who had been fired by institutional investors. The analysis compared the managers’ performance in the three years before being fired with their subsequent three-year performance.  The results of the study are summarized in the following graph.

The Selection and Termination of Investment Management Firms by Plan Sponsors

On average, fired managers had poor performance in the three years preceding their termination, with average annual underperformance of 4.1% vs. their benchmarks. This figure should come as no surprise, as you wouldn’t expect that they were fired for knocking the lights out! However, what may be counter-intuitive to many is that these managers tended to subsequently outperform, with average annual outperformance of 4.2% over the three years following their termination.

Clearly, not only does looking in the rear-view mirror fail to prevent you from hitting something that is in front of you but may in fact cause it!

The other takeaway is that even seasoned, institutional investors can be swayed by short-term performance, which in turn can lead to decisions which are both ill-timed and economically perverse.

Beware the Mean Reversion Boogeyman

Last year saw a continuation of a long-established trend of U.S. stock outperformance, with the S&P 500 rising 28.7% as compared to 8.3% for the MSCI All Country World Index (ACWI) Ex-U.S.  From the end of 2008 through the end of last year, the S&P 500 rose at an annualized rate of 16.0%, producing a cumulative return of 587.3%. In comparison, the ACWI Ex-U.S. Index rose at an annual rate of 8.6% and delivered a cumulative return of 190.7%.

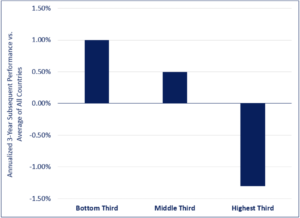
The outperformance of U.S. stocks argues for actively reducing U.S. exposure and increasing allocations to other regions, as the mean-reverting, contrarian nature of investment manager performance can also be applied at the country level. The following chart covers the period from 1970-2021 and includes the U.S., U.K., Germany, France, Australia, Japan, Hong Kong, and Canada. Specifically, it illustrates the results of investing every three years in a portfolio of country indexes based on their trailing returns over the previous three years.

3-Year Performance of Countries ranked by Trailing 3-Year Performance

The chart brings fresh perspective to the standard regulatory disclosure language in the marketing materials of investment funds, which states that “Past performance is no guarantee of future returns.”

Outperforming countries tend to become subsequent underperformers : those that have had superior returns over the past three years tend to produce relatively poor results over the next three years. Conversely, underperformers tend to subsequently outperform: those that have lagged over the past three years tend to outperform over the next three years. Continue Reading…