All posts by Financial Independence Hub

Bond ETFs vs. GIC Ladders

By Justin Bender, CFA, CFP

Special to the Financial Independence Hub


If there were ever a contest held for “Canada’s Most Boring Investment Ever,” I’ll bet that bond ETFs and guaranteed investment certificates (or GICs) would duke it out in the final round. We buy one or the other, or maybe some of both, to offset our more glamorous (and more risky) stock funds with some sensible dependability. Then, thankless crowd that we are, we cringe at their related paltry returns.

So in the boring battle between them, which should you use? Laugh at the humble GIC if you must, but GICs may just help save the day in today’s fixed income markets.

Consider this. Between January 1st and April 30th, 2022, the 10-year Government of Canada benchmark bond yield has more than doubled, rising from 1.4% to 2.9%. As yields increased, bond prices dropped, causing Canadian broad-market bond ETFs to suffer double-digit losses so far this year, losing over 10% of their value.

Now, seasoned investors may be used to the gut-wrenching double-digit drops we periodically see in the stock markets, but some of you haven’t had to stomach seeing your supposedly “safe” bond ETF holdings show up in bright red when you login to your online accounts. If fixed income is going to be so boring, the least it can do is keep its head above water.

I don’t typically recommend switching up your holdings every time a market disappoints. But if your bond funds are giving you serious heartburn, GICs may be worth a second look.

Let’s start off by talking about returns. Many GICs have yields that rival those of your favourite bond ETFs, but with a much lower average maturity. In fact, a 1–5 year GIC ladder currently boasts an average yield of 3.6%, with an average maturity of just 3 years. It’s called a “ladder” because you typically spread your GIC purchases evenly across 1-to-5-year maturities. This eliminates the need to predict future interest rate movements. So, if you have $100,000 to invest in GICs, you buy a $20,000 1-year GIC, a $20,000 2-year GIC, and so on, until you’ve built each “rung” in your 1-5 year ladder. As each GIC matures, you continue the ladder by reinvesting the proceeds into another GIC maturing in 5 years.


With a bond ETF, the best estimate we have of its future return is its weighted average yield-to-maturity. These days, in spring 2022, the yield-to-maturity on a broad-market Canadian bond ETF is about 3.4% after costs. And at 10.3 years, the weighted average maturity of the underlying bonds is significantly higher than a GIC ladder, exposing your investment to more interest rate risk.


With the GIC ladder, you can currently expect similar returns with far less term risk than what you’ll find in a bond ETF. In fact, since the end of 2011, a ladder of GICs has actually outperformed a broad-market Canadian bond ETF, with a much smoother ride along the way. It’s interesting to note that both options had the same 2.3% yield at the beginning of this measurement period.

Looking forward, there’s no guarantee that a ladder of GICs will always outperform a bond ETF over your specific investment timeframe, but there are still additional advantages of the strategy worth noting.

Advantages of GIC Ladders

GICs have shorter maturities. As mentioned earlier, the average maturity is 3 years for a typical 1–5 year GIC ladder (with an equal investment in each of the ladder’s “rungs” or years). In comparison, the average maturity is 10 years for a broad-market Canadian bond ETF, like the BMO Aggregate Bond Index ETF (ZAG). This makes the bond ETF more vulnerable to interest rate increases than a GIC ladder. If you’re concerned with the potential of further interest rate hikes down the road, a ladder of GICs may be more appropriate for your risk appetite. Keep in mind that if bond yields decrease from their current levels, bond ETFs could recover some of their losses (while your GIC ladder won’t experience the same price pop). Continue Reading…

Inflation: What is Normal?

Outcome Metric Asset Management public domain CC0

By Noah Solomon

Special to the Financial Independence Hub

Just as beauty is in the eye of the beholder, what one considers normal depends on their perspective. One of the single largest contributors to booms and busts is the tendency of investors to suffer periodic bouts of long-term memory loss. During such episodes, people view recent market dynamics as being normal, regardless of whether such behavior is an aberration from a long-term historical perspective.

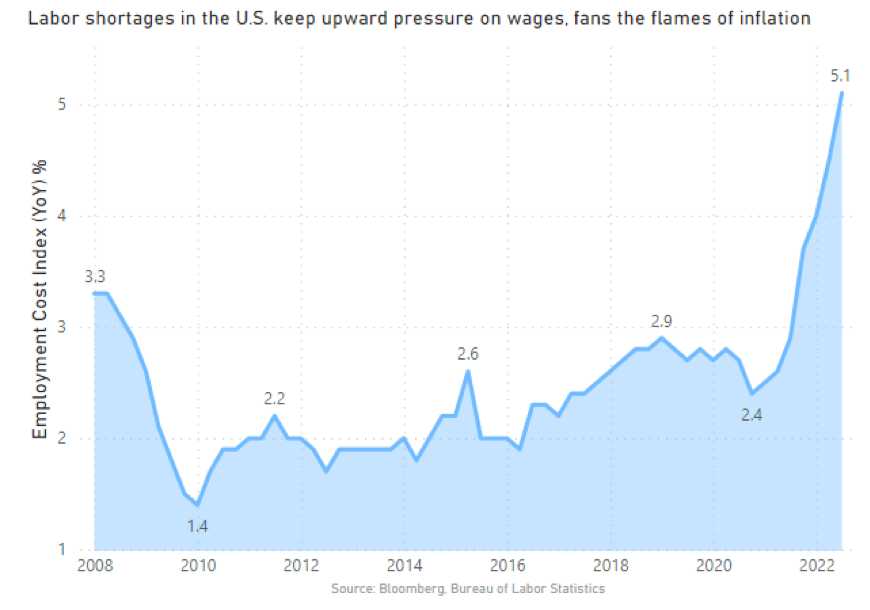
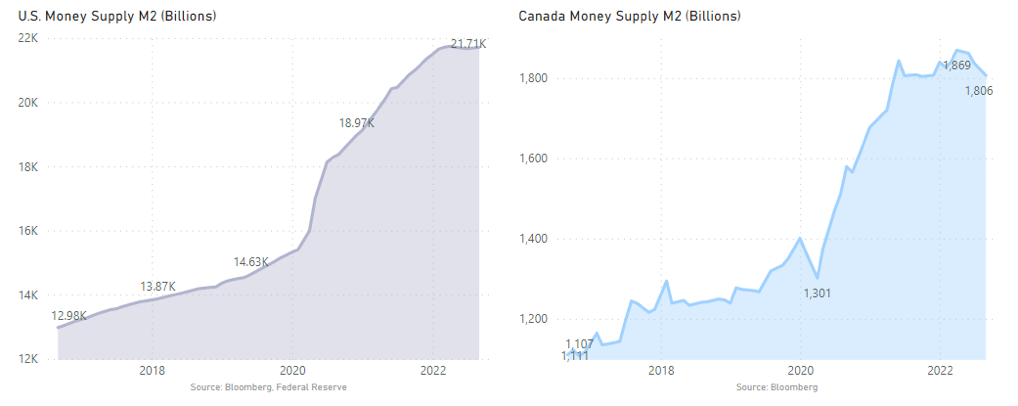
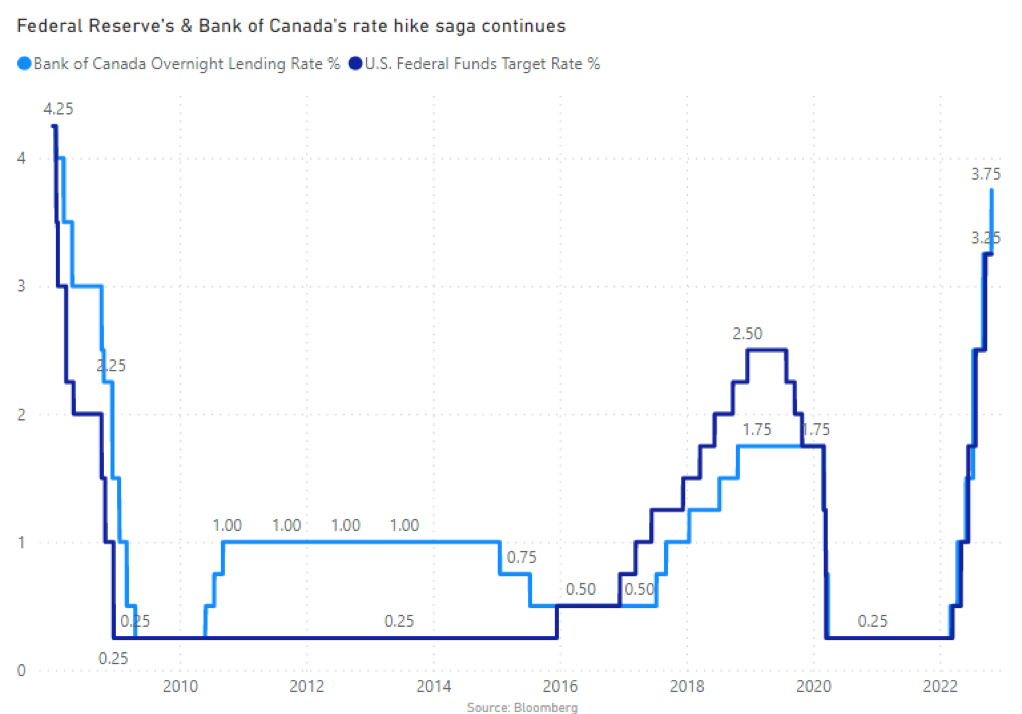
We cannot understate the degree to which the economic and investment climate that has prevailed since the global financial crisis of 2008 has deviated from its long-term historical norm. It is challenging to identify any other time in history when financial markets have been as influenced by ultra-low interest rates and vast amounts of fiscal stimulus.

Given the unprecedentedly powerful “wind” of governments and central banks at their back, it is no surprise that the best strategies for investors have been:
• Buy almost anything – stocks, bonds, real estate, cryptocurrencies, art, etc. (take your pick, it’s all good!).
• Buy even more during dips, which consistently proved to be good buying opportunities.
• Use maximum leverage to turbocharge buying power and returns.
It is fair to say that there by the grace of the authorities have gone corporate profits, asset prices, and investor portfolios!

The Phillips Curve has been sleeping, but it’s not Dead

The Phillips curve is an economic concept developed by A. W. Phillips, which describes the relationship between inflation and unemployment. The theory holds that there is an inverse tradeoff between the two variables. All else being equal, lower unemployment leads to higher inflation, while higher unemployment is associated with lower inflation.

Phillip’s theory proved largely resilient for most of the postwar era. Until recently, the one notable exception occurred in the early 1970s, when OPEC issued an embargo against Western countries, resulting in stagflation (both high inflation and high unemployment).

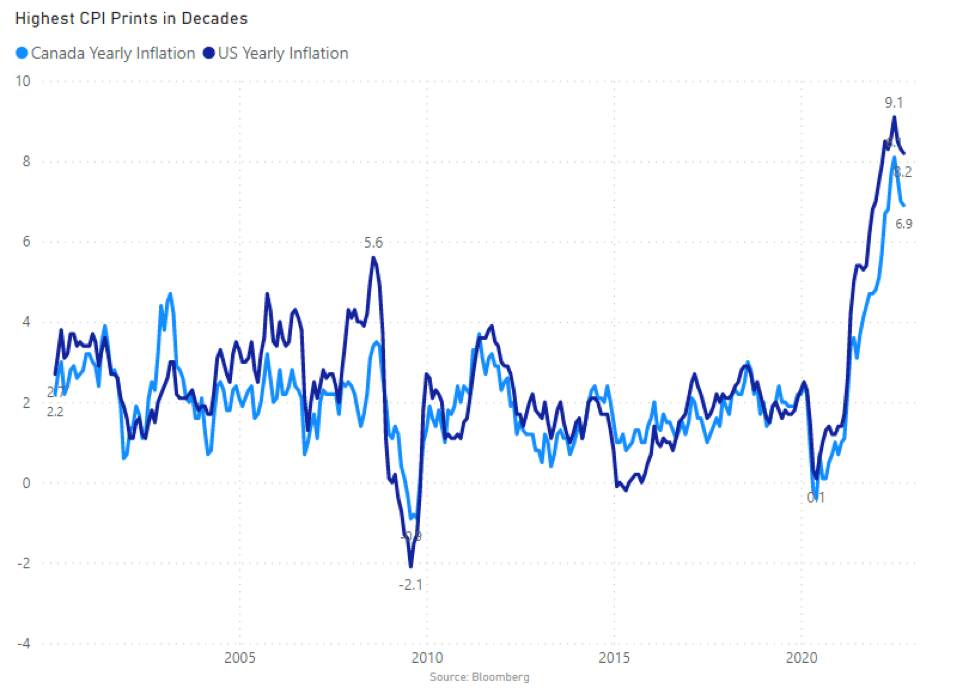
The second aberration covers the time between the global financial crisis of 2008 and mid-2021. Until rearing its head several months ago, the inflation genie has been dormant. It has calmly remained in its bottle in the face of monetary and fiscal conditions that in times past would have caused it to bust out full of fire and brimstone!

The combination of low unemployment and tame inflation provided a goldilocks backdrop for corporate profits and asset prices. But, to steal the tagline from Jaws 2, “Just when you thought it was safe to go back in the water,” inflation has returned, prompting central banks to slam on the brakes. This has changed the landscape in ways that have and likely will continue to have far reaching implications for investors’ portfolios.

The Kazillion Dollar Question

The laws of supply and demand can vary in terms of timing, but they cannot be eradicated. You can either eat your entire cake all at once or piece by piece over time. You can’t do both. The free money, one-way asset prices, all-you-can-eat risk party that has been raging since the global financial crisis of 2008 has given way to today’s hangover of rising inflation, higher interest rates, falling stock prices, and risk-aversion.

The kazillion dollar question is whether the current market malaise is merely a garden variety hangover involving Advil (i.e., a mild and short-lived bear market), or a case of alcohol poisoning that will entail a trip to the emergency room (a severe and long-lasting bear market).

Japan’s Addiction

Without a doubt, there are vast structural, economic, demographic, and political differences between Western economies and that of Japan. Nonetheless, the Japanese experience serves as a small “w” warning of the potential consequences when extreme levels of monetary stimulus are applied for an extended period. Continue Reading…

Why I Don’t Invest In …

By Bob Lai at Tawcan

Special to the Findependence Hub

We are hybrid investors – we invest in individual dividend growth stocks and index ETFs. As of writing, we own 50-something dividend stocks and 1 ETF. We are doing a hybrid investing approach to capture the best of both investing strategies.

We invest in dividend paying stocks so we can collect stable and predictable income every month. It means we can live off dividends if we wanted to and not touch the principal. This, in theory, should give us more flexibility and increase the margin of safety when we are financially independent and not earning a steady paycheque every two weeks. Dividend income is also very tax efficient compared to employment income, especially if you construct your portfolio correctly, like holding REITs and income trusts inside of your TFSA and only Canadian stocks that pay eligible dividends in your non-registered accounts.

Index ETF investing provides asset and geographical diversification that we may not be able to obtain easily through holding individual dividend stocks. By holding an international ex-Canada ETF like XAW, we are able to easily tap into international markets like the US, Japan, China, UK, Taiwan, etc.

Some people may argue that capital gain is even more tax efficient than dividend income, but that’s a post for another day…

Ideally, I’d like our dividend stocks to index ETF allocation to be about 65/35 and we are slowly making our way to this ideal breakdown.

Continue Reading…

App-based banking: the ‘new normal’ for Canadians

By Vineet Malhotra

Special to the Financial Independence Hub

It has often been said that necessity is the mother of all invention, and if there’s anything the world has faced over the past few years, it was a lot of necessity. Whether it was how we exercised or worked from home, the pandemic forced the world to reimagine old habits and reconsider our ways of doing, well, everything.

Banking was not exempt from this re-evaluation, as evidenced by a recent survey by the Canadian Banking Association (CBA) which found that 65% of Canadians used app-based banking in the past year, up from 56% in 2018, and 44% in 2016. These numbers represent a massive shift in less than five years.

With limited banking options throughout the pandemic, consumers further embraced online and app-based bank platforms: not only did they experience the benefits, but they were also forced to redefine what services they thought were possible through an app. It was delivering the unexpected and hearing our clients say, ‘I didn’t know I could do that online!’ that helped push and motivate our team at Simplii Financial to offer more.

Through the pandemic, consumers saw firsthand just how much banking technology has evolved and experienced how easy it was to do things online like sending money abroad with Simplii’s Global Money Transfer or applying for a mortgage. They quickly came to realize that online banking was not just for simple money transfers, or deposits, but rather for more sophisticated financial transactions as well, all right at their fingertips.

Why the surge in app-based banking specifically?

The two main reasons for the rise in app-based banking come down to convenience and time.  The desire and the need for convenience have taken over our lives: more than ever we expect we can do things from wherever we are, whenever we want.  Whether it’s depositing a cheque, transferring money, or making bill payments, many Canadians now understand that an app makes all those tasks easier and faster. Even more complex services are starting to move into the digital space – like mortgage applications which can now be completed digitally, or by phone.

Who is driving the surge of app-based banking?

App-based banking now comes second only to digital banking in use and we expect it to grow. According to the CBA, the surge is largely due to Gen Z and Millennials. Nearly half of Gen Z (46 percent) and well over one-in-three Millennials (37 percent) are using app-based banking as their primary banking method. Continue Reading…

How to avoid the 7 Biggest Mistakes that Entrepreneurs Make

Powered by the Financial Independence Hub.
© 2013-2026 All Rights Reserved.
Financial Independence Hub Logo

Sign up for our Daily Digest E-Mail!

Get daily updates from the FindependenceHub.com straight to your inbox.