All posts by Financial Independence Hub

Is typical retirement advice good? – Testing popular Retirement rules of thumb

Special to the Financial Independence Hub 

You want to retire soon. How should you set up your retirement income?

You talk with some friends, read about it on the internet, and talk with a financial advisor. Are you actually getting good advice?

When it comes to retirement income, most financial advisors rely on a few rules of thumb handed down from one generation of advisors to the next. The rules appear to be common sense and are usually accepted without question.

Do these rules of thumb actually work?

Before giving clients this advice, I tested them with 150 years’ history of stocks, bonds and inflation. I wanted to see if these rules were reliable for a typical 30-year retirement. (The average retirement age is 62. In 50% of couples that reach their 60s, one of them makes it to age 92.) 

These five rules are the “conventional wisdom” – the advice typically given to seniors:

  1. 4% Rule”: You can safely withdraw 4% of your investments and increase it by inflation for the rest of your life. For example, $40,000 per year from a $1 million portfolio.
  2. “Age Rule”: Your age is the percentage of bonds you should have. For example, at age 70, you should have 70% in bonds and 30% in stocks.
  3. “Sequence of returns”: Invest conservatively because you can’t afford to take a loss. You can run out of money because of the “sequence of returns.” You can’t recover from investment losses early in your retirement.
  4. Don’t touch your principal. Try to live off the interest.
  5. Cash buffer: Keep cash equal to 2 years’ income to draw on when your investments are down.

The results: NONE of these rules of thumb are reliable, based on history.

Let’s look at each to understand this.

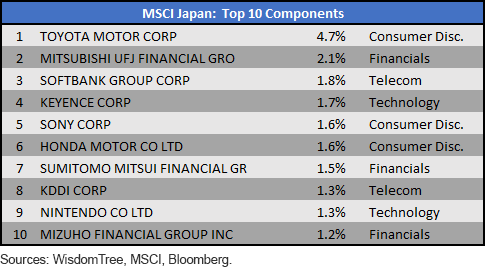
1.) “4% Rule”: Can you safely withdraw 4% of your investments plus inflation for the rest of your life?

Based on history, the “4% Rule” was safe for equity-focused investors, but not for most seniors.

In the results shown in the graphic at the top of this blog, the blue line is the “4% Rule,” showing how often in the last 150 years a 4% withdrawal plus inflation provided a reliable income for 30 years.

The “4% Rule” only works with at least 50% in stocks.

The “4% Rule” worked only if you invest with a minimum of 50% in stocks. Even safer is 70-100% in stocks. It is best to avoid a success rate below 95% or 97%. They mean a 1 in 20 or 1 in 30 chance of running out of money during your retirement.

Most seniors invest more conservatively than this and the 4% Rule failed miserably for them.

A “3% Rule” has been reliable in history, but means you only get $30,000 per year plus inflation from a $1 million portfolio, instead of $40,000 per year.

These results are counter-intuitive. The more you invest in stocks, the safer your retirement income would have been in history.

To understand this, it is important to understand that stocks are risky short-term, but reliable long-term. Bonds are reliable short-term, but risky long-term. Why? Bonds get killed by inflation or rising interest rates. If either happens during your retirement, you can easily run out of money with bonds.

The chart below illustrates this clearly. It shows the standard deviation (measure of risk) of stocks, bonds and cash over various time periods in the last 200 years. Note that stocks are much riskier short-term, but actually lower risk for periods of time longer than 20 years.

Stocks are more reliable after inflation than bonds after 20 years.

Ed’s advice: Replace the “4% Rule” with “2.5% +.2% for every 10% in stocks Rule.”  For example, with 10% in stocks, use a “2.7% Rule.” If you invest 70% or more in stocks, then the “4% Rule is safe.

2.) “Age Rule”: Your age is the percentage of bonds you should have. For example, at age 70, you should have 70% in bonds and 30% in stocks.

Continue Reading…

Affordable Housing: Which Toronto neighbourhoods are friendliest for Condo buyers?

By Penelope Graham, Zoocasa

Special to the Financial Independence Hub

There’s no denying Toronto real estate prices have tumbled since the Fair Housing Plan was introduced by the Ontario government last April, to address the searing 33-per-cent year-over-year price growth that alarmed buyers and policymakers alike. Detached house prices – the hardest hit segment following the Plan – have since declined 14.8 per cent, representing a dollar loss of $180,878, while the average aggregate home price is down 11.8 per cent, a loss of $108,696.

However, affordability continues to be a keenly-felt issue in the city, especially among what is supposed to be the affordable entry point for new home buyers: condos.

While the priciest home segments posted deep declines in the volatile months following the Plan, condos consistently posted year-over-year gains in value; now, just over a 15 months later, they’re sitting at an average of $561,097, an increase of 8.1 per cent.

FHP did little for first-time buyers

That means that, while those in the move-up markets have enjoyed improved buyer conditions, the most vulnerable and cash-strapped have faced only worsening affordability following the new policies. Rather than find an affordable entry-hold in the 416, first-timers are increasingly drawn to further-flung communities, such as homes for sale in London, Ontario, or even Ottawa real estate, where detached living can be had at the fraction of the cost for a city condo.

However, these are aggregate data, reflecting home prices collected from the entire region monitored by the Toronto Real Estate Board. As real estate is extremely local, and can differ from neighbourhood to neighbourhood, savvy condo buyers seeking a deal may still have options within the City of Toronto proper.

Toronto’s most affordable Condo communities

To identify where this is possible, Zoocasa crunched the affordability numbers per neighbourhood, factoring in the average price in each as well as the median income earned in Toronto households.

The findings revealed that, for households earning two or more incomes at the median of $96,294, 18 of the 35 examined markets remained within the realm of affordability.  They are:

Continue Reading…

The Case for Financial Assets over real estate

Billy kicking back on Mexico’s Pacific Coast

By Billy Kaderli

Special to the Financial Independence Hub

When I was a stock broker in California — one of the hottest housing markets in the US — real-estate was my competition. “Everyone” was making money in real-estate, so why would they invest in the stock market?

I needed an angle

I went to the Board of Realtors and got prices for 2-, 3- and 4-bedroom homes in the area, both at the current price and for 10 years prior. I did the math to calculate what annual return these houses were creating for that ten-year span, then compared that to the S&P 500 Index for the same time period.

The index clearly beat all three home styles without the hassles of ownership. Now I had my argument to help people invest in the market.

Ok, that was then and this is now

Using Zillow.com I looked up what the home we used to own was now worth. It was listed at US$862K. Again I did the math and found that over the last 31 years since we bought it, that house has appreciated 6.4% annually. Sounds OK, except that there were property taxes, maintenance and repairs that would need to be deducted lowering that annual return.

Then, I wondered, what if we had put the money to buy our home into the S&P 500? So I calculated that figure also.

Are you ready?

It would be worth 3 million (US) dollars today! Over three times the current value of the home, as the Index produced a 10.46% annual return during those 31 years. Continue Reading…

Why the “T” in TSX should stand for Tokyo

By Jeff Weniger, CFA, WisdomTree Investments

Special to the Financial Independence Hub


Canada’s stock market construction may be more than just a portfolio risk; it is arguably a systemic one.

If, for whatever reason, the Canadian financial system were to encounter serious difficulty, investors would be hit by a one-two punch. The attendant economic weakness would hang over the stock market, and it would be the very companies that dominate the stock market that would be battling demons. Canada’s top-heaviness, where more than $2 of every $5 in the MSCI Canada Index is in financial stocks, is not normal or reassuring for a developed economy.1 We should stop making like it is.

In fact, it would be better for the TSX if the “T” stood for Tokyo, at least on the sector diversification side of things, as we show below.

Stuck in the mud

Everywhere you turn, countries that are top heavy are doing something about it. Saudi Arabia, for example, sees the writing on the wall for fossil fuels; either the price mechanism may cause a phase-down in oil demand in the next quarter century, or environmental action groups will crush demand themselves. Either way, the ruling Crown Prince Mohammad bin Salman is keen to avoid state failure if a bleak future for oil comes to pass. That country will soon float an IPO of Aramco, the state-run oil behemoth that may be equal to several ExxonMobils. Proceeds will be diverted into tech, infrastructure—anything that isn’t oil.

China, too, realized it was turning into a one-trick pony. After building its export machine after Mao’s death, the time for middle-class demand eventually arrived. When it joined the WTO at the turn of the century, the country’s household consumption was 46% of GDP. It fell to 36% of GDP in 2007, but it has been rising ever since; sights are set on 40% this year.2

But not Canada. The hat is hung on the same two sectors, as always. Nine of this country’s top 10 corporations by market capitalization fit the bill (figure 1). This, in a country where the average investor has 86% of assets inside these borders.3

That is concentration on top of concentration.

Figure 1: Canada’s Sector Concentrations

Compare the “T” for Toronto with another T: Tokyo. Figure 2 shows Japan’s national champions. They don’t dominate allocations quite like Canada’s do.

Figure 2: Japan’s Largest Companies

Continue Reading…

Why and how Financial Independence is achievable

By Jade Anderson

Special to the Financial Independence Hub

Financial independence can mean different things to different people, but the widespread definition is to be financially secure and on the right track to a safe retirement.

Sometimes people will still need to work in order to maintain their financial independence (aka “Findependence”), but the main idea is that you are free from any debt or outside help from financial institutions. This may seem like something that is unachievable for anyone outside of retirement age, who isn’t well established; however, because of the different types of financial independence, it may not be so difficult after all. Adjusting your spending habits, creating a budget for your self and several other things can lead you towards Findependence, if you know the right things you need to consider.

Reduce unnecessary expenses

Setting up a budget for the long term is extremely important if you’re wanting to become financially independent. If you can cut down on any unnecessary expenses (such as extra food, clothing, and entertainment) in your weekly spending, then you’ll find it will be a lot easier to save. If you are not used to saving money, starting small is important because it will help you establish a pattern of saving properly, and it will be easier for you when you move up to saving more of your average income.

Plan your savings and spending

Planning not only your savings, but also your spending is crucial for ensuring your financial independence. If you have a few debts, and you can make plans to pay off certain amounts by certain dates, you’ll find that the overall debt is easier to pay off, than if you paid it off in a lump sum. Using one of the financial calculators like those on Brighter Finance can help you calculate your budget and repayment periods for your loans, so you can keep track of your money more easily.

Continue Reading…