By Sheldon Quan King, BMO Global Asset Management
(Sponsor Blog)
Diversification remains one of the most powerful portfolio construction tools available to investors—a principle first introduced by Harry Markowitz in the 1950s, who famously coined the phrase, “diversification is the only free lunch in investing.”1
At its core, diversification aims to maximize return for a given level of risk. This concept is the foundation behind BMO’s Asset Allocation ETFs, designed to provide investors with a globally diversified portfolio through a single, low-cost ETF. To deliver even greater value, BMO has recently reduced the management fee for some of its most popular Asset Allocation ETFs to just 0.15%.
The most important Decision
Asset allocation is widely recognized as the most critical determinant of long-term portfolio performance. The landmark research by Brinson, Hood, and Beebower (1986) revealed that 90% of return variability can be attributed to the mix of asset classes within a portfolio: not market timing or individual security selection.
For investors seeking a disciplined, strategic asset allocation[i] ETF to meet a growth objective, BMO All Equity ETF (Ticker: ZEQT) is a compelling choice. With an asset mix of 100% equities and 0% fixed income, ZEQT provides global equity exposure for long-term growth, while maintaining its target asset mix with built-in rebalancing.
Target Asset Allocations
 Source: BMO Global Asset Management, as of May 30, 2025
Rethinking Global Diversification
Many global funds today are heavily concentrated in U.S. equities: given that a global benchmark, the MSCI World Index, allocates approximately 70% to the U.S. ZEQT offers a more balanced global allocation, reducing reliance on U.S. markets to 47%. Notably, ZEQT includes a 28% allocation to Canadian equities, appealing to investors looking to “buy Canada” amid geopolitical concerns such as trade tensions or tariff threats.

BMO Global Asset Management, as of April 30, 2025. The asset allocation is subject to change without notice.
What’s inside: Key portfolio ingredients
The core building blocks of ZEQT are among the largest and most cost-effective ETFs in Canada. tracking well known indices like S&P and MSCI, to provide broad exposure to international markets:
- BMO MSCI EAFE Index ETF – Ticker: ZEA (0.20% mgmt. fee): Covers developed equity markets outside North America, including Europe and Japan.
- BMO MSCI Emerging Markets ETF – Ticker: ZEM (0.25% mgmt. fee): Adds growth potential from emerging market equities including India and Taiwan.BMO Global Asset Management, as of April 30, 2025. Investors only pay the mgmt fee at the ETF level of 0.15%, not the underlying ETF mgmt fees of 0.20 and 0.25%.
To enhance U.S. market cap diversification and achieve more potential growth, ZEQT includes:
These ETFs apply a profitability screen, targeting higher-quality mid- and small-cap companies in the U.S. ZEQT also spans all major sectors, helping reduce risk as different sectors rotate in and out of favour through economic cycles.
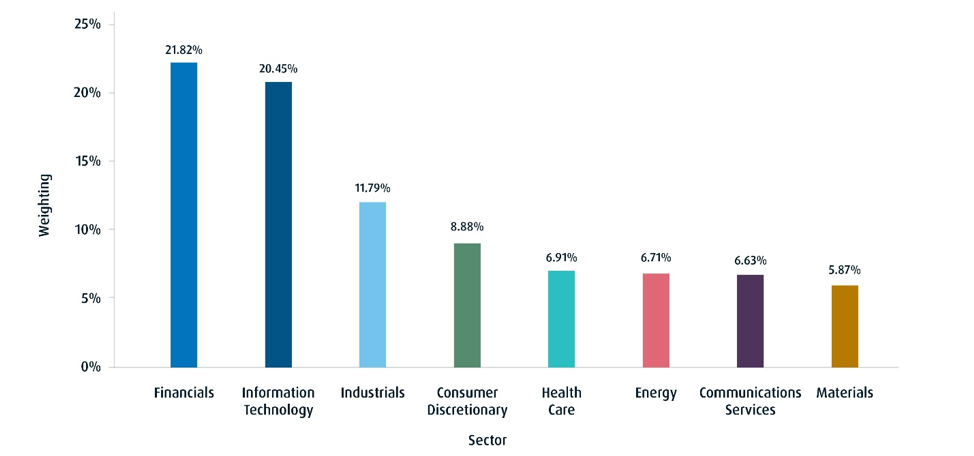
Source: BMO Global Asset Management. The sector allocations are subject to change without notice. ZEQT sector allocation, as of June 2, 2025.
Bottom Line
For advisors who focus on delivering holistic wealth management — integrating tax, insurance, and estate planning — ZEQT offers a simple, scalable core portfolio solution for their practice. It allows advisors to efficiently manage client assets without sacrificing diversification, transparency, or costs.
And for self-directed investors, ZEQT does all the heavy lifting. With global exposure, automatic rebalancing, and all-in-one simplicity, it truly represents a “set it and forget it” investment that is built for the long run.
Again, as of June 9, ZEQT alongside BMO’s three other most popular asset allocation ETFs, management fees have been cut by three basis points to 0.15%: amongst the lowest in Canada.

* Effective after market close on June 6, 2025.
Footnotes
1 UBS, Diversification is the logical solution to an unpredictable future. January 10, 2025
Performance (%)
| Fund |
Year-to-date |
1-month |
3-month |
6-month |
1-year |
3-year |
5-year |
10-year |
Since inception |
| ZEQT |
1.96 |
5.21 |
-1.37 |
1.01 |
14.77 |
13.92 |
– |
– |
10.82 |
Bloomberg, as of May 31, 2025. Inception date for ZEQT = January 24, 2022.
Definitions
[1] Strategic Asset Allocation: a portfolio strategy where target allocations are set for various asset classes and then the portfolio is rebalanced periodically. The portfolio is rebalanced to the original allocations when they deviate significantly from the initial settings due to differing returns from the various assets.
 Sheldon Quan King is Senior Product Manager for BMO Global Asset Management. Sheldon has over 10+ years of industry experience and has spent the last 9 years growing BMO Global Asset Management’s suite of Mutual Funds and ETFs. Previously, on the ETF Institutional and Service team Sheldon and has also been a guest speaker at Canadian Universities delivering ETF education to students. His primary focus now is ETF product marketing at BMO ETFs by engaging stock exchanges, capital markets desks, index providers, and portfolio managers to grow BMO’s existing suite and and launch new ETFs. Sheldon graduated with a Bachelors Degree in Psychology from York University, and is a CFA Level 3 candidate.
Disclaimers:
This article is for informational or educational purposes only and does not provide investment advice or recommendations.
All investments involve risk. The value of an ETF can go down as well as up and you could lose money. The risk of an ETF is rated based on the volatility of the ETF’s returns using the standardized risk classification methodology mandated by the Canadian Securities Administrators. Historical volatility doesn’t tell you how volatile an ETF will be in the future. An ETF with a risk rating of “low” can still lose money. For more information about the risk rating and specific risks that can affect an ETF’s returns, see the BMO ETFs’ simplified prospectus. BMO Global Asset Management is a brand name under which BMO Asset Management Inc. and BMO Investments Inc. operate.
Index returns do not reflect transactions costs or the deduction of other fees and expenses and it is not possible to invest directly in an Index. Past performance is not indicative of future results.
ZEA and ZEM or securities referred to herein are not sponsored, endorsed or promoted by MSCI Inc. (“MSCI”), and MSCI bears no liability with respect to ZEA or ZEM or securities or any index on which ZEA or ZEM or securities are based. The prospectus of the BMO ETFs contains a more detailed description of the limited relationship MSCI has with BMO Asset Management Inc. and any related BMO ETFs.
An S&P, Dow Jones, Standard & Poor or S&P index (the "Index"): the Index is a product of S&P Dow Jones Indices LLC or its affiliates ("SPDJI"), and has been licensed for use by the Manager. S&P®, S&P 500®, US 500, The 500, iBoxx®, iTraxx® and CDX® are trademarks of S&P Global, Inc. or its affiliates ("S&P") and Dow Jones® is a registered trademark of Dow Jones Trademark Holdings LLC ("Dow Jones"), and these trademarks have been licensed for use by SPDJI and sublicensed for certain purposes by the Manager. ZSP, ZMID and ZSML are not sponsored, endorsed, sold or promoted by SPDJI, Dow Jones, S&P, their respective affiliates, and none of such parties make any representation regarding the advisability of investing in such product(s) nor do they have any liability for any errors, omissions, or interruptions of the Index.
Commissions, management fees and expenses all may be associated with investments in exchange traded funds. Please read the ETF Facts or simplified prospectus of the BMO ETFs before investing. The indicated rates of return are the historical annual compounded total returns including changes in unit value and reinvestment of all dividends or distributions and do not take into account sales, redemption, distribution or optional charges or income taxes payable by any unitholder that would have reduced returns. Exchange traded funds are not guaranteed, their values change frequently and past performance may not be repeated.
For a summary of the risks of an investment in the BMO ETFs, please see the specific risks set out in the BMO ETF’s prospectus. BMO ETFs trade like stocks, fluctuate in market value and may trade at a discount to their net asset value, which may increase the risk of loss. Distributions are not guaranteed and are subject to change and/or elimination.
BMO ETFs are managed by BMO Asset Management Inc., which is an investment fund manager and a portfolio manager, and a separate legal entity from Bank of Montreal.
This material is for information purposes only. The information contained herein is not, and should not be construed as investment, tax or legal advice to any party. Particular investments and/or trading strategies should be evaluated and professional advice should be obtained with respect to any circumstance.
The viewpoints expressed by the author represents their assessment of the markets at the time of publication. Those views are subject to change without notice at any time.
Any statement that necessarily depends on future events may be a forward-looking statement. Forward-looking statements are not guarantees of performance. They involve risks, uncertainties and assumptions. Although such statements are based on assumptions that are believed to be reasonable, there can be no assurance that actual results will not differ materially from expectations. Investors are cautioned not to rely unduly on any forward-looking statements. In connection with any forward-looking statements, investors should carefully consider the areas of risk described in the most recent prospectus.
“BMO (M-bar roundel symbol)” is a registered trademark of Bank of Montreal, used under licence.