Hub Blogs

Hub Blogs contains fresh contributions written by Financial Independence Hub staff or contributors that have not appeared elsewhere first, or have been modified or customized for the Hub by the original blogger. In contrast, Top Blogs shows links to the best external financial blogs around the world.

When mega-IPOs meet index investing

Franklin Templeton ETFs

By Dina Ting, CFA, Franklin Templeton ETFs

(Sponsor Blog)

For decades, public markets were where companies grew up. Investors could watch young firms move from small-capitalization (cap) to mid-cap level and, for the rare few, into the ranks of the largest companies in the world. That journey today happens increasingly in private markets. We’re seeing now that by the time some companies list, they can seem to arrive already fully formed.

This shift is testing index construction. The impending listings from the likes of SpaceX, OpenAI and Anthropic have prompted index providers to revisit how quickly very large companies making initial public offerings (IPOs) should enter major benchmarks. Some index providers, including FTSE Russell and Nasdaq, have been racing to ensure benchmarks can capture the next generation of large public listings. Others, including S&P Dow Jones Indices, have preferred to keep established guardrails in place, maintaining a more deliberate approach to eligibility and inclusion.

In our view, this diversity of approaches is healthy. Index providers are trying to balance two important goals: reflecting the investable market as it evolves, while maintaining liquidity, stability and transparent rules. There is no single correct answer. A benchmark that moves too slowly may miss important changes in the economy. A benchmark that moves too quickly may expose investors to companies before trading history, float and fundamentals are well established.

An overlooked aspect of benchmark construction is that headline valuations and index weights are not the same thing. Most major equity indexes rely on free-float-adjusted market capitalization, which means they consider the shares actually available for public trading. FTSE Russell’s own preliminary analysis of SpaceX assumed a total market capitalization of US$1.5 trillion but available market capitalization of about US$70 billion, producing estimated weights of only 0.11% in the Russell 1000 Index and 0.08% in the FTSE GEIS All-World Developed Index.1

A company may dominate headlines yet enter a broad index with a relatively modest initial footprint. Over time, lockup restrictions — which typically prevent founders, employees and early investors from selling shares immediately after an IPO — expire, allowing more shares to enter the public market and potentially increasing the company’s index weight.

Another question investors may not have considered is whether these listings automatically make indexes more growth oriented. At first glance, the answer might seem like a no-brainer. Many of these companies operate in areas such as artificial intelligence (AI), aerospace and cloud infrastructure. Yet index construction is often more nuanced than headlines suggest.

FTSE Russell’s treatment illustrates this. Fast-entry IPOs have generally inherited the style characteristics of their assigned subsector until company fundamentals become available. However, the index provider has also acknowledged that relying solely on industry averages could create what it calls “market misrepresentation,” leaving room for alternative treatment in certain cases. For SpaceX, FTSE’s preliminary classification pointed to telecommunications, where the subsector average was 18% growth and 82% value.2

That may surprise investors who instinctively view anything rocket-fueled as growth. But it is a useful reminder: Index investing is rules-based, not headline-based. Style indexes do not simply ask whether a company feels innovative. They evaluate characteristics such as valuation, earnings, growth metrics and industry classification. As more mature private-market companies list, some may challenge traditional style frameworks.

This is where broader portfolio implications emerge. Broad-market index ETFs remain efficient, tactical tools for gaining diversified equity exposure, and country or style ETFs can help investors express more targeted views. But indexes are not static. New companies enter, sector weights shift, float changes, classifications evolve and concentrations emerge. Index exposure is therefore not necessarily something investors should set and forget. Continue Reading…

Should you Buy a Business instead of Starting one?

Photo by Amy Hirschi on Unsplash

By Devin Partida

Special to Financial Independence Hub

For entrepreneurs, the path to success often begins with the critical decision of whether to buy a business or start one from scratch. The right choice boils down to a few key preferences, such as the level of risk you’re willing to take and your long-term goal of achieving financial independence. Identifying these factors is key to understanding which option is ideal for you.

The Blank Canvas of a New Business

Building a business from the ground up is the ultimate exercise of creative control. You formulate the business model, create the brand identity and hire the team. For opportunistic professionals, this flexibility allows you to jump on market openings the moment you spot them. The level of operational and strategic autonomy you have when starting a business is far greater than when acquiring one.

However, that creative freedom does come with a unique set of risks. In fact, roughly 50% of new businesses fail within their first five years. This staggering statistic underscores the difficulty of building consistent cash flow and securing a customer base while simultaneously proving your business model.

More likely than not, starting a business means navigating years of financial losses before turning a meaningful profit. If you’re the founder, your personal finances are likely to absorb the initial shocks.

Buying a Business means acquiring Immediate Momentum

Taking over an established business is essentially an investment in momentum. You get instant access to existing cash flow, a customer base and a working business model. The costly trial-and-error phase is completely mitigated, and you have the privilege of building off the previous owners’ inertia.

Yet, acquiring an established business often comes at a considerable cost. Acquisitions require significant seller financing or up-front capital, which often entails complex bank loan arrangements. While it is the less risky option, the initial investment will likely be more costly than building a new business on your own terms.

Additionally, buyers risk inheriting unseen liabilities or a toxic workplace culture. When you buy an existing business, you’re simultaneously purchasing someone else’s success and unaddressed problems.

Key Factors to Consider before making a Decision

Making the right decision requires a meticulous navigation of your preferences and resources, including:

  • Financial resources: Startups can allow you to develop your business at a pace that aligns with your financial reality. However, if you have substantial capital to invest, buying a business can generate far quicker returns, directly accelerating your timeline to Financial Independence.
  • Risk tolerance: Starting a new company is statistically risky, requiring a high tolerance for volatility and economic uncertainty. While taking ownership of a working enterprise is more predictable, approaching it without adequate knowledge brings considerable financial dangers.
  • Industry expertise: Building a successful business requires deep market expertise and an aptitude for strategy. Alternatively, taking over a stable operation allows you to rely on existing teams while you learn.
  • Desired level of control: Founders typically want a blank canvas to execute a specific vision. Buyers must be willing to adapt to existing workflows and culture.

Essential Due Diligence Steps before Finalizing an Acquisition

Before officially acquiring a business, entrepreneurs are advised to conduct a thorough evaluation of the company and develop a strong understanding of its financial and operational standing.

Financial Verification

Even if a company’s overall revenue is healthy, it doesn’t showcase the full financial reality of owning it. Before making a purchase, you must review several years of tax returns and bank statements to understand the business’s financial history. Understanding the Seller’s Discretionary Earnings — which is the calculation of an owner’s entire financial benefit — is also nonnegotiable. Continue Reading…

IMAX: A World of Opportunity for International Equity ETFs

Image source: Hamilton ETFs

By Hamilton ETFs

(Sponsor Blog)

International equities continue to be in focus. As global market leadership broadens, Canadian investors are paying closer attention to geographic diversification and opportunities beyond North America. International stocks, which outperformed the U.S. stock market in 2025, have continued to attract attention as the geopolitical landscape evolves.

So far this year, Canadians have poured $22.8 billion into international equity ETFs, according to National Bank of Canada Capital Markets[1]. In contrast, they directed just $13.4 billion to Canadian equity funds and $11.3 billion to U.S. equity funds, over the same period.

Recent market performance has helped reinforce this trend. Since December 31, 2024, the MSCI EAFE Index rallied 40.5% compared to 24.6% for the S&P 500[2].

This combination of improved relative performance and more attractive valuations has helped bring international equities back into focus for investors looking to broaden exposure beyond North America. This shift has also been reflected in market commentary. Yardeni Research began recommending a “Go Global” approach in December 2025, after more than a decade of favouring a “Stay Home” allocation. “So far this year, the U.S. has been among the laggards in the global performance derby,” he wrote in a research note published April 27, 2026.

Canadian investors have plenty of options for accessing international equity exposure. Yet for those seeking attractive, tax-efficient monthly income from developed markets outside North America, the available solutions have been far more limited. That’s why we’re closing that gap with the Hamilton International Equity YIELD MAXIMIZER™ ETF (IMAX).

Introducing IMAX

IMAX is designed for investors seeking diversified international equity exposure paired with attractive, tax-efficient monthly income. To achieve this, IMAX holds ETFs that provide exposure to both the MSCI EAFE Index and MSCI EAFE IMI Index and overlays a covered call strategy on a portion of the portfolio. The MSCI EAFE Index captures developed markets outside the U.S. and Canada.

International and global covered call ETFs remain relatively limited in Canada. The few available strategies often have significant geographic concentrations, such as Europe or the U.S., or provide exposure to a narrower group of companies through concentrated portfolios. By contrast, IMAX offers broad developed market exposure specifically outside North America. Through this approach, investors gain exposure to more than 2,500 large-, mid- and small-cap equities across markets including Japan, Britain, Switzerland, France, Germany and Australia.

To help generate monthly income, IMAX employs an actively managed covered call strategy overseen by our experienced options team. Like the other ETFs in our YIELD MAXIMIZER™ suite, IMAX utilizes an income first approach that primarily writes at-the-money call options in an effort to generate higher option premiums to provide enhanced cash flow potential. The strategy also maintains a flexible coverage ratio, allowing the portfolio management team to balance monthly income generation with long-term capital appreciation potential.

Importantly, IMAX helps provide tax efficient income, as options premiums are generally taxed as capital gains and/or return of capital.

Going Global with IMAX

Diversification is one of the most important principles of portfolio construction, and it applies not only across asset classes (stocks, bonds, commodities etc.), sectors and market capitalizations, but also regions. Continue Reading…

Vanguard Canada launches two new Dividend ETFs


ETF TSX Symbol Management Fee1
Vanguard Developed ex-North America Dividend Appreciation ETF VIGG 0.28%
Vanguard U.S. High Dividend Yield Index ETF (CAD-Hedged) VUDH 0.28%

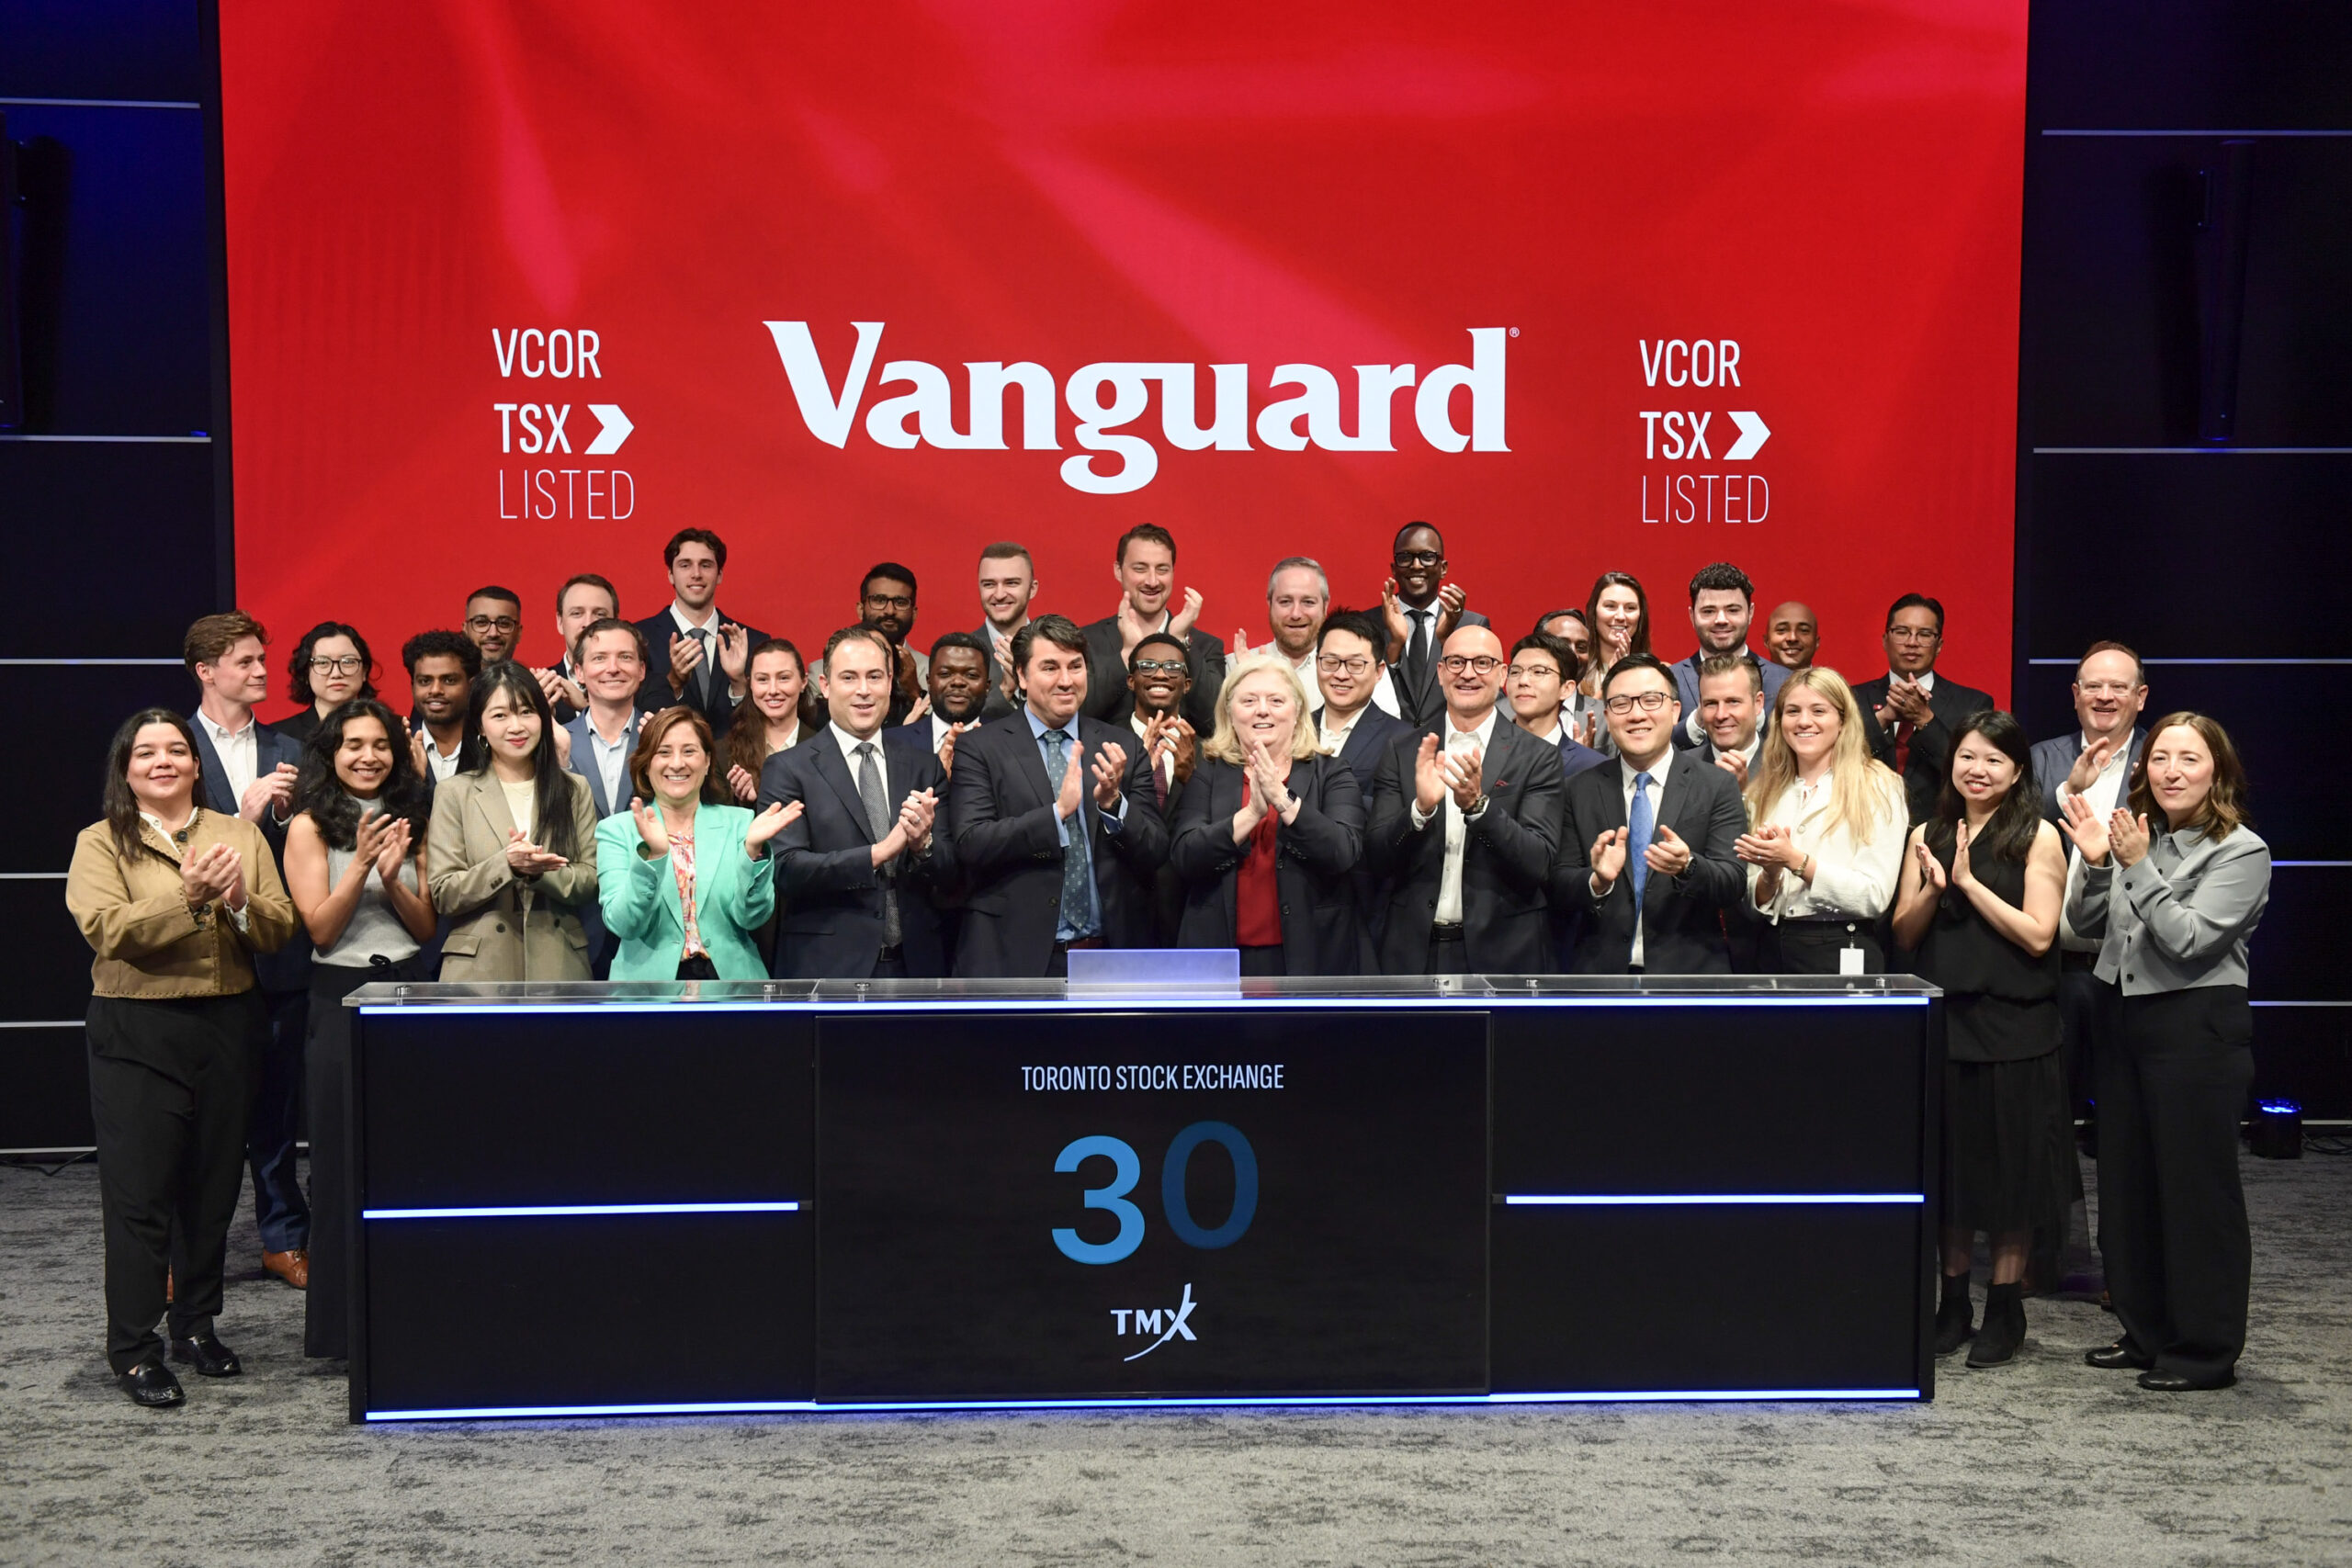
On Monday (June 1),  Vanguard Investments Canada Inc. announced two new income-focused Dividend ETFs. The same day, they started trading on the Toronto Stock Exchange (TSX):  Vanguard Developed ex-North America Dividend Appreciation Index ETF (TSX: VIGG) and Vanguard U.S. High Dividend Yield Index ETF (CAD-Hedged) (TSX: VUDH).

The two new funds are focused on high-dividend yield and dividend growth respectively, said Sal D’Angelo, Head of Product and Marketing, Vanguard Canada, in a press release.   VIGG tracks  a market cap-weighted index focused on companies located in developed markets excluding Canada and the U.S., with a history of increasing dividends over time.  Management fee is 0.28%. The Vanguard fact sheet describes VIGG as being medium risk.

VUDH tracks a market cap-weighted index focused on common stocks of U.S. companies with higher-than-average dividend yields, hedged to Canadian dollars; management fee is 0.28%. It is also rated medium risk.

In March, Vanguard also launched the Vanguard U.S. High Dividend Yield Index ETF  (VUDV, TSX).

In a backgrounder released with the ETFs, Vanguard said Dividend Income ETFs account for $42 billion or 5.4% of total ETF assets in the Canadian market. They include passive funds, fully active mandates and covered call options.

Dividend-focused ETFs have historically shown resilience across many market environments, the document says: “They can also provide stability in uncertain and inflationary environments through reliable cash flows which can partially offset inflation. The companies included in these portfolios tend to be more defensive during periods of market volatility, supported by steady earnings and stronger balance sheets.”

The backgrounder focuses on two main types of Dividend ETFs: those that generate high Dividend Yield, and those that grow their Dividends over time.

High-Dividend Yield ETFs

Vanguard says High-Dividend Yield ETFs are best suited for “investors looking for more immediate income including retirees drawing from their portfolios or those supplementing current cash flow.”  Higher starting yields provide more immediate income as the portfolio invests in mature, stable and value-oriented companies, with a higher allocation to sectors like energy, utilities and financials. Continue Reading…

Small ETF Fees matter more Near Findependence

By Callum Melville, WealthRadiant.com

Special to Financial Independence Hub

Most Canadian ETF investors already know that fees matter. The harder question is how much attention they deserve.

Early in the Accumulation years, the honest answer is often less than people think. If someone has a $15,000 portfolio and is still building the habit of investing every month, the difference between a 0.06% ETF and a 0.20% ETF is not the main thing deciding their future. Saving rate, asset allocation, behaviour, and simply staying invested usually matter more.

But the math starts to feel different as a portfolio approaches retirement size.

A 0.14 percentage point fee gap sounds tiny. On $25,000, it is about $35 per year before compounding. On $1,000,000, it is about $1,400 per year before compounding. Over a long retirement or semi-retirement period, that difference can become large enough to be worth a second look.

That does not mean every investor should chase the lowest possible MER. It does mean investors near Financial Independence (Findependence) should translate fee percentages into dollars before deciding that a small-looking fee difference is irrelevant.

Why MERs are easy to ignore early on

Management Expense Ratios are strange because investors rarely pay them as a separate bill. The fee is embedded in the fund’s return. You do not log in and see a line item saying, “ETF fee paid today.”

That makes MERs easy to underweight. A 0.20% fee looks almost invisible beside the normal movement of the market. One ordinary trading day can move an equity ETF by more than the annual MER.

For newer investors, this is not always a bad thing. The biggest investing mistakes at the beginning are often behavioural: waiting too long to start, holding too much cash for no clear reason, changing strategy every few months, or building a portfolio that is too complicated to maintain.

If an All-in-One ETF helps someone invest consistently, rebalance automatically, and avoid tinkering, the slightly higher MER can be a reasonable price for simplicity. A cheap portfolio that someone cannot stick with is not really cheap.

Why fees feel different near retirement

Near Findependence, the same fee percentage applies to a much larger base.

Consider a simple example. A 0.20% MER on a $1,000,000 portfolio is roughly $2,000 per year before compounding. A 0.06% MER on the same portfolio is roughly $600 per year. The gap is about $1,400 in the first year.

That is not life-changing by itself, but it is no longer abstract. It might be a month of groceries, a short trip, part of a property tax bill, or simply money that could stay invested.

The compounding effect is what makes the check worth doing. Using a simplified 25-year projection with a 6% gross annual return, a $1,000,000 portfolio at a 0.06% MER grows to about $4.23 million. The same portfolio at a 0.20% MER grows to about $4.09 million. The difference is roughly $138,000 over 25 years.

That example is deliberately simplified. It ignores taxes, trading costs, changing returns, withdrawals, and Asset Allocation differences. Real life will not move in a smooth 6% line. But it shows why a basis-point difference that looked harmless early on can deserve attention once the portfolio is large.

What a recent Canadian ETF fee snapshot showed

I recently reviewed MERs and historical fee anchors for 30 popular Canadian-listed ETFs across Vanguard, iShares, BMO, and Global X. The goal was not to find the “best” ETF. It was to see where fees have compressed, where they remain higher, and where investors may be paying for convenience or product structure.

The broad pattern was clear:

  • Canadian total-market ETFs in the sample were extremely cheap, with VCN, XIC, and ZCN all at 0.06%.
  • S&P 500 index ETFs were also tightly clustered, with VFV, VSP, XSP, and ZSP all around 0.09%.
  • The all-in-one ETF category was more expensive, with the funds in the sample sitting roughly between 0.17% and 0.24%.
  • More specialized products, such as covered-call or sector ETFs, could be meaningfully more expensive.
  • Fee compression has not been even. Some plain index categories already look highly competitive, while other product types still carry a visible cost.

The average MER across the 30 ETFs was 0.178%, with a median of 0.140%. That is already low compared with many traditional retail mutual fund fee levels, but the spread still matters when applied to large portfolios.

For example, an all-in-one ETF charging around 0.20% may be perfectly reasonable for an investor who values simplicity. But compared with a plain Canadian equity ETF at 0.06% or an S&P 500 ETF at 0.09%, the dollar cost of convenience becomes visible as portfolio size grows.

The All-in-One ETF tradeoff

All-in-one ETFs are a good example because the fee conversation can easily become too rigid.

An investor can often build a lower-MER portfolio by holding separate Canadian, U.S., international, and bond ETFs. But the all-in-one fund handles asset allocation, rebalancing, and ongoing maintenance in one product.

That can be valuable. Retirees and near-retirees may not want more moving parts. Some investors do not want to rebalance manually. Others know that if the portfolio becomes too fiddly, they are more likely to second-guess it.

So the right question is not, “Is this ETF the cheapest?” Continue Reading…