Victory Lap

Once you achieve Financial Independence, you may choose to leave salaried employment but with decades of vibrant life ahead, it’s too soon to do nothing. The new stage of life between traditional employment and Full Retirement we call Victory Lap, or Victory Lap Retirement (also the title of a new book to be published in August 2016. You can pre-order now at VictoryLapRetirement.com). You may choose to start a business, go back to school or launch an Encore Act or Legacy Career. Perhaps you become a free agent, consultant, freelance writer or to change careers and re-enter the corporate world or government.

Sector ETFs for Defensive Plays

By Mirza Shakir, Associate Portfolio Manager, BMO ETFs

(Sponsor Content)

What are Sector ETFs?

Sector ETFs allow targeted exposure to sectors or industries like financials, materials, or information technology – domestic, regional, or global. The sectors are usually classified according to the Global Industry Classification Standard (GICS), but other classifications can also be used. While sector ETFs could be active funds, most track an index, offering transparency, liquidity, and low fees.

There are eleven broad GICS sectors that can be invested in with sector ETFs.

  • Energy
  • Materials
  • Industrials
  • Consumer Discretionary
  • Utilities
  • Real Estate
  • Communication Services
  • Financials
  • Health Care
  • Consumer Staples
  • Information Technology

There are two common approaches in constructing a sector portfolio: market capitalization weighted and equal weighted. As the names suggest, the former approach weights securities in the portfolio by market capitalization while the latter weights them equally.

At BMO ETFs, our suite of sector ETFs covers equal-weighted and market-weighted strategies across all sectors, locally and globally. We opt for equal-weighted strategies for sectors that have the potential to get concentrated in a few large names with the market-capitalization approach, ensuring effective diversification and mitigating individual company risk.


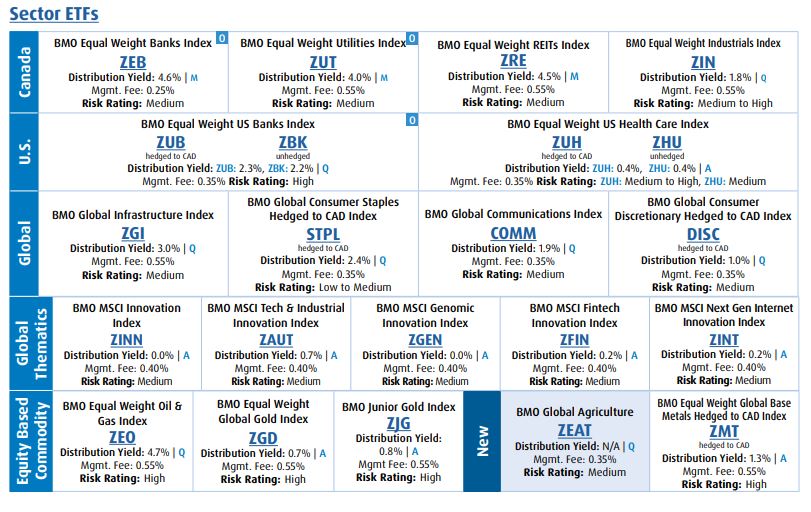
Source: BMO GAM, BMO ETF Roadmap February 2023 (Visit ETF Centre – CA EN INVESTORS (bmogam.com)

Annualized Distribution Yield: The most recent regular distribution, or expected distribution, (excluding additional year end distributions) annualized for frequency, divided by current NAV.

Risk is defined as the uncertainty of return and the potential for capital loss in your investments.

Why Invest in Sector ETFs?

Sector ETFs can offer differentiated return and risk profiles for investors, not only from broad market portfolios but also from other sectors. Additionally, investing in a sector ETF allows access to a broad range of companies that have businesses that operate in similar or related industries, which can be more diversified than investing in a single stock. The investor does not have to place individual bets on single companies, which helps limit company-specific risks.

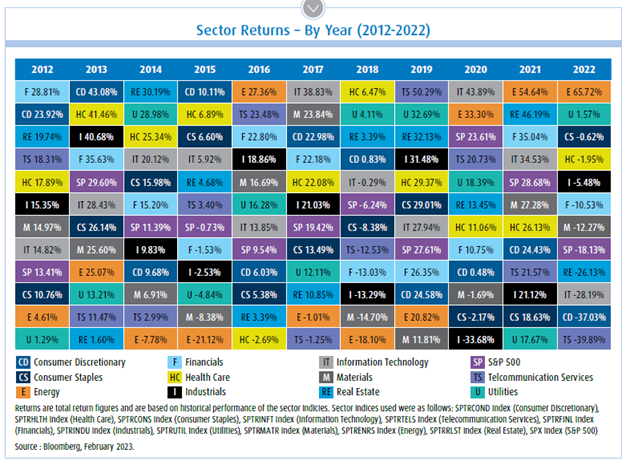
The table shown at the top of this blog, and shown to the right in miniature, shows the performance of all sectors in the U.S. from 2011 to 2022. Notably, the best and worst performing sectors change every year, leaving an opportunity for market timing to generate high returns. However, timing the markets can be extremely difficult. A more effective strategy can be sector rotation, which involves overweighting or underweighting sectors relative to the stage of the business cycle.

Playing Defense – Sector Rotation Strategies

The business or economic cycle refers to a cycle of expansion and contraction that economies undergo, accompanied by similar upswings and downswings in economic output and employment. Continue Reading…

Rate Hike hiatus?

By Dale Roberts, cutthecrapinvesting

Special to Financial Independence Hub

Late in January, the Bank of Canada boosted rates by another 0.25% and signalled that they will now pause and evaluate. I’ve been calling that the rate hike hiatus. As I touched on in mid-January, inflation is moving in the right direction and the consumer is holding up quite well. It’s a Goldilocks scenario, for now. That said, the rate hikes have not worked their way through the economy. In fact, many suggest that we’ve felt almost no economic damage from the rate hikes. There is a lag affect; it can take a year or two for hikes to be felt in full. But let’s call the rate hike hiatus good news.

The big news last month was the announced rate hike hiatus in Canada. Of course, markets are forward “thinking” and they are pricing in a soft landing and rate cuts in 2023. That Yahoo!Finance post suggest that cuts are likely not on the table this year. That would only happen if something breaks and we get a serious-enough recession. Also, inflation would have to be completly under control. The Bank of Canada is not likely to cut rates if inflation is not close to that 2% target.

Rate guesses, not so good …

The consensus appears to be the call that there will be no rate cuts in 2023, though there is a sprinkling of calls for cuts in late 2023. And all said, we should remember the rate predictions from March.  Not even close.

Inflation is so unpredicatable. And inflation might still be driving the bus in 2023.

Coming in for a landing

Lance Roberts looks at the history of soft landing and hard landings. There were 3 past soft landing scenarios, but none in an inflationary environment. The affect of rate hikes have largely not been felt, and likely have had little push on inflation. But that will come over time of course.

Here’s the chart that shows the positive effect of a weak U.S. Dollar for international equities. With bonds looking better and the potential for international markets, the traditional balanced portfolio might ‘be back’ one day soon.

A Weak Dollar Bodes Well For Non-U.S. Equities – ⁦@SoberLook⁩ ⁦@bcaresearch

Originally tweeted by Rob Hager (@Rob_Hager) on January 24, 2023.

Stacking those dividends

Dividend Daddy knows how to stack and count those dividends.

Here is a popular tweet on the simple basics of wealth creation and the path to financial happiness … Continue Reading…

North American stock portfolio outperforms when it counts

By Dale Roberts, cutthecrapinvesting

Special to the Financial Independence Hub

For U.S. stocks, my wife and I hold 17 Dividend Achievers, plus 3 stock picks. In Canada, I hold the Canadian Wide Moat 7, while my wife holds a Canadian High Dividend ETF – Vanguard’s VDY. There is also a modest position in the TSX 60 – XIU. The U.S. and Canadian stocks both outperform their respective stock market index benchmarks. Working together, the U.S. and Canadian stocks form an all-weather portfolio base.

In this post I’ll offer up charts on our U.S. stock portfolio and the Canadian stock portfolio. And I’ll put them together so that we can see how they work together. The total portfolio was designed to be retirement-ready. The fact that it beats the market benchmarks is a welcome surprise. At the core of the portfolio is wonderful Canadian dividend payers – the U.S. dividend achievers and 3 picks fill in some portfolio holes. We will also take a look at how these stocks can be arranged to provide an all-weather stock portfolio base.

When I write ‘our portfolio,” I am referring to the retirement portfolios for my wife and me. As for ‘backgrounders’ on the portfolios please have a read of our U.S. stock portfolio and the Canadian Wide Moat 7 performance update.

The stock portfolios

In early 2015 I skimmed 15 of the largest-cap dividend achievers. What does skim mean? After extensive research into the portfolio “idea” I simply bought 15 of the largest-cap dividend achievers. For more info on the index, have a look at the U.S. Dividend Appreciation Index ETF (VIG) from Vanguard. That is a U.S. dollar ETF. Canadian investors can also look to Vanguard Canada for Canadian dollar offerings (VGG.TO).

You’ll find the dividend acheivers and Canadian high dividend stocks in the ETF portfolio for retirees post. Both indices are superior for retirement funding, compared to core stock indices.

Dividend growth plus quality

At the core of the index is a meaningful dividend growth history (10 years or more) working in concert with financial health screens. It leads to a high quality skew. Given those parameters the dividend achievers index will certainly hold many dividend aristocrats (NOBL).

The 15 companies that I purchased in early 2015 are 3M (MMM), PepsiCo (PEP), CVS Health Corporation (CVS), Walmart (WMT), Johnson & Johnson (JNJ), Qualcomm (QCOM), United Technologies, Lowe’s (LOW), Walgreens Boots Alliance (WBA), Medtronic (MDT), Nike (NKE), Abbott Labs (ABT), Colgate-Palmolive (CL), Texas Instruments (TXN) and Microsoft (MSFT).

United Technologies merged with Raytheon (RTX) and then spun off Carrier Global Corporation (CARR) and Otis Worldwide (OTIS). We continue to hold all three and they have been wonderful additions to the portfolio. Given that those stocks are not available for the full period, they are not a part of this evaluation. That said, the United Technologies spin-offs added to the outperformance.

Previous to 2015 we had three picks by way of Apple (AAPL), BlackRock (BLK) and Berkshire Hathaway (BRK.B). Those stocks are overweighted in the portfolio. As you might expect, Apple has contributed greatly to the portfolio outperformance. Though the achievers also outperform the market with less volatility.

In total it is a portfolio of 20 U.S. stocks.

The Canadians

I hold a concentrated portfolio of Canadian stocks. What I give up in greater diversification, I gain in the business strength and potential for the companies that I own to not fail. They have wide moats or exist in an oligopoly situation. For the majority of the Canadian component of my RRSP account I own 7 companies in the banking, telco and pipeline space. I like to call it the Canadian wide moat portfolio. They also provide very generous and growing dividends. These days, they’d combine to offer a starting yield in the 6% range.

Here are the stocks:

Canadian banking

Royal Bank of Canada (RY), Toronto-Dominion Bank (TD) and Scotiabank (BNS).

Telco space

Bell Canada (BCE) and Telus (T).

Pipelines

Canada’s two big pipelines are Enbridge (ENB) and TC Energy (TRP).

*Total performance would be improved by holding the greater wide moat portfolio that includes grocers and railway stocks. That is a consideration for those in retirment and in the accumulation stage.

The Canadian mix outperforms the market, the TSX Composite. You’ll also find that outperformance in the Beat The TSX Portfolio. That BTSX strategy (like the Wide Moat 7) finds big dividends, strong profitability and value.

Once again, my wife holds an ETF – the Vanguard High Dividend (VDY) and a modest position in XIU. I did not want to expose her portfolio to concentration risk.

The charts

Here’s the returns of the U.S. and Canadian portfolios, plus a 50/50 U.S/CAD mix as the total portfolio. The period is January of 2015 to end of September 2022. Please keep in mind the returns are not adjusted for currency fluctuations. A Canadian investor has received a boost thanks to the strong U.S. dollar. U.S. investors owning Canadian stocks would experience a negative currency experience. Continue Reading…

Re-examining our plans for Financial Independence

By Bob Lai, Tawcan

Special to the Financial Independence Hub


When we started our financial independence journey back in 2011, we didn’t set a specific FI date or number. In our minds, we do not doubt whether we could become financially independent or not. We knew we’d become financially independent in the future. It was just a question of time. We simply needed to have patience and let our investments compound over time.

A few years into our FI journey, our FI plan started to evolve. Rather than having a specific liquid net worth and utilizing the 4% safe withdrawal rule, we decided to have enough dividend income to cover our expenses. Looking at the calendar, we randomly set a target of reaching this milestone by 2025 or earlier.

It’s funny how ten years seemed to have gone by in the blink of an eye. At the same time, a lot has happened in our lives…

  • Getting engaged and married
  • Having two kids
  • Moving from an apartment in Vancouver to a house in the suburb
  • Me having different job titles, going from engineering to project managing to product marketing to engineering
  • Mrs. T starting her holistic doula practice
  • Starting my photography business ( I’ve been on a bit of break the last few years)
  • Starting this blog, writing articles, learning new things, and connecting with other like-minded people

One thing I’ve realized is that life is never static. It’s always dynamic. Although we can do as many projections and make as many plans as we possibly can, projections and plans do and will change. Therefore, with three years to go before 2025, I thought it would be a good time to re-examine our financial independence plans and see if we need to make any adjustments.

Our FI numbers 

Since starting our FI journey, we have tracked our expenses meticulously. Here are our annual expenses since 2012:

Total Necessities Total Annual Spending
2012 $26,210.52 $44,603.76
2013 $26,343.00 $45,260.88
2014 $29,058.96 $47,391.96
2015 $31,256.88 $47,270.16
2016 $29,831.40 $47,566.96
2017 $33,887.68 $51,144.77
2018 $31,840.75 $57,231.99
2019 $33,199.98 $54,906.02
2020 $35,511.60 $48,908.74
2021 $38,950.66 $71,852.02

Necessities cover core expenses like food, insurance, housing, clothing, utilities, car, etc. Other expenses are considered as non-core expenses which include things like dining out, skiing, camping, travel, charitable donations, gifts, etc.

The last two years have been abnormal in terms of spending. Due to the pandemic, our spending was much lower than usual in 2020. Then last year we had unplanned expenses of around $16,500 on our cat and our house. If we take this amount out, it’d put our 2021 annual spending to around $55,000.

Based on our historical spending trend, I would estimate that we need somewhere between $50,000 to $60,000 in dividend income annually to cover our expenses. To be on the safe side, I’d use $60,000 annual spending for any FI plans because we need to have inherent built-in flexibility on variables outside of our control, like major purchases, emergencies, etc.

The $60k annual spending estimate, of course, assumes that we continue to live in Vancouver and do not have many significant changes in our spending habits.

One thing to keep in mind is our spending can drastically come down if we decide to geo-arbitrage by moving to a smaller Canadian town or somewhere in South East Asia with a lower cost of living than Vancouver. On the flip side, the spending number can increase if we move to Denmark and live there for a few years (I’m ignoring the tax consequences for now).

How much do we need in our dividend portfolio?

How much do we need in our dividend portfolio to generate $60,000 in dividend income? Let’s do a quick math exercise, shall we?

For $60,000 dividend income per year, at 3% dividend yield, we’d need a dividend portfolio worth $2 million; at 4% dividend yield, we’d need a dividend portfolio worth $1.5 million. In other words, we need a portfolio valued between $1.5 million to $2 million. That’s certainly not a small chunk of change.

Now, if we take a middle-of-the-road approach and use a portfolio dividend yield of 3.5%, that means a portfolio value of around $1.714 million.

One thing is clear – we need to continue to save and invest money in our dividend portfolio. We also need to find the right mix between high-yield low-dividend growth stocks and low-yield high-dividend growth stocks.

With three years remaining in our FI timeline, it might be tempting to start buying more very-high-yield dividend stocks to make sure we can reach our FI target. But it is very important to make sure our dividend income is safe and remains sustainable over time. We definitely don’t want to hit $60,000 in dividend income one year only to see that amount slashed by 20% or more the next year.

The stability of our dividend income is extremely vital.

We also want to make sure the portfolio value continues to appreciate over time. The rationale is simple – total returns matter. Having a stable and safe dividend income and a portfolio that increases value over time will give us more options.

By 2025, both Mrs. T and I will be in our early 40s. With decades ahead of us, we need to ensure our dividend income can grow organically over time and inflation doesn’t eat into our dividend income’s buying power. It will be necessary to have some low-yield high-dividend growth stocks in our portfolio to allow for organic dividend growth.

The plan of living off dividends 

Living off dividends is an amazing idea. Based on my dividend income projection, we should receive $51,000 in dividend income in 2025. However, when we compare that number with the $60,000 annual spending target, it doesn’t take a rocket scientist to realize that we are short by several thousand dollars. Continue Reading…

How Real People manage their money in Retirement

By Fritz Gilbert, TheRetirementManifesto.com

Special to the Financial Independence Hub

Managing a personal portfolio is always a challenge. It’s something we typically do alone (or with an advisor) and we seldom get insight into how others manage their money in retirement.

Are we doing it right?  What are other people doing?  What can I learn from them?

While reading various blogs is helpful (and appreciated by this writer), what if we could gain real insight into how other “real” people manage their money in retirement?

Today, we’re in luck.  I recently found a fascinating study that provides some rare insight.

Real people.  Real money.  Real answers.

Today, a look into how people manage their money in retirement.


Managing our money in retirement is something that we typically keep to ourselves.  Seldom do we get an opportunity to see what others are doing.  Fortunately, JP Morgan studied 31,000 people as they prepared for and entered retirement.  They compiled their findings for us in their report, “Mystery no more: Portfolio allocation, income, and spending in retirement.”

It’s a rare opportunity to compare ourselves to others, and I hope you’ll find it as interesting as I did.  Below is a summary of the report, organized by major topic.

Voyeurs rejoice, it’s time to see how others are managing their money in retirement.


Asset Allocation:  Dialing Down The Risk

When retirees roll over their 401(k) balances, an astounding 75% reduce their exposure to equities.  The median reduction is 17%, and those with a higher equity exposure tend to reduce it the most.  Note in the chart below that those with an 80-100% equity exposure reduced it by 42%!

asset allocation in retirement

Are You Doing It Right?  Reducing your risk as you approach/enter retirement is an important strategy to reduce your Sequence of Return Risk.  If you have too large an exposure to stocks, you’ve likely suffered some anxiety in this year’s bear market.  Moving some of that equity into lower-risk asset classes allows you to fund your retirement spending without having to sell equities after a downturn.  As I’ve outlined in my posts on The Bucket Strategy, we keep 3 years of cash, and I’m sleeping just fine these days.


Using RMDs As Withdrawal Guidance

Required Minimum Withdrawals (RMDs) are established guidelines from the IRS for mandatory withdrawals from pre-tax retirement accounts starting at age 72 (Uncle Sam wants his tax revenue, after all!).

I was surprised to find that 80% of those surveyed who are younger than RMD age took no withdrawals from their retirement accounts. Meanwhile, a full 84% of those subject to RMD’s took only the minimum required withdrawal.

A better approach is to do annual withdrawals or Roth conversions prior to reaching your RMD age, using your marginal tax bracket and your safe spending rate as guidelines for how much to withdraw. It’s also important to recognize your spending will likely be higher in your earlier vs. later retirement years.  You’ve saved that money to enjoy retirement, so don’t let an IRS guideline dictate how much you can safely withdraw or spend.  Quoting from the study:

“The RMD approach is inefficient. It does not generate income that supports retirees’ & declining spending behavior and may leave a sizable account balance at age 100.”  Continue Reading…