Most of your investing life you and your adviser (if you have one) are focused on wealth accumulation. But, we tend to forget, eventually the whole idea of this long process of delayed gratification is to actually spend this money! That’s decumulation as opposed to wealth accumulation. This stage may also involve downsizing from larger homes to smaller ones or condos, moving to the country or otherwise simplifying your life and jettisoning possessions that may tie you down.
Mrs. T and I went on an Alaska cruise years ago, before kids and had a great time.
By Bob Lai, Tawcan
Special to Financial Independence Hub
Let’s be honest here, inflation is real. Very real! Despite being as frugal and careful with our expenses as possible, we are seeing an increase in our living expenses; arguably, just like everyone else.
Unfortunately, many of these expenses are completely outside of our control …
We were just informed by the city that our property tax increased by 11.5% this year
Our monthly equalized Fortis-BC payment increased by 20% due to natural gas rate adjustments
Gas prices recently hit over $2 per litre
Groceries cost way more now. I mean, a bag of Hardbite chips is over $5, and avocado costs $2 at regular price? What is this, highway robbery?
Let’s not forget the rising interest rates, leading to higher mortgage payments.
And those are just core expenses. Now if we consider discretionary expenses as well …
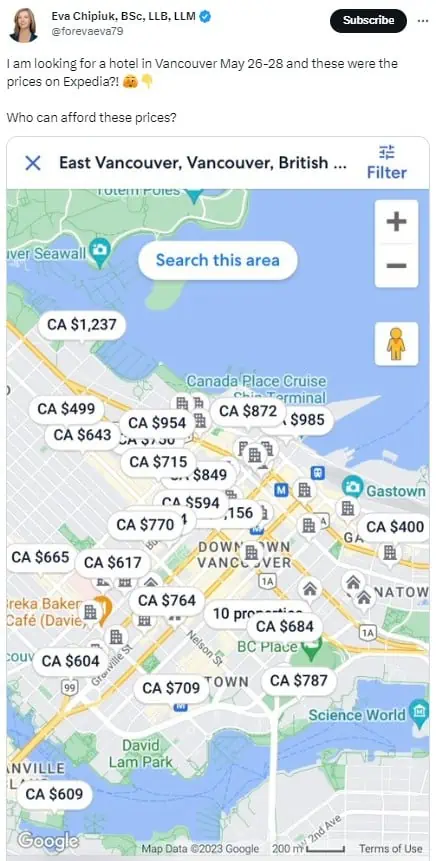
It’s not unusual to see hotels at over $250 per night, or even over $300 and even $400! In fact, recently a lawyer complained about the hotel prices in Vancouver. And is not alone!
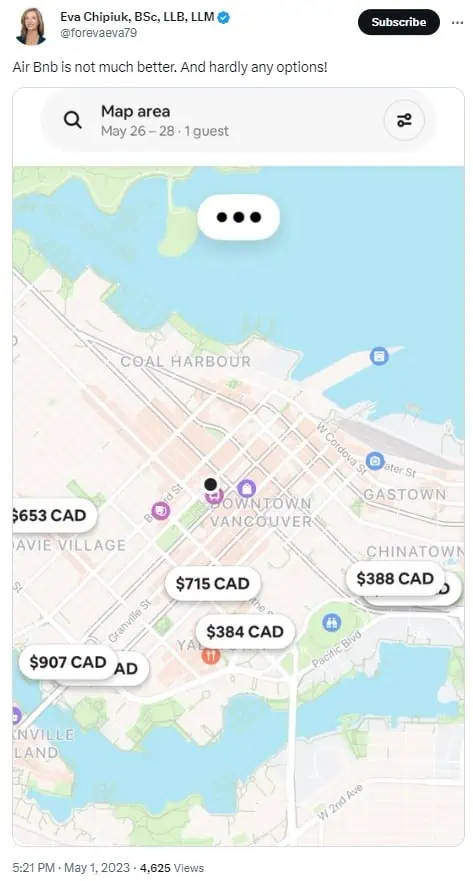
Staying at an Airbnb is just as costly and sometimes it costs even more than staying at a regular hotel
Airfares are far more expensive than pre-COVID. Good luck finding tickets to Europe for under $1,000 per person.
Dining out is more expensive. A bowl of ramen costs close to $20 with taxes and tips added. We spent over $120 for the four of us dining out at a local White Spot last month, and we only had burgers, a couple of milkshakes, and a dessert to share.
The other day I was looking at our budget/expense tracking spreadsheet. To my horror, I noticed that we have been overspending in our Play account by a significant margin. To be more specific, we have dined out far more so far in 2023 than in other years. We have had three months where we spent over $1,000 on dining out! (On average, we usually spend around $350 on dining out per month)
While I know we’ve spent big money on a few occasions, like Kid T2.0’s birthday dinner with 15 people, a big dim sum lunch with 9 people, dinners a few times in Whistler with Mrs. T’s family, Mrs. T’s birthday lunch with 11 people, and celebrating our wedding anniversary, I was surprised to see that we spent over $1,000 on dining out for May.
Sure, we ate out multiple times during our recent 4-day trip in Calgary, but that was around $500 in total. I couldn’t explain how we spent the other $500.
I was frustrated and bummed out about spending so much money dining out yet again. For the life of me, I couldn’t figure out how we spent the other $500. I did recall having takeout sushi for about $120 but I couldn’t think of other dining-out occasions.
After going through the credit-card statements and spreadsheet, I realized we have had many smaller dining out expenses. $20 here and there, $30 here and there, and the amount quickly added up.
During this frustrated & annoyed state, the only thing I could think of was that we needed to take some extreme action.
“No dining out or take-outs for June!” I declared to Mrs. T.
“And what do you plan to spend our money on?” Mrs. T asked.
I couldn’t answer her question at all. All I could think of is that we need to reduce our spending, so we can save more. I think deep inside I was worried that we’d run out of money because of the increase in our overall expenses.
Even with me writing about having a save-spend balance (i.e. spending money to enjoy the present moment and saving money for the future), all I could think of are…
Save! Save! SAVE!
Unfortunately, my save, save, save, and save some more mentality was creeping in very quickly.
I get a lot of friends and family asking for help figuring out their retirement finances when they’re just a few years from retiring. These discussions follow a common pattern: people say they want to spend more in their 60s while they’re still able to enjoy new experiences, but they make plans that involve spending less in their 60s than they will have available in their 70s and beyond. They resist a simple idea even after I show them how much more they could be spending early on.
I’ll illustrate what’s going on with an example that borrows from some of the real cases I’ve helped with.
Meet Dan
Dan is a single guy about to retire at 60. Here are his relevant financial details:
TFSA: $200,000
RRSP: $300,000
Pension: $4000/month indexed to inflation + $800/month bridge until he is 65
CPP: entitled to 90% of the maximum amount ($826 at 60, $1290 at 65, $1832 at 70)
OAS: entitled to the full amount ($740 at 65, $1006 at 70, 10% increase at 75)
Dan tried to work out what to do on his own initially. His thinking was mostly short term. To compensate for his drop in income when he retires, he would take his CPP right away, and take his OAS at 65. He wants some money to do some traveling over the next decade, and his work pension isn’t enough.
Here’s a chart of Dan’s inflation-adjusted income based on these plans. Note that in nominal terms, his income will go up with inflation each year, but we show it in constant 2025 dollars.
The first thing to notice is that Dan hasn’t included his RRSP or TFSA in these plans. He didn’t really think about them; he just assumes that they are for “later.” By default, Dan will have to convert his RRSP to a RRIF when he’s 71, and will have to start drawing from the RRIF when he’s 72. Let’s add in Dan’s RRIF income, assuming conservatively that his RRSP/RRIF will earn 2% above inflation.
We see now that contrary to Dan’s stated goal of having more income for traveling in his 60s, he’s actually planning to live small in his 60s. This is the point where I suggest starting to draw from his RRSP/RRIF right from the start of retirement.
Immediately, we run into a problem. Dan doesn’t think of himself as the sort of person who spends his RRSP. That’s for old people. He doesn’t feel very old. He doesn’t like this idea. He’s still the kind of person who saves money.
Not everyone can get past this point. Some live small for years to give themselves a large income in their 70s and beyond. Let’s hope that Dan can get used to the idea of starting to live now. Here’s a plan that smooths out Dan’s RRSP/RRIF income: Continue Reading…
Below we canvas 11 retirement experts and financial planners in Canada and the United States about how they and their clients can use new Longevity insurance products above and beyond traditional life annuities.
These experts were gathered by Featured.com, which has been supplying Findependence Hub with quality content for several years. It recently changed its procedure so editors like myself can request input on particular topics we think will interest our readership. The sources are all on LinkedIn, as you can see by clicking on their profiles below.
Here’s what we asked for this instalment:
“In addition to Annuities, what is one new Longevity product or fund that you believe in enough to recommend to clients approaching or already in Retirement? Examples in Canada are Purpose Longevity Fund and Guardian’s Longevity Funds. Are there similar new products in the U.S. (or Canada) of which you are aware?”
Here is what these 11 thought leaders had to say:
LifeX ETF delivers transparent Longevity Income
In addition to traditional annuities, one of the emerging longevity products in the U.S. that I have come to recommend to clients approaching or already in retirement is the LifeX Longevity Income ETF, particularly the LFAI fund.
While it is not a classic insurance product, it is designed to provide predictable monthly distributions over a long horizon, effectively hedging against the risk of outliving one’s assets. The fund invests primarily in U.S. Treasuries and money-market instruments, and its structure is built around the concept of a target cohort’s 100th birthday, which allows for a systematic income stream without relying on a life insurance company guarantee.
For many clients, especially those who purchased assets during low-interest periods or are seeking reliable cash flow without tying up their entire portfolio in an annuity, this product offers a compelling complement to their existing retirement income strategy. What I find particularly valuable is the transparency it provides. Unlike certain annuities, clients can clearly see the underlying investments, understand how distributions are generated, and retain the flexibility to adjust allocations as their personal circumstances or market conditions evolve.
It also fits naturally into a broader retirement strategy where a portion of assets remains growth-oriented, some is allocated to defensive income-generating investments, and a dedicated longevity-income segment addresses the specific risk of living decades beyond retirement.
Of course, it is not without considerations; while the fund aims to provide stable income, it is sensitive to interest-rate changes, inflation, and the assumptions built into its cohort-based design. Clients need to assess the fit carefully, ensuring the time horizon and income targets align with their health, lifestyle, and other holdings. For those who understand these dynamics, however, it offers a sophisticated and innovative approach to longevity planning, bridging the gap between traditional annuities and fully self-managed income portfolios, and giving retirees confidence that they can sustain their lifestyle even as they live longer than expected.
BlackRock LifePath Paycheck Fund Offers Flexibility
JP Moses, Tennessee
If you’re getting close to retirement, you might want to check out the BlackRock LifePath Paycheck fund. I’ve been following it. It works like those Canadian longevity funds, designed to give you regular monthly checks. The biggest risk is outliving your savings, and this fund has professionals handle the withdrawals so you don’t run out of money. It seems to offer more flexibility than a traditional annuity, which is worth a look.
Vanguard and Fidelity Deliver Stable Retirement Income
Evan Tunis, Florida
The Vanguard Target Retirement Income Fund is not an entirely new “longevity” product in the mold of Canada’s Purpose and Guardian funds, but it fulfills a similar role for retirees. It is intended to deliver a steady flow of income while protecting against the effects of inflation by investing in a diversified blend of stocks, bonds and cash. The Fidelity Strategic Advisers (r) Core Income Fund is also designed to provide income for retirees with a diversified approach. The two funds both provide some level of stability for those who want to keep a lid on risk and market vomit in retirement.
I’ve often been asked about newer longevity products beyond traditional annuities, especially by clients preparing for retirement who want flexibility without giving up stability. What I have observed while working with financially cautious founders and executives is that people want income structures that feel modern, transparent, and liquid, and one option in the U.S. that I genuinely find promising is the Stone Ridge LifeX Longevity Income ETFs. I first came across them while helping a client map out a long term retirement strategy, and what stood out was how these funds provide monthly distributions while still allowing investors to keep full liquidity. I remember reviewing the structure and appreciating how it focuses on Treasuries and a long horizon rather than tying someone into an insurance contract. It felt refreshing. many retirees dislike the idea of locking up money permanently, and this approach allowed them to protect their cash while still receiving consistent income. The experience reminded me of moments with founders who want efficiency without losing control, and pattern is similar
In my opinion, the biggest advantage of these longevity ETFs is the balance between predictability and freedom, since investors receive monthly payouts but can still adjust their strategy if life takes an unexpected turn. The main drawback is that there is no lifetime guarantee, so someone who ends up living much longer than expected might outlive the structure if they rely on it too heavily. I often explain that longevity planning still requires layering different tools rather than expecting one product to solve everything. Another point that came up during discussions with retirees is the sensitivity to interest rate changes, which can affect the value of the ETF itself, and it is important not to overlook that risk. Still, for clients who want something more adaptable than an annuity, this has become a strong option to consider. I also pay attention to emerging pooled longevity concepts, similar to modern tontine ideas, which share risk across participants and create higher payouts for those who live longer. Even though these structures are not mainstream in the U.S. yet, the logic is compelling for retirees who expect longer than average lifespans. Whenever I see innovation like this, I feel the same excitement I do when a founder shows us a new model at spectup because it signals that the industry is shifting toward more transparent, flexible solutions.
LifeX ETFs offer flexible, predictable Retirement Income
Sovic Chakrabarti, Vancouver, BC
When I think about longevity-focused options beyond traditional annuities, one U.S. product I genuinely find compelling is the Stone Ridge LifeX Longevity Income ETFs. What draws me to LifeX is that it tries to solve the same problem that Canadian funds like Purpose Longevity and Guardian Longevity address — steady income over an unknown lifespan — but without locking someone into an irreversible insurance contract.
Instead of handing over capital permanently, retirees stay invested and receive structured monthly distributions, which feels more flexible and respectful of changing needs. I’ve always liked the idea of having income that mimics an annuity while still keeping the door open if health, family, or market circumstances shift.
I’ve come to see LifeX as especially appealing for clients who want predictable cash flow but aren’t comfortable giving up control of their assets. Because the funds are built largely on U.S. Treasuries, the income stream feels relatively stable, and the target-date structure helps align payouts with the later stages of retirement, when longevity risk becomes more real. The liquidity alone makes it feel like a meaningful evolution in retirement planning: it’s easier to sleep at night knowing the money isn’t trapped.
Of course, I’m also realistic about its limitations. There’s no lifetime guarantee the way a true annuity offers, and the income still depends on market and interest-rate dynamics. It’s not a perfect replacement for insurance-based products. But as a complement — or even a middle ground between full guarantees and full market exposure — it’s one of the few newer U.S. longevity products I’d feel confident putting on the table for someone approaching or entering retirement.
My latest MoneySense Retired Money column looks at a curious Canadian phenomenon called The Annuity Puzzle: that while life annuities sold by insurance companies seem to have all sorts of compelling reasons to acquire them, more often that not retirees shun them.
Engen notes that experts like Finance professor Moshe Milevesky and retired actuary Fred Vettese say “converting a portion of your savings into guaranteed lifetime income is one of the smartest and most efficient ways to reduce retirement risk.” Vettese has said the math behind an annuity is “pretty compelling,” especially for those without Defined Benefit pensions.
Engen observes that a life annuity is “the cleanest version of longevity insurance … You hand over a lump sum to an insurer, and they guarantee you monthly income for life. If you live to 100, the insurer pays you. If stock markets collapse, you still get paid. If you’re 87 and never want to look at a portfolio again, the income keeps flowing.”
In other words, annuities neutralize the two big risks that haunt retirees: Longevity Risk (the chance of outliving your money) and Sequence-of-returns risk: the danger of suffering a stock-market meltdown early in Retirement and inflicting irreversible damage on a portfolio.
Despite all the seeming positives about annuities, Engen notes that “almost nobody buys one.” He cites a Vettese estimate that only about 5% of those who could buy an annuity actually do so.
A chance to lock in recent portfolio gains?
Even so, the new Retirement Club created by former Tangerine advisor Dale Roberts earlier this year — see this blog posted on this site in June — recently featured a guest speaker who extolled the virtues of annuities: Phil Barker of online annuities firm Life Annuities.com Inc. Barker said many clients tell him they’ve done really well in the markets over the last 20 years and now they’d like to lock in some of those gains. They may be looking for Fixed-Income strategies and many were delighted with GIC returns when they were a bit higher than they are now (some in the range of 5%). But they less happy with the new rates on GICs now reaching maturity. Meanwhile, annuities have just come off a 20-year high in November 2023 so the time to consider one has never been better, Barker told the Club in August. With annuities you can lock in a rate for the rest of your life so if your timing is good, it may make sense to allocate some funds to them.
See the full MoneySense column for the list of the eight life insurance companies that offer annuities in Canada, how they are covered under Assuris, when Annuities really shine, and how to fund annuities with registered or non-registered accounts.
I suspect the Club’s session on annuities was enough to get a few members off the fence. I have long been impressed by the aforementioned Fred Vettese, who often argues that those preparing to convert their RRSPs into RRIFs might opt to annuitize 20 or 30% of the amount, thereby transferring a chunk of investment risk from the do-it-yourself investor on to the shoulders of a Canadian life insurance company. Continue Reading…
The Financial Independence Retire Early (FIRE) community is a very supportive and tight-knit one. Because the community is made up of folks who have different backgrounds and different ages, it’s very diverse (not just Caucasian bros from high tech).
One thing I appreciate from the diverse FIRE community is that there are people ahead of us who are always willing to share their knowledge and help others slightly behind them on the FIRE journey.
Earlier this year, after having been financially independent for a while, Dividend Daddy decided to step away from work to pursue other passions! Since stepping away from work, Dividend Daddy has been travelling around the globe and enjoying life.
I’m happy to have Dividend Daddy joining me today on the latest Early Retirement Q&A.
Q1: Welcome back Dividend Daddy. Congratulations on reaching FIRE and stepping away from full-time employment. Can you tell us a little bit about yourself?
I’m in my late 40s and Canadian. I worked in high pressure roles for my working career and this January, I pulled the plug on full-time work. With return to office mandates clashing with my desire for work location freedom, work was no longer tenable for me so I stepped away. As of July 2025, I’ve been retired for 7 months and travelling a ton.
Tawcan: Amazing stuff!
Q2: You and I utilize hybrid investing, a combination of individual dividend stocks and low-cost ETFs. What made you decide on utilizing hybrid investing in the first place?
Replicating the Canadian stock market is super easy so I buy individual Canadian dividend stocks and get the dividend tax credit for doing so.
Internationally, in the U.S. and world, it’s very hard to do that yourself so buying an index fund like $VTI and an ETF like $XAW just makes sense.
Q3:What made you decide to finally pull the plug and step away from full-time employment? Walk me through your decision process.
It was a mix of mental burnout and circumstances at my job that led to my early retirement. Of course, I had done the “math” several times and early retirement was possible financially for me.
Being financially independent meant that I had the control to decide my future. If work arrangements no longer suited my needs, I could walk away from them. So, that’s what I did.
At this stage, I wanted time freedom more than I did the next pay cheque.
Tawcan: that makes a lot of sense. In some level I’m probably there too.
Q4: Tell me more about your plans for this new chapter of your life.
Right now, it’s all about travel. I’m doing a ton of it and I have to say, it’s great without having the stress of work or a job on your mind.
I’m not travelling with a laptop for the first time in a very long time. Just my smartphone. Being untethered from your job while travelling is so very freeing, mentally and physically. It’s wonderful.
Q5: Prior to stepping away from full-time employment, did you do a lot of soul-searching to determine what you plan to do in early retirement? Why is this an important process for early retirement?
I did do some soul-searching and planning. Nothing rigorous, trusting myself to figure it out. Some planning is important because you suddenly have many more hours in a day and week to fill.
For me, I increased the amount of pickleball I play (when I’m at home), I cycled way more at home and abroad, increased the amount of time I spend at my second home in Mexico (to avoid those nasty Canadian winters), and have been travelling a ton more.
Q6: I know you were considering doing part-time work with your previous employer. Did that ever happen? Why or why not?
I did not end up doing part-time work with my employer. Circumstances changed at my employer and that flexibility was no longer available.
I may end up doing some very limited consulting in the future but that’s not on the table for 2025 or 2026. I do miss aspects of my work.
Q7: Tell me a bit more about your portfolio withdrawal strategy. I believe you plan on withdrawing from non-registered (N) and registered (R), and leaving TFSA (T) untouched for as long as possible? Are you planning to collapse your RRSP early? Or do you envision converting RRSPs to RRIFs at some point?
Not sure completely yet on strategy but I’ve only been early retired for 7 months as of July 2025. I’m definitely spending dividends from my non-registered account with a cash reserve/bucket of $75,000.
I will reinvest most dividends from my RRSP and all of them from my TFSA. I will need to seek professional advice for what to do with my RRSP going forward and whether spending it down is advisable give tax planning purposes.
Q8: Why is it important to “learn” how to spend money and enjoy life a bit more in retirement rather than a “save-save-and-save-some-more” mentality so many FIRE seekers tend to have?
Life is short. This hits you as you approach 50 years old. My parents’ generation is starting to pass on and I know I’m next in line (hopefully a long way off still). Continue Reading…