Most of your investing life you and your adviser (if you have one) are focused on wealth accumulation. But, we tend to forget, eventually the whole idea of this long process of delayed gratification is to actually spend this money! That’s decumulation as opposed to wealth accumulation. This stage may also involve downsizing from larger homes to smaller ones or condos, moving to the country or otherwise simplifying your life and jettisoning possessions that may tie you down.
Many high-income earners struggle to max out their RRSP deduction limit each year and as a result have loads of unused RRSP contribution room from prior years.
While we can debate about whether it’s appropriate for middle and low income earners to contribute to an RRSP or a TFSA, the reality for high-earning T4 employees is that an RRSP contribution is the best way to reduce their tax burden each year.
The RRSP deduction limit is 18% of your earned income from the prior year, up to a maximum of $29,210 in 2022, plus any unused RRSP room from previous years. An employee earning $125,000 per year could contribute $22,500 annually to their RRSP. While that’s straightforward enough, coming up with $1,875 per month to max out your RRSP can be a challenge. An even greater challenge is catching up on unused RRSP room from prior years.
Let’s say you live in Ontario, earn a salary of $125,000 per year, and you want to start catching up on your unused RRSP contribution room. Your gross salary is $10,416.67 per month and you have $2,858.92 deducted from your paycheque each month for taxes, leaving you with $7,557.75 in net after-tax monthly income.
Your goal is to contribute $2,000 per month to your RRSP, or $24,000 for the year. This maxes out your annual RRSP deduction limit ($22,500), plus catches up on $1,500 of your unused RRSP contribution room from prior years. Stick to that schedule and you’ll slowly whittle away at that unused contribution room until you’ve fully maxed out your RRSP. Easy, right?
Unfortunately, you don’t have $2,000 per month in extra cash flow to contribute to your RRSP. After housing, transportation, and daily living expenses you only have about $1,200 per month available to save for retirement.
No problem.
That’s right, no problem. Here’s what you can do:
T1213 – Request To Reduce Tax Deductions at Source
Simply fill out a T1213 form (Request to Reduce Tax Deductions at Source) and indicate how much you plan to contribute to your RRSP next year. Submit it to the CRA along with proof – such as a print out showing confirmation of your automatic monthly deposits. The CRA will assess the form and send you back a letter to submit to your human resources / payroll department explaining how they should calculate the amount of tax they withhold for the year.
Note that you’ll need to fill out and submit the form every year. It’s best to do so in early November for the next calendar year so you have time for the form to be assessed and then you can begin the new year with the correct (and reduced) taxes withheld. That said, the CRA will approve letters sent throughout the year – it just makes more sense to line this up with the start of the next calendar year.
Reducing taxes withheld from your paycheque frees up more cash flow to make your RRSP contributions. It’s like getting your tax refund ahead of time instead of waiting until after you file. Let’s see how that would work using our example from Ontario.
You’ve signalled to CRA that you plan to contribute $24,000 to your RRSP next year. In CRA’s eyes, that brings your taxable income down from $125,000 to $101,000. This will make a significant difference to your monthly cash flow.
Recall that you previously had $2,858.92 in taxes deducted from your monthly paycheque. After your T1213 form was assessed and approved, the taxes withheld from your paycheque each month goes down to $1,990.67 – freeing up an extra $868.25 in monthly cash flow that was previously being withheld for taxes. That’s an extra $10,419 that you can use to crush your RRSP contributions next year. Continue Reading…
The last time I had to put a lot of effort into thinking about my finances was back when I retired in mid-2017. I had ideas of how to manage my money after retirement, but it wasn’t until a couple of years had gone by that I felt confident that my long-term plans would work for me. I had my portfolio on autopilot, and my investing spreadsheet would email me if I needed to take some action.
I was fortunate that I happened to retire into a huge bull market. I got the upside of sequence-of-returns risk. The downside risk is that stocks will plummet during your early retirement years, and your regular spending will dig deep into your portfolio. Happily for me, I got the opposite result. My family’s spending barely made a dent in the relentless rise of the stock market.
However, stock prices have become crazy, particularly in the U.S. One measure of stock priciness is Robert Shiller’s Cyclically Adjusted Price-Earnings (CAPE) ratio. In the U.S., the CAPE ratio is now just under 40. The only other time it was this high in the last 150 years was during the dot-com boom in the late 1990s and early 2000s. Just before the 1929 Black Tuesday stock market crash, the CAPE was only about 30.
Outside the U.S., prices aren’t as high, but they are still elevated. My stock portfolio’s blended CAPE is a little under 32 as I write this article. Even if stock prices were cut in half, this would just bring the CAPE close to the average level over the past century. To say that these thoughts made me think hard about whether I should change how I manage my portfolio is an understatement.
Then a question changed my thinking. If the CAPE rises to 50, or 75, or even 100, would I still want such a high stock allocation? It’s not that I expect the U.S. or much of the rest of the world’s stocks to become as overvalued as Japanese stocks in 1990, but I should be prepared for how I’d respond if they do.
At a CAPE of 50, I wouldn’t want more than about half my money in stocks, and at 100, I wouldn’t want much in stocks at all. So, even though I’m comfortable with 80% stocks at a blended CAPE of 32, something would have to change if the CAPE were to rise from 32 towards 50.
A first attempt
Once I realized I definitely would reduce my stock allocation in the face of ridiculously inflated markets, I had to work out the details. I started with some rules. First, I don’t want any sudden selloffs. For example, I don’t want to hold a large stock allocation all the way up to a blended CAPE of 39.9 and suddenly sell them all if the CAPE hits 40. A second rule was that I don’t want any CAPE-based adjustment to apply unless the CAPE is above some threshold level.
Another adjustment I made a little earlier was to reduce my expectation for future stock returns. When the current CAPE is above 20, I now assume the CAPE will drop to 20 by the end of my life. This doesn’t directly affect my portfolio’s asset allocation, but it reduces the percentage of my portfolio I can spend each year during retirement. When stocks rise and the CAPE rises, my portfolio grows, and this increases how much I can spend. But then this new rule reduces my assumed future stock returns, and reduces my safe spending percentage somewhat. Increasing stock prices still allow me to spend more, but this rule slows down the increase in my spending.
A new simpler rule for adjusting my stock allocation based on high CAPE values
I’m still happy with the way I’ve adjusted my expectation for future stock returns when the CAPE is high, but I’ve changed the way I adjust my bond allocation to the CAPE. I now have a simpler rule I named Variable Asset Allocation (VAA) that better matches my thinking about what I’d want if the CAPE got to 50 or 100.
VAA: If the CAPE is above 25, I add CAPE minus 25 (taken as a percentage) to my age-based bond allocation.
For example, without VAA my current bond allocation based on my age is about 20%. The current blended CAPE of my portfolio is about 32, so I add 32–25=7% to my bond allocation. So, I’m currently 27% in bonds and 73% in stocks.
This might not seem like much of a bond allocation adjustment in percentage terms, but it’s a bigger adjustment in dollar terms. Consider the following example. Suppose a $500,000 portfolio with a 20% bond allocation sees a jump in the CAPE from 25 to 32. This is a 28% increase in stock prices. So, we started with $100,000 in bonds and $400,000 in stocks, and the stocks jumped in value to $512,000 for a total portfolio size of $612,000. When we adjust the bond allocation to 27% in accordance with VAA, we have $165,000 in bonds and $447,000 in stocks. Of the $112,000 jump in stock value, we shifted $65,000 over to bonds, and left only $47,000 of it in stocks. Although the bond allocation went from 20% to 27%, a 35% increase, the dollar amount in bonds rose 65%. This is a substantial shift, and it leaves a healthy bond buffer if stock prices subsequently crash. Continue Reading…
Almost since the Hub’s inception in 2014, the principals behind the popular RetireEarlyLifestyle.com have provided in-depth coverage of global travel and the tips to achieve early Financial Independence they used themselves to “retire” in their early 30s.
The following email interview was between myself and Billy and Akaisha Kaderli. Our intention is to publish it on both sites. Here’s the link to their version, which ran Dec. 14th.
So without further ado:
JC Q1: Akaisha and Billy, you are about the same age as myself and my wife Ruth and apart from being American and Canadian, we appear to have several things in common: we both run sites focused on Financial Independence, have written some books on same, and continue to be working at least on our own terms even though we have achieved Findependence years ago: more than 30 in your case, seven in ours. One difference is you travel a lot more, while we are content to stay in our Toronto home near Lake Ontario and take just a few weeks abroad, preferably if it’s a business expense. So let me start with the provocative statement that I think travel is expensive and over-rated. I have no doubt you can rebut that!
A&B: First, let us clarify that the time we spend on our website is what we consider to be our volunteer time. Yes, there are products that we sell, but 99% of our information is free because we are passionate about teaching financial literacy to those who want to learn.
In regards to your comment about travel being expensive and over-rated, it depends.
We think that there are differing styles of travel. There are tourists, visitors and travelers. There is no one-right-way to journey around, and we love it that people get out and about, expanding their minds.
Tourists tend to go on vacation for a week or two, spending a good deal of money on lodging, transport, entertainment and meals. Every day must be “perfect” and if the weather doesn’t cooperate or if service is not great, then there is this sense of disappointment. They tend to go to resorts or even exotic locations, but the lodging and amenities have a sense of Disneyland unreality, and are often over-priced.
Sure, there might be a water buffalo in some rice fields, with “workers” wearing a “traditional clothing uniform” but the real locals are miles away. Tourists will pay $10 or more for a beer that the residents of the area would purchase for about a buck.
Also, Tourists might like the idea of a vacation or might not. Mostly, they like the comfort and routine of home, and a vacation is an interruption in their experience of the familiar. Many times, it borders on the feeling that “this is a waste of time. I’d rather be home.” They don’t know any local phrases in a foreign language except maybe Yes, No, Thank you, Bathroom and Beer. Tourists have more of a passive approach to their excursion and want to be entertained. Then they rate their experience with their friends when they return home.
In order to go on this vacation, they stop their mail, perhaps have a house sitter or family member/friend water their plants or watch their pet. They have probably cleaned out their refrigerator and have to stock up once again when they return home. And it all seems to be a hassle. “Would have been easier to just stay at home in the first place. Plus, now we have this credit card bill and all these souvenirs to give to friends.”
Visitors on the other hand stay in a location for a bit longer – maybe even a month or so. They know some survival phrases in the local language and choose lodging that is more middle range than a resort option. About half the time, they will eat outside of big chain restaurants with well-known names and take a chance on a local restaurant.
They are a bit more self-guided in their entertainment choices, perhaps utilizing Google maps or a local tour of the area to become familiar with their surroundings. They may select local transportation or hire a driver to go from archaeological ruins and museums or they might take a self-directed walking tour.
Using a daypack, they bring their own drinking water and perhaps some snacks to munch on as they go from place to place in their day.
Traveling for them is not necessarily a “vacation” but more of an experience, or a sabbatical. They could take cooking classes, language classes, painting courses and the like and they interact with the local people.
After their time away from home, their lives have altered in some way, perhaps expanding their perspectives or dropping an outworn routine. They look forward to their next adventure.
Then you have Travelers.
Billy and Akaisha at Chacala Beach, Nayarit, Mexico
These are the people who go from place-to-place with no itinerary other than their own style of meandering. They usually buy only one-way tickets, figuring out how to return – if they do – at another time. They communicate with the native inhabitants in their own language, purchase food, clothing and travel equipment from markets in the area and will often eat street food or dine in local restaurants.
These people travel for months, sometimes years at a time and rent apart-hotels, AirBnBs, house sit or bargain for a hotel room for a monthly rate. They may or may not have a home base for when they return from their wandering.
Travelers are more flexible mentally and are willing to have their routines interrupted. If the weather pattern is not to their liking, they might move on, or hunker down till the cold, heat, or rain stops. They do not live their traveling life as in “Today is Tuesday so it must be Belgium.” They speak with other travelers to get insight into their possible next stop.
Travelers employ digital equipment and apps to communicate with family and friends. They utilize email, sending digital photos or videos taken of their experiences, and they travel lightly. They throw their daypacks onto a bus or carry them on an affordable inter-country flight. Getting their cash in the currency of the country they are living in, they work the ATMs with a debit card that pays the withdrawal fee back.
They manage their lives online and have been receiving paperless mail for a long time. Photos are placed up in the cloud and they take care of business via Skype, WhatsApp or Signal, benefitting from medical tourism for their health care.
Travel does not cost them “more.” In fact, if they were spending their time “at home” they would still have a baseline of expenses – lodging, food, transport, entertainment for instance. But now they have incorporated these same expenses along with globe-trotting which creates memories for a lifetime and stories to share.
In general, travel has broadened their minds, giving them a unique perspective of the world and a confidence and self-reliance that pervades daily living.
We think it’s important to know one’s traveling style and enjoy who you are. There is not a one-size-fits-all, and we recognize that travel isn’t for everyone.
Someone has to stay home, attend the roses and mow the lawn!
Hub CFO Jonathan Chevreau
How does extensive travel differ from short vacations from full-time employment?
JC Q2: To clarify, we enjoy travel too; was just playing devil’s advocate. Before we switch to Findependence, do you think there’s a big difference between the expensive two-week vacations many salaried employees take, and actually renting a house or suite abroad for 3 or 4 months at a time in Semi-retirement?
A&B: Yes, there is a big difference, actually.
When one is still working, vacations are stress busters. Work hard, play hard.
These holidays tend to be results of pent up demand for luxury; things we have denied ourselves during our working life like splurging on fine meals out, visiting an exotic place far from home, a ski vacation, or a safari. Continue Reading…
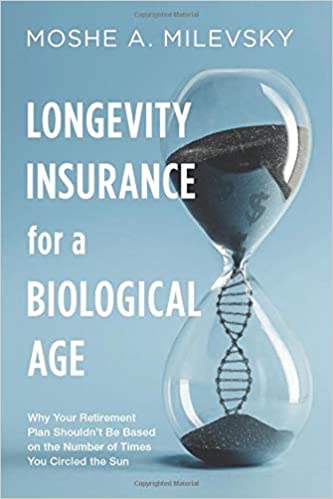
On Friday, the Hub republished the first part of a two-part Question-and-Answer session between finance professor and author Dr. Moshe Milevsky and Gordon Wiebe of The Capital Partner [TCP]. This is the second and final instalment:
TCP: I wanted to turn to your Book, Longevity Insurance for a Biological Age. Your thesis is that we should be looking at our biological age and using that to calculate and project our income and how much we should be drawing from our savings.
M.M. And, more importantly than that, making decisions in our personal finances, right?
You know, somebody is trying to figure out at what age they should take C.P.P. Should I take it at 60? 65? 70?I don’t think they should use their chronological age to do that.
Trying to figure out when to retire? Stop using your chronological age.
I mean there’s a whole host of decisions that you have to make based on age and I’m saying we’re using the wrong age metric. It should be based on your biological age.
Now, at this point, biological age sounds like this funny number that comes out of some website, but sooner or later we’ll all have it. And, it’s going to be faster than you think. Your watch will tell you your biological age. And, then in a couple of years, people will stop associating themselves with their chronological age.
They will just stop using it.
And you’re going to sit down with your antiquated compliance driven forms that say, “I need to know my client’s age. Oh, you’re 62.”
And, the client says, “Ha, ha. That’s chronological age. We don’t use that anymore, buddy. I use biological age. Sixty-two, that’s not my age.”
It’s about preparing people for the world in which age is not the number of times we circle the sun.
TCP: What metrics do you think we’ll lean towards to measure biological age? Telemeres? Others?
M.M. There’s a whole bunch of bio-markers that can be used. Some people use telomeres or something called “DNA methylation” or epigenetic clocks. There are about fifty of them, but eventually they’ll all coalesce into a number called “biological age.”
There will be a consensus on how to measure it and you’ll go to your doctor and your doctor will say, “your chronological age is 50, but your biological age is 62.” You’re doing something wrong.
Then a financial advisor will use that information differently when you build a retirement plan.
TCP: That makes sense, but trying to achieve a consensus and getting everyone to use the same metrics from a compliance standpoint or trying to get pension plans and policy makers to agree would be a challenge, wouldn’t it?
MM: It would be. In fact, that’s exactly where I’m headed now. I’m giving a speech in Madrid and that’s exactly what regulators from a number of different countries want me to talk about.
They want to know, “is this feasible? We want to implement this in our pension system. We don’t want wealthy people retiring at the age of 65, they’re going to live forever and bankrupt our system. We want people to retire at a biological age.”
TCP: Let’s talk about that a little more. Advisors typically use a 4% draw on savings as a benchmark withdrawal rate. But, if we use our biological age, there would then be a range. I assume somewhere between 3-6%?
Adjusting the 4% Rule
M.M. You’re absolutely right. That’s where I would go with this. You have to use your biological age and the 4% rule has to be adjusted.
But, what I’m saying is more than that. That rule has to change. It’s not just about the number or percentage. It’s how the rule is applied.
I really don’t like the idea of fixing a spending rate today and sticking to it for the rest of your life no matter what happens. Your spending rate has to be adaptable.
What you have to tell people is, “look, this year we can pull out 6.2%. Next year, it really depends on how markets behave. If markets go down, we may have to cut back. If markets go up, we can give you a bit more.”
I think the 4 per cent rule is really what I call a one-dimensional rule. It’s not that four is one dimensional. Any one number is one dimensional: just telling them a per cent.
It’s got to be at least two dimensional. Meaning, this is what it is now, but next year if this is what happens we’ll do that. ..
Three dimensional is to go beyond that is to go beyond that and say let’s take a look at what other income and assets you have.
“Oh! You’ve got a lot more income from guaranteed sources, you can afford more than four per cent, this year.”
TCP: It’s a dynamic scenario, a moving target.
M.M. That’s the key word, dynamic versus static.
The threat of rising Interest Rates
TCP: Canadian investors currently have over two trillion invested in mutual funds. Over half is invested in balanced funds or fixed income and we’re in a horrible position where fixed income is concerned. We’ve had declining rates for the past forty years. At best, bonds will stay flat. At worst, bonds could lose up to thirty per cent of their value.
You talk about the importance of the sequence of returns and how that affects income potential. Have you or your students run scenarios with higher interest rates and the impact it could possibly have?
M.M. I haven’t thought about it beyond what you’re noting. The obvious scenario is as interest rates move up, these things are going to take a big hit.
And, retirees who feel they’ve been playing it safe by putting funds in bonds will suddenly realize there’s nothing safe about bonds in a rising interest rate environment.
I think they’re confusing liquidity and safety with interest rate risk. It’s liquid and its safe. Government is not going to default but boy, can it lose its value.
We’ve become accustomed to this declining pattern. Anybody who is younger than forty doesn’t even understand what higher interest rates means. It’s never happened in their lifetime. They don’t believe it. Understand it. Never felt it. You show them graphs going back to the 1970s. That’s not how to convince them. They’re empiricists. They’ve never lived it themselves, they don’t believe you. Continue Reading…
I was the first investment blogger to ‘jump on’ the investment risks that might be created by the coronavirus. In fact, when I first penned on the subject in February of 2020, the virus was not then known as COVID-19. And we were not yet in a global pandemic. New cases were just starting to move around the globe, and most felt that the strange new coronavirus would be contained. Today, I can’t claim that I knew it would result in the first modern pandemic. But I did address the risk, and I did offer some thoughts on how an investor might prepare, if they needed to protect their wealth. Let’s have a look, how did the pandemic portfolio perform?
That almost goes without saying. You don’t fix a ship in a hurricane offers our friends at Mawer Investments. If you have a solid investment plan, and you are investing within your risk tolerance level —
This suggestion is controversial to some, but to me it is common sense. Fear was mounting in February of 2020, and the stock markets were offering a minor hissy fit. It is safe to say that most investors are not safe. They are investing outside of their risk tolerance level. These market scares offer the opportunity to discover that you are investing outside of your comfort level.
The timing from February of 2020 to de-risk was still quite favourable.
That would have allowed an investor to move to their risk tolerance level before the market corrected by nearly 35%. While that move to a lower risk portfolio might create lesser returns over time, it can remove the greater risk of permanent losses. Investors are known to too-often sell out in fear near the bottom of the market declines. Of course that’s the complete opposite of – buy low and sell high.
And a typical balanced portfolio would have delivered about 21% to 22% to date, from February of 2020. That’s a greater return compared to the Canadian stock market from that date.
Pandemic portfolio construction
I had suggested that investors consider two of the greater risk-off assets. Risk-off will refer to the defensive investments that protect your portfolio. And typically, investors run to these assets in times of trouble. That influx of dollars can drive up prices.
Gold is known as a safe haven asset.
Gold was the lead image on the original post on how to prepare your portfolio for the pandemic. The precious metal did shine in the pandemic, when needed.
I had suggested that investors consider U.S. long term treasuries. They punch above their weight as risk mangers (keeping an eye on those unruly stock markets.
If an investor had shaded in some gold and long term treasuries, they would have experienced some greater returns, and would have been treated to better risk-adjusted returns.
The pandemic portfolio performance
For demonstration purposes I used the asset allocation offered on the ETF Portfolio page, for a balanced model. You certainly could have (successfully) held a conservative, balanced growth or all-equity model through the pandemic. But for those with a balanced model that holds some risk-off assets, the inclusion of gold and treasuries would have helped the cause. Continue Reading…
 Many high-income earners struggle to max out their RRSP deduction limit each year and as a result have loads of unused RRSP contribution room from prior years.