Most of your investing life you and your adviser (if you have one) are focused on wealth accumulation. But, we tend to forget, eventually the whole idea of this long process of delayed gratification is to actually spend this money! That’s decumulation as opposed to wealth accumulation. This stage may also involve downsizing from larger homes to smaller ones or condos, moving to the country or otherwise simplifying your life and jettisoning possessions that may tie you down.
Close Friend: My wife and I are just a year away from being able to start our CPP benefits when we turn 60. I’m not sure if we should start them right away or wait until we’re older to get bigger benefits.
Michael James: I don’t usually get involved with giving this kind of advice about people’s specific situations, but you’re a close enough friend that I’ll try to help. Let’s go through a standard checklist of questions to help you decide.
CF: Fire away!
Do you need the money?
MJ: The first question is “Do you need the money?”
CF: Of course I need money. What kind of question is that?
MJ: Hmmm. You’re right. That question isn’t very clear. I think the idea is whether you need CPP benefits to be able to maintain your standard of living.
CF: Well, I’m retiring in a few months, and I don’t really know what standard of living I can afford.
MJ: Another good point. Let’s try to make the question more precise. If you don’t start your CPP until you’re 65 or 70, will you have less money available to spend before CPP starts than you’ll have after CPP starts?
CF: I’m not sure. My wife and I have $600,000 saved in our RRSPs that we could live on during our 60s.
MJ: That’s more than enough to live on while you wait for larger CPP benefits at 65 or 70.
CF: Okay, next question.
Life expectancy
MJ: Do you have a shorter than normal life expectancy?
CF: My dad died at 82, but my mother and both my wife’s parents are still kicking. One of my uncles died in his 60s. Maybe I should take CPP now in case that happens to me.
MJ: We can all imagine dying young, but it’s more important to make sure you don’t run out of money if you live a long life. Maybe a better way to phrase the question is “Are you willing to spend down all your savings before you turn 80 because you’re sure you won’t live that long?”
CF: No, I’m not.
MJ: So, even though you don’t know how long you’ll live, you’re going to have to use your savings sparingly in case you live a long life.
CF: Does that mean I should take CPP at 60 so that I won’t spend as much of my savings in my 60s?
MJ: No, it means the opposite. When you spend some savings in your 60s, you’re buying a larger guaranteed CPP payment that is indexed to inflation. You’re taking part of your savings that you spend over exactly 10 years and turn it into an income stream that could last for decades. By making this choice, you’ll be able to safely spend more money each month starting today.
CF: I’m starting to see a trend toward taking CPP at 70.
More money while young
MJ: Let’s see. The next question here is “Do you want more income available to spend while you’re young?”
CF: I suppose so. But can’t I just spend extra from the RRSPs during my 60s to boost my income over the next decade? Continue Reading…
When we started our financial independence journey back in 2011, we didn’t set a specific FI date or number. In our minds, we do not doubt whether we could become financially independent or not. We knew we’d become financially independent in the future. It was just a question of time. We simply needed to have patience and let our investments compound over time.
A few years into our FI journey, our FI plan started to evolve. Rather than having a specific liquid net worth and utilizing the 4% safe withdrawal rule, we decided to have enough dividend income to cover our expenses. Looking at the calendar, we randomly set a target of reaching this milestone by 2025 or earlier.
It’s funny how ten years seemed to have gone by in the blink of an eye. At the same time, a lot has happened in our lives…
Getting engaged and married
Having two kids
Moving from an apartment in Vancouver to a house in the suburb
Me having different job titles, going from engineering to project managing to product marketing to engineering
Starting my photography business ( I’ve been on a bit of break the last few years)
Starting this blog, writing articles, learning new things, and connecting with other like-minded people
One thing I’ve realized is that life is never static. It’s always dynamic. Although we can do as many projections and make as many plans as we possibly can, projections and plans do and will change. Therefore, with three years to go before 2025, I thought it would be a good time to re-examine our financial independence plans and see if we need to make any adjustments.
Our FI numbers
Since starting our FI journey, we have tracked our expenses meticulously. Here are our annual expenses since 2012:
Total Necessities
Total Annual Spending
2012
$26,210.52
$44,603.76
2013
$26,343.00
$45,260.88
2014
$29,058.96
$47,391.96
2015
$31,256.88
$47,270.16
2016
$29,831.40
$47,566.96
2017
$33,887.68
$51,144.77
2018
$31,840.75
$57,231.99
2019
$33,199.98
$54,906.02
2020
$35,511.60
$48,908.74
2021
$38,950.66
$71,852.02
Necessities cover core expenses like food, insurance, housing, clothing, utilities, car, etc. Other expenses are considered as non-core expenses which include things like dining out, skiing, camping, travel, charitable donations, gifts, etc.
The last two years have been abnormal in terms of spending. Due to the pandemic, our spending was much lower than usual in 2020. Then last year we had unplanned expenses of around $16,500 on our cat and our house. If we take this amount out, it’d put our 2021 annual spending to around $55,000.
Based on our historical spending trend, I would estimate that we need somewhere between $50,000 to $60,000 in dividend income annually to cover our expenses. To be on the safe side, I’d use $60,000 annual spending for any FI plans because we need to have inherent built-in flexibility on variables outside of our control, like major purchases, emergencies, etc.
The $60k annual spending estimate, of course, assumes that we continue to live in Vancouver and do not have many significant changes in our spending habits.
One thing to keep in mind is our spending can drastically come down if we decide to geo-arbitrage by moving to a smaller Canadian town or somewhere in South East Asia with a lower cost of living than Vancouver. On the flip side, the spending number can increase if we move to Denmark and live there for a few years (I’m ignoring the tax consequences for now).
How much do we need in our dividend portfolio?
How much do we need in our dividend portfolio to generate $60,000 in dividend income? Let’s do a quick math exercise, shall we?
For $60,000 dividend income per year, at 3% dividend yield, we’d need a dividend portfolio worth $2 million; at 4% dividend yield, we’d need a dividend portfolio worth $1.5 million. In other words, we need a portfolio valued between $1.5 million to $2 million. That’s certainly not a small chunk of change.
Now, if we take a middle-of-the-road approach and use a portfolio dividend yield of 3.5%, that means a portfolio value of around $1.714 million.
One thing is clear – we need to continue to save and invest money in our dividend portfolio. We also need to find the right mix between high-yield low-dividend growth stocks and low-yield high-dividend growth stocks.
With three years remaining in our FI timeline, it might be tempting to start buying more very-high-yield dividend stocks to make sure we can reach our FI target. But it is very important to make sure our dividend income is safe and remains sustainable over time. We definitely don’t want to hit $60,000 in dividend income one year only to see that amount slashed by 20% or more the next year.
The stability of our dividend income is extremely vital.
We also want to make sure the portfolio value continues to appreciate over time. The rationale is simple – total returns matter. Having a stable and safe dividend income and a portfolio that increases value over time will give us more options.
By 2025, both Mrs. T and I will be in our early 40s. With decades ahead of us, we need to ensure our dividend income can grow organically over time and inflation doesn’t eat into our dividend income’s buying power. It will be necessary to have some low-yield high-dividend growth stocks in our portfolio to allow for organic dividend growth.
The plan of living off dividends
Living off dividends is an amazing idea. Based on my dividend income projection, we should receive $51,000 in dividend income in 2025. However, when we compare that number with the $60,000 annual spending target, it doesn’t take a rocket scientist to realize that we are short by several thousand dollars. Continue Reading…
Panoramic view of Guanajuato City, Mexico. Photos courtesy RetirementLifestyle.com
By Akaisha Kaderli,
RetireEarlyLifestyle.com
Special to the Financial Independence Hub
Recently, the media has been covering the influx of Expats into countries such as Portugal, Thailand, Mexico, Guatemala or Panama. Apparently, this rise of foreigners relocating in these cities and towns have the locals annoyed.
On occasion we even have readers expressing concern about moving from their own country and the possible attitude of the locals that might greet them when they arrive.
Here at Lake Chapala [in Mexico], we have also seen the inpouring of Gringos over the years. For the most part this has been a good thing. However, this influx does change the culture, prices do go up, and many of these “newbies” aren’t bothering to learn any Spanish.
This lack of interest in their newly adopted home country grates on the natives.
What to do?
Learn the local language and customs
Nothing irks a native more than a blissfully ignorant Expat.
Even if all you can muster are the words for “Thank you,” “Please,” and “Good morning” – show some respect for those who have lived in an area all their lives. Make an effort to communicate with them.
There are plenty of language courses online and learning a few local phrases will pay off hugely for you.
No matter where your home country is, this newly adopted place of residence has different customs, holidays, foods and ways of celebration. If you can, embrace them. If you can’t: at least have the cultural awareness not to complain loudly and daily.
Don’t just throw money at a situation, get personally involved
Sunset in Lake Atitlan, Mexico
Expats can be known for simply throwing money at problems instead of becoming involved in a solution.
Now granted, one’s health might prevent you from lifting, bending or standing long hours doing volunteer work. However, find out what your skills are and donate them.
Whether it’s re-homing a rescue pet, teaching English as a second language, or even instructing local children in music or art, that personal contribution is remembered. More importantly, your face and personality will be remembered, and if there is ever any trouble, this is human currency in your favor.
Billy imported an electronic scoreboard for the gymnasium here in Chapala which made him an overnight hero. Then he raised money and built two more tennis courts in the city park.
Needless to say, the fruit of his work is that he is well respected and known in the community.
Please don’t bring your politics and home problems with you
THIS. IS. HUGE.
Somehow for Americans and Canadians, this idea escapes them.
Moving to a foreign country, and then immediately setting about making your new location exactly like the one you just left is simply being tone deaf.
There is no advantage to arguing with other Expats – or the locals – about problems over which you left your own home country to begin with.
Seriously.
Adapt, adjust, get a mitt and get in the game… or go back home.
Your new location isn’t “just like home only cheaper.”
Further developing the idea above, one needs to realize that your new location will never be like where you grew up.
Buying a bigger, better house, utilizing all the services of a gardener and maid, and basically living large without any contribution to the community surrounding you upsets the societal balance. It causes the locals to become resentful of your presence. They don’t like that kind of snobbery where the Expats feel as if they are better, more entitled than the ones who were born there and grew up there.
Connect. This will be your saving grace.
Realize that your presence absolutely changes the local culture.
Unbeknownst to many Expats your presence increases the locals’ cost of living. Continue Reading…
Managing a personal portfolio is always a challenge. It’s something we typically do alone (or with an advisor) and we seldom get insight into how others manage their money in retirement.
Are we doing it right? What are other people doing? What can I learn from them?
While reading various blogs is helpful (and appreciated by this writer), what if we could gain real insight into how other “real” people manage their money in retirement?
Today, we’re in luck. I recently found a fascinating study that provides some rare insight.
Real people. Real money. Real answers.
Today, a look into how people manage their money in retirement.
Managing our money in retirement is something that we typically keep to ourselves. Seldom do we get an opportunity to see what others are doing. Fortunately, JP Morgan studied 31,000 people as they prepared for and entered retirement. They compiled their findings for us in their report, “Mystery no more: Portfolio allocation, income, and spending in retirement.”
It’s a rare opportunity to compare ourselves to others, and I hope you’ll find it as interesting as I did. Below is a summary of the report, organized by major topic.
Voyeurs rejoice, it’s time to see how others are managing their money in retirement.
Asset Allocation: Dialing Down The Risk
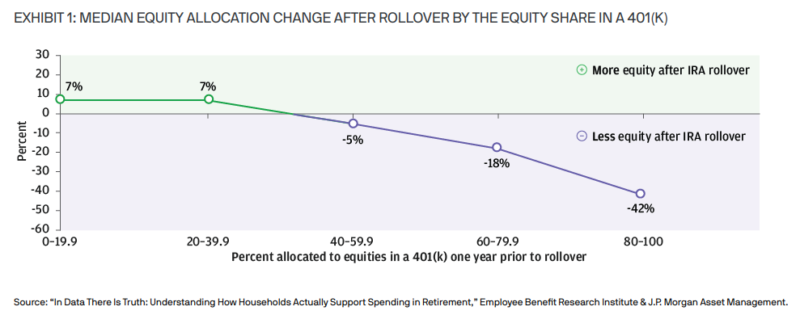
When retirees roll over their 401(k) balances, an astounding 75% reduce their exposure to equities. The median reduction is 17%, and those with a higher equity exposure tend to reduce it the most. Note in the chart below that those with an 80-100% equity exposure reduced it by 42%!
Are You Doing It Right? Reducing your risk as you approach/enter retirement is an important strategy to reduce your Sequence of Return Risk. If you have too large an exposure to stocks, you’ve likely suffered some anxiety in this year’s bear market. Moving some of that equity into lower-risk asset classes allows you to fund your retirement spending without having to sell equities after a downturn. As I’ve outlined in my posts on The Bucket Strategy, we keep 3 years of cash, and I’m sleeping just fine these days.
Using RMDs As Withdrawal Guidance
Required Minimum Withdrawals (RMDs) are established guidelines from the IRS for mandatory withdrawals from pre-tax retirement accounts starting at age 72 (Uncle Sam wants his tax revenue, after all!).
I was surprised to find that 80% of those surveyed who are younger than RMD age took no withdrawals from their retirement accounts. Meanwhile, a full 84% of those subject to RMD’s took only the minimum required withdrawal.
A better approach is to do annual withdrawals or Roth conversions prior to reaching your RMD age, using your marginal tax bracket and your safe spending rate as guidelines for how much to withdraw. It’s also important to recognize your spending will likely be higher in your earlier vs. later retirement years. You’ve saved that money to enjoy retirement, so don’t let an IRS guideline dictate how much you can safely withdraw or spend. Quoting from the study:
“The RMD approach is inefficient. It does not generate income that supports retirees’ & declining spending behavior and may leave a sizable account balance at age 100.” Continue Reading…
When should you take your Canada Pension Plan (CPP) benefits? Like many personal finance decisions, the answer depends on your unique circumstances. In general, it makes sense to defer taking CPP until age 70. The caveat is that you need to have other resources to draw from while you wait for your CPP benefits to kick in. After all, who wants to delay spending in their “go-go” retirement years just to shore up their income in their 70s and beyond?
But one question I often receive from readers and clients is when should early retirees take CPP? Here’s a reader named Keith, who decided to retire at the end of last year at age 60:
“My understanding is that since I won’t earn any income from now to 65, those five years will add to the CPP average calculation and potentially lower my eligible monthly amounts. If that’s the case, should I apply for CPP right away, or choose to defer it to 65 or 70? If I apply today, will those five years of zero income still be included in the average CPP calculation?”
It’s a great question. CPP is a contributory program based on how much you contributed (relative to the yearly maximum pensionable earnings) and how many years you contributed between ages 18 to 65.
To receive the maximum CPP benefit at age 65 you would need 39 years of maximum contributions. You can drop out your eight lowest years (more if you are eligible for the child rearing drop-out provision) from the calculation.
You can see the problem for early retirees. They’re going to have more “zero” contribution years, which will reduce the amount of their CPP benefits.
Not so fast.
You will always get more CPP by waiting, even if you’re not working.
CPP expert Doug Runchey says that your “calculated (age-65) retirement pension” may decrease if you’re not working between age 60 and 65, but the age-adjustment factor will always make up for that decrease, and then some.
“In that situation I use the expression that you will receive a larger piece of a smaller pie if you wait, but you will always get more pie,” he said.
CPP checklist for early retirees
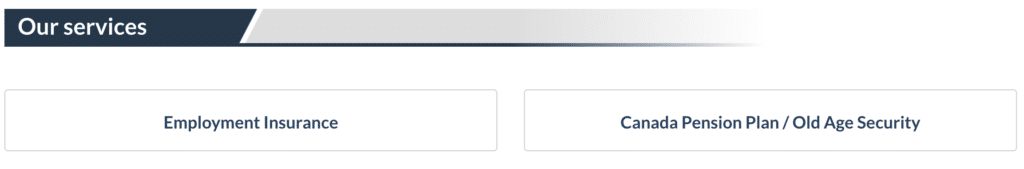
Here’s what to do if you’re in the early retirement camp and want to know when to take your CPP benefits. Log into your My Service Canada Account online and click on “Canada Pension Plan / Old Age Security.”
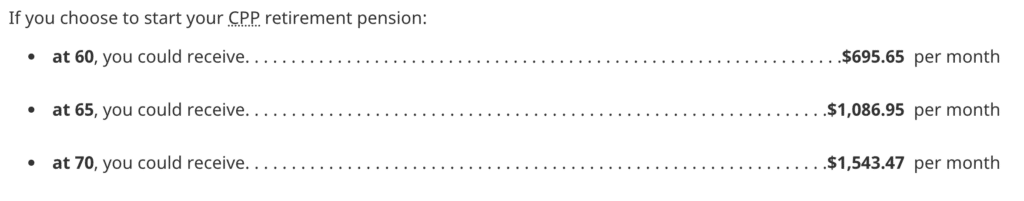
Scroll down to the “contributions” section and click on “Estimated Monthly CPP Benefits.”
You’ll see your expected CPP benefits at age 60, age 65, and age 70.
Now take that calculation and throw it in the garbage because it’s completely useless. That’s right. The CPP estimates you see here assume that you continue contributing at the same rate until age 65. That’s problematic if you plan to retire at age 58 or 60 and will no longer be contributing to CPP.
Go back to the previous screen and click on your CPP contributions. There you will find a web version* of your Statement of Contributions – a history of your contributions dating back to age 18. Right click on this page and “save as” (format: webpage, HTML only).
*Note you can request a copy of your Statement of Contributions in the mail, but you won’t need that for the next step.
Now visit www.cppcalculator.com and sign up for the website with your first name and email address. You’ll receive a confirmation email from the site founder David Field (co-created by Doug Runchey) to activate your account, followed by another email to login to the site and run your own unique CPP calculation. Continue Reading…