By Aaron Hector, RFP
Special to the Financial Independence Hub
I’m going to start this off by saying that I’ve searched high and low for an article, website, blog – anything – that backs up some of the planning concepts I’m about to share with you on the subject of Old Age Security (OAS). I couldn’t find anything, so it’s with a certain degree of hesitancy that I find myself writing this. Even though I believe the concepts are factually correct, they’re largely unproven in practice.
I’ve come to realize that the majority of writing, thinking, and media coverage surrounding government pensions like OAS and CPP (QPP in Quebec) are targeted towards households in the middle-to-upper-middle-income or net-worth range, and the planning opportunities for high-income and high-net-worth households are often overlooked. With this article, I’m going to try and change that.
I’ll start with a bit of background information.
OAS deferral enhancement: choosing your start date
The introduction, in July 2013, of deferral premiumsfor Old Age Security has given Canadians and their financial planners a lot to think about. What was once a fairly standard ‘take it or leave it’ choice at age 65 has become a more complex decision. The complexity stems from the fact that for each month you delay the payment of your OAS past the age of 65, your lifetime monthly payment will be increased by 0.6%. This enhancement is maxed out at 36% if you postpone it to age 70. Don’t overlook the planning options available to you when choosing your start date. When you do the math, there are sixty potential start dates, and sixty potential payment amounts: one for each month between ages 65 and 70.
Choosing an effective start date: immediate vs. retroactive
Here’s another wrinkle. If you apply for OAS after age 65, you can choose a start date that’s up to one year earlier than the current date on your application. So, if you’re applying in January 2020, you could choose your OAS payments to begin as early as February 2019. All payments will be based on whatever age you were as of February 2019, and you’ll be paid a retroactive lump sum for the period between February 2019 and January 2020 (or whenever your application is approved and processed). Following the lump sum, you’ll get the regular ongoing monthly OAS payments, again, which will be based on your age as of February 2019.
Another important fact is that the retroactive lump sum payment is included on your T4A (OAS) slip in the year that it’s received. So, if you apply for a retroactive start date that reaches back to a prior calendar year, it will still be income for the current year when received. This is important because it lets you shift your initial OAS income from a less desirable tax year to a more desirable tax year. This would be of value if you retired in one year (while in a high marginal tax bracket), and shifted your OAS for the first year into the following year when you’re fully retired and in a lower tax bracket.
Understanding the clawback
It makes sense that most people would dismiss OAS planning for high-income and high-net-worth Canadians. After all, OAS is famously clawed back by 15 cents for each dollar that your net income exceeds a certain annual threshold and is entirely clawed back when it reaches another. The stated clawback range on the Government of Canada’s website for 2019 income is $77,580 to $125,937. I refer to these limits as the clawback floor ($77,580) and the clawback ceiling ($125,937). For a Canadian whose income is expected to always exceed $125,937, one might conclude that there’s nothing that can be done to preserve any OAS. That would be an incorrect conclusion.
OAS secret number 1 – the clawback ceiling is NOT $125,937 for everyone
Let’s review the math of OAS clawback. OAS is eroded at a rate of 15 cents for each dollar your net income exceeds the clawback floor in any given tax year. If you started your OAS at age 65, then in 2019 you would expect to receive OAS payments which total $7,253.50 (assuming OAS is not indexed in the fourth quarter of 2019, which is yet to be confirmed). The clawback ceiling is $125,937 because with a clawback floor of $77,580 and an erosion rate of 15 cents per dollar, your $7,253.50 of OAS is fully eliminated by the time your income reaches $125,937 ($125,937 minus $77,580 = $48,357, and $48,357 x 0.15 = $7,253).
I get frustrated when I see a reference to the OAS clawback ceiling because every article or resource that I’ve seen completely ignores the deferral enhancement. Due to the method with which the OAS Recovery Tax or clawback is calculated, a more robust OAS pension will result in a higher OAS clawback ceiling. So, while the clawback floor is a fixed number which is set each year by the CRA, the clawback ceiling is not a fixed number. Rather, it’s a sliding number based on the amount of OAS that you actually receive. Sure, if you take OAS at age 65 (like most people), your clawback ceiling for 2019 is going to be the stated $125,937. But if you’re receiving higher payments due to postponing your start date, you’ll have a higher clawback ceiling. For example, if you delay your OAS to age 67, you’ll actually have a ceiling of nearly $133,000, and if you delay your OAS to age 70, your clawback ceiling will exceed $143,000.
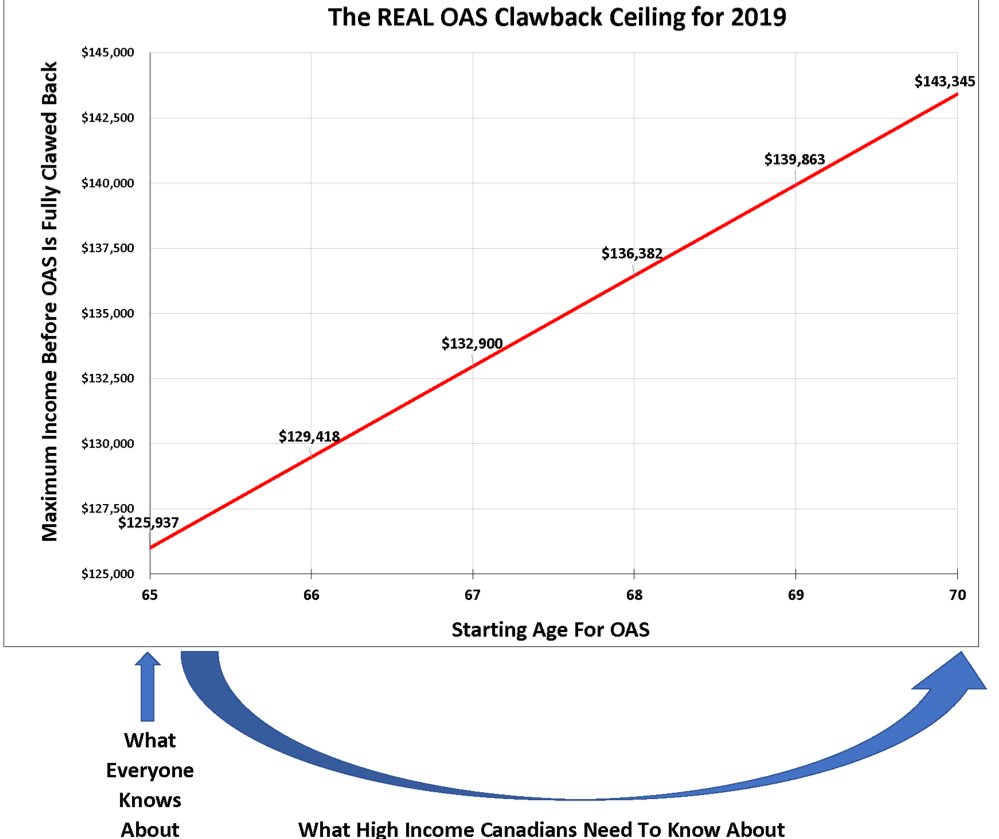
Source: Aaron Hector, Doherty & Bryant Financial Strategists
This enhanced clawback ceiling provides opportunities for some very interesting planning. Retirees who don’t expect to keep any of their OAS because they forecast that their retirement income will be in the $125,000 range might need to reconsider and potentially wait to start their OAS until 70. For others, it may be best to take OAS at age 65 because when their RRSP is converted to a RRIF, their income will exceed even the $143,000 range. Perhaps an early RRSP melt-down strategy combined with OAS postponement to age 70 will achieve the best result.
Ultimately, the right decision will depend on various individual metrics, such as your projected income in the years between ages 65 and 70, and into the future. The size of your RRSP and eventual RRIF will also be a factor, as well as your health and expected longevity (and that of your spouse, if applicable). There are truly too many factors to determine the best course for the broad population; my point here is simply that the enhanced clawback ceiling should be one factor to consider within the mix.
As an aside, the clawback ceiling is similarly lowered for those who do not qualify for a full OAS pension. This would be the case for those who have not met the full residency requirements. For example, someone who only receives half of the full OAS pension for 2019 ($3,627) will have their OAS fully clawed back when their income reaches $101,758.
OAS secret number 2 – how to create an OAS “super-ceiling”
Now that we’re all experts on OAS clawback, and we acknowledge that the OAS ceiling is not a fixed number but actually a range, we can consider some further niche planning opportunities.
For example, is there any way for someone with an expected retirement income of $150,000 per year to ever take advantage of OAS? This level of income exceeds the $143,000 upper ceiling range for someone who starts their OAS at age 70. The answer is yes. Continue Reading…
 By Ian Moyer