If you had told me a year ago that the TSX would outperform the S&P 500, I would have not believed it.
With Donald Trump openly threatening to economically punish Canada, talking up 25% tariffs, and analysts warning of a Canadian recession by mid-year, this was not what I anticipated.
And yet: here we are.
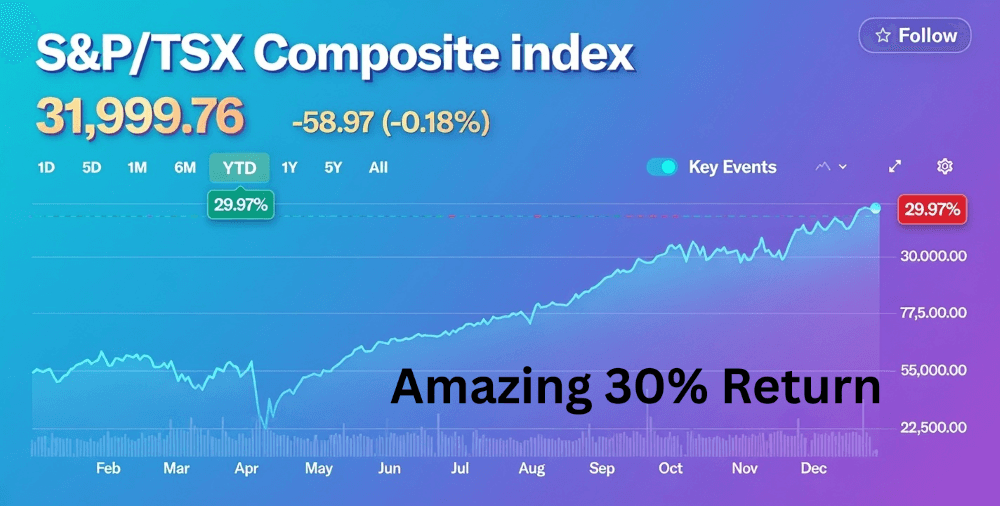
As of late December, the TSX was up 29.97% year-to-date, absolutely crushing the S&P 500’s 17.92% return. Not only that, the index pushed past 32,000 on December 22, putting it within striking distance of a historic high.
I was wrong. Plain and simple.
Why this Rally makes no sense (but still happened)
Let’s rewind to the narrative that dominated markets after the 2024 U.S. election.
Trump’s tariff rhetoric escalated quickly. Canada was singled out — again — for trade imbalances, border issues, and political leverage. Analysts warned that 25% tariffs on Canadian imports could tip Canada into recession by mid-2025.
I believed that story.
I assumed:
The TSX would suffer
Capital would flee north to south
The S&P 500 would massively outperform
Instead, the opposite happened.
By late 2025, key Canadian sectors reportedly received tariff exemptions, and the worst-case scenario never materialized. Markets, as they often do, front-ran disaster: and then ripped higher when it didn’t arrive.
Commodities Carried the TSX on their Back
This rally wasn’t broad-based magic. It was old-fashioned Canadian muscle memory.
Gold was one of the standout performers in 2025, hitting multiple all-time highs above $4,300/oz and finishing the year up over 70%
Oil rebounded, supporting energy heavyweights
Materials and resources surged, exactly where the TSX has leverage
Canada is a resource market pretending to be something else. When commodities move, the TSX moves. In 2025, they moved: hard.
That’s how you get a nearly 30% YTD gain, even while everyone is bracing for economic pain.
Meanwhile, the U.S. did Fine: Just not Amazing
To be clear: the S&P 500 didn’t disappoint. A near-18% return is nothing to complain about.
But compared to the TSX? It lost the headline.
That said, context matters.
The U.S. market closed December near 6,930, while the TSX finished around 32,039. Both are at or near record highs. The difference is what’s driving them: and what comes next.
Why I think the Tables turn in 2026
Here’s the part where I stop looking backward and start placing bets.
Based on current market levels and analyst forecasts as of late December 2025, I believe the S&P 500 is more likely to outperform the TSX in 2026.
Why?
1. Earnings Growth favors the U.S.
U.S. earnings growth is projected around 14–15%, driven by:
Massive AI investment
Fiscal stimulus (including the One Big Beautiful Bill Act)
Broader participation beyond a handful of megacap stocks
Canada, by contrast, is looking at 1–1.5% GDP growth, with earnings still heavily tied to commodity cycles.
2. AI is a U.S. Monopoly (for now)
Canada produces resources. The U.S. monetizes intelligence.
The AI boom — software, chips, cloud infrastructure — overwhelmingly benefits American companies. That’s where capital will keep flowing.
3. Trade Risk never really Disappears
Tariff risk may have eased, but it didn’t vanish. Canada remains structurally exposed to U.S. political whims in a way the U.S. market simply isn’t.
My Investment View (No Hedging here)
I don’t believe in half-measures, and I don’t dress opinions up as “balanced takes.”
If you’re investing in the U.S., I recommend putting 100% of your capital into the S&P 500. Continue Reading…
It’s challenging enough to figure out how much you’ll want to spend at the start of retirement. Even more challenging is deciding how your spending will change as you age. These choices make a big difference in how much money you’ll need to retire. They also shape the spending options you’ll have available throughout retirement. Here I explore the good and bad parts of common wisdom on retirement spending to arrive at my own spending plan for retirement.
Spoiler alert: the “go-go, slow-go, no-go” narrative is good marketing, but it has cracks.
Two extremes
Some people focus on the early part of their retirement. They want as much money as possible available early on while they’re still young enough to enjoy it. They seem to think of their older selves as a different person who they care less about than their current selves.
Others focus on their older selves and worry about running out of money at some point. These people usually spend far less than their portfolios allow, and they tend to be resistant to spreadsheet evidence that they’d be fine spending more. Some make frugality part of their value system, and others are genuinely fearful.
A rational retirement spending plan is somewhere between these two extremes. But where?
The default
Before retirement spending research over the past decade or so, the default was to assume that retiree spending would rise with inflation each year. In real (inflation-adjusted) terms, we assumed that retiree consumption would be flat over time.
This doesn’t mean that consumption would be flat in the transition from working to retirement, though. Many expenses go away in the typical retirement. Average retirees pay less income tax, have paid off their mortgages, spend less on children, and no longer have many work-related expenses like commuting and clothing. On the other hand, retirees often spend more on hobbies. Some retirees are exceptions, but retirement experts say typical retirees need 45-70% of their working income to have the same standard of living. But after retirement starts, we used to assume flat consumption over the years.
It’s tempting to think that having retirees’ spending rising with inflation would have them matching the spending increases of their younger neighbours. However, this isn’t true. Human progress causes our consumption to rise faster than inflation over the long term. Compared to a century ago, workers are far more efficient today, and they have a wide array of products and services available that people in the 1920s never dreamed of. Progress will continue, and with each passing decade, more amazing products will become available.
If you want to fully participate in our progressing economy, you would need to plan for annual retirement spending increases of about inflation+1%. It may be rational to decide you won’t need the latest iPhone or whatever amazing new product that will come along, but it’s important to realize that planning for flat consumption is already a compromise. If you were keeping up with your neighbours at the start of retirement, you would be falling behind a decade or so later.
Go-go, slow-go, no-go
Amazon.com
The idea that we should plan to spend less each year through most of retirement has some of the best marketing around. In his book, The Prosperous Retirement, Michael Stein referred to three general phases of retirement:
Go-go years: From 60-65 to 70-75. High activity and spending.
Slow-go years: From 70-75 to 80-85. Activity and spending decline.
No-go years: From 80-85 on. Minimal activity with healthcare and long-term care costs.
This framework is easy to embrace for anyone who is still a long way from the slow-go age. We’ve all seen old-timers who seem unable to do much, and more importantly, they seem very different from us. However, if you ask someone in their early 70s if they’re into their slow-go years, don’t expect a polite response.
Already, most descriptions of the three phases have the go-go years ending at 75 instead of 70-75. With so many baby boomers now in their 70s, it’s not surprising that they don’t like to see themselves as slow-go.
Setting these self-image issues aside, are these older boomers spending less than they did in their 60s? If they are spending less, some will be doing so by choice and some by necessity because they have limited savings. How significant is this group who overspent early? Do you really want to model your own retirement in part on this overspending group?
In the end this vivid narrative paints a compelling picture of someone (but not you!) slowing down and eventually stopping altogether, but it doesn’t prove anything about how you should plan your retirement.
The research
One of the early papers researching retirement spending patterns is David Blanchett’s 2014 paper Exploring the Retirement Consumption Puzzle. This paper along with many subsequent papers have established without a doubt that the average retiree’s inflation-adjusted spending declines in early retirement and increases late in retirement as health care and long-term care costs rise.
That seems to settle it, right? We should follow the research and plan for declining consumption through early retirement, and possibly plan for health spending and long-term care costs late in retirement. But there’s a disconnect. We know what average retirees do, but is this what they should have done?
The average Canadian smokes about two cigarettes per day. Does this mean we should all plan to smoke two cigarettes each day? Of course not. This average is brought up by the minority of Canadians who smoke. If we take the smokers, whose behaviour we don’t want to emulate, out of the data, the average drops to zero. In reality, the best plan is to not smoke at all.
Carrying this thinking over to retirement spending, we need to know how many retirees overspent early in retirement and now regret it. You don’t want to emulate these people. If we could remove these people from the data, the average spending from the remaining retirees might give a better picture of what you should do. In addition, we might want to remove retirees from the data if they badly underspent.
The retirement spending smile
The Blanchett paper refers to a “retirement spending smile” that is widely misunderstood. If we draw a chart of average retiree spending over time, it starts high, falls for a decade or two, and then rises again at the end of life. People refer to this chart shape as a smile. However, in Blanchett’s 2014 paper, the smile actually referred to a chart of changes in retiree spending.
So, Blanchett observed that retiree spending changes little in early retirement, then starts to decline and this decline grows in mid-retirement, then the decline slows or even reverses to spending increases late in life.
Here is a chart of Blanchett’s annual spending change data:
Notice that the points don’t really look much like a smile. The measure of how well a curve fits some data is called R-squared. Blanchett reports that his spending smile curve has about a 33% R-squared match with the data. This is a rather weak match, and is a sign that he didn’t have enough data. Another sign of too little data is the big changes over a short time. There is no obvious reason why the spending drop should be so much more at 80 than it was at 78.
What is important but unclear is how much of this data comes from overspenders and underspenders who you don’t want to emulate. Blanchett considers the question of whether retirees spend less “by choice or by need,” and admits that “it is impossible to entirely disentangle this effect.” To explore this question he divides the retiree spending data into four groups based on whether their spending is high or low and whether their net worth is high or low. He then studied each group separately. Continue Reading…
Buying your first home? Make sure you understand essential financial planning tips, from budgeting and mortgages to tax benefits, to ensure a secure future
Image by Natthawadee, Adobe Stock
By Dan Coconate
Special to Financial Independence Hub
Buying a first home can bring a sense of pride and stability that renting simply cannot match. However, this transition requires you to navigate complex financial waters to ensure long-term success.
You must approach this major purchase with a clear strategy to maintain your financial health. Here are some financial planning tips all first-time homebuyers should consider.
Budgeting for Homeownership
Homeowners must plan a strategic budget for common expenses that come with buying a home. You must look beyond the monthly mortgage payment to include property taxes and homeowners insurance. These additional costs often fluctuate and can significantly impact your monthly cash flow.
Maintenance costs also require immediate attention in your financial plan. Experts recommend setting aside one to four per cent of your home’s value annually for general upkeep.
You should also account for utility bills that often increase when moving from an apartment to a house. Heating, cooling, and water costs for a larger space quickly add up. analyzing past utility bills for the property can help you estimate these expenses accurately.
Saving for Unexpected Expenses
Unexpected repairs inevitably occur during homeownership. A dedicated emergency fund protects your finances when the water heater fails or the roof develops a leak. You avoid relying on high-interest credit cards by having liquid cash reserves ready for these specific events.
Financial setbacks can also arise from non-housing issues like job loss or medical emergencies. A robust savings account covers your mortgage payments during these difficult times. This security allows you to focus on resolving the crisis rather than worrying about potential foreclosure.
Understanding Mortgage Options
Selecting the right mortgage impacts your finances for decades to come. Fixed-rate loans offer predictable monthly payments that help you plan your long-term budget with certainty. Adjustable-rate mortgages might provide lower initial rates but carry the risk of increasing costs over time. Working with a private real estate lender is another consideration and option for homeowners. Continue Reading…
Markets rewarded Discipline in 2025: Here’s what that Means for 2026
Canva Custom Creation: Lowrie Financial
By Steve Lowrie, CFA
Special to Financial Independence Hub
As we closed out 2025, investors found themselves in the kind of environment we all hope for but rarely experience. Global Equity markets delivered exceptionally strong results. Fixed income did exactly what fixed income is supposed to do: specifically, preserve capital and reduce volatility.
From a long-term planning perspective, this is ideal. Strong returns spread across diversified portfolios create exactly the type of environment disciplined investors are positioned to benefit from.
Periods like this also highlight an important truth about investing. Strong markets reveal whether your philosophy is sound. Weak markets reveal whether you truly believe it.
This is a good time to revisit the principles that carried disciplined investors to a successful 2025.
1. What 2025 Reinforced about Sound Investing
Every year brings events that are impossible to predict. Yet the long-term evidence continues to point in the same direction.
A globally diversified portfolio remains one of the most reliable ways to build and preserve wealth.
Market leadership shifts. This year (2025) both Canadian and International equities outperformed U.S. equities.
Maintaining a rebalancing discipline once again created value by doing the opposite of what you want to do: selling what has recently done really well and buying what has lagged.
None of these outcomes required prediction. All of them required discipline.
Discipline is what keeps investors positioned to benefit when markets move higher, which is exactly what happened in 2025.
2. A Year near All-time Highs: What that means and what it does not mean
At the time of writing, many global stock markets indices are at all-time highs. This often triggers two opposite emotions.
Some investors feel relief that their plan is working. Others feel anxiety that a pullback must be around the corner.
The reality is more straightforward. Markets spend a surprising amount of time at or near all-time highs. That is what you should expect from an asset class with a positive long-term expected return.
New highs do not forecast a crash or pullback. For example, looking back at U.S. stock returns (S&P 500) for the past almost 100 years, the return 3 and 5 years after reaching an all-time was pretty much the same as all other periods. All-time highs simply confirm that staying invested has continued to work.
The right question is not “How long will this last?”
The right question is “Is my portfolio still aligned with my goals?”
If the answer is yes, the appropriate action is usually to stay the course.
3. One Thing that stood out in 2025: The Private Investment Push
Each year, one trend tends to reach a volume that’s hard to ignore. In 2025, that trend was the surge in private investments being marketed to individual investors: private equity, private credit, real estate, liquid alternatives, and farmland structures all positioned as retail-access solutions.
None of this is new. What’s new is the scale and intensity of the sales activity behind it.
This raises a straightforward question: if private investments have historically been most beneficial for large institutions, why the sudden urgency to market them to individual investors?
A few likely factors: individual investors typically accept higher fees than institutions negotiate, private structures need steady capital inflows, and strong historical performance always attracts aggressive sales, or more commonly called “distribution” using industry jargon.
Private investments aren’t inherently problematic. They can serve a purpose for the right investor under the right conditions.
However, the current surge appears driven more by sales momentum than investor need, which is usually a signal to proceed with caution.
Letting unnecessary stock market worries take hold of your investment decisions can lead to much bigger problems than just finding stocks to buy
TSInetwork.ca
Our early ancestors had to be on guard against threats in their environment. They were under constant threat. At night, if you woke to every sound from the bushes, you lost some sleep, but you cut your risk of being eaten by a lion or killed by an enemy. Today we face much less risk from animal predators and human marauders. But many people still carry this hair-trigger fear response. We spend more time than we should worrying about things that will never happen. This includes stock market worries.
That’s especially true of investors, who generally think more about the future than other people. It’s true all the more of subscribers to our newsletters and members of my Inner Circle service.
Understand stock market worries and risk so you can put everything in perspective
That’s because many of you are the kind of people who seek out investment information from a variety of written sources, where it’s much more extensive and detailed than what you get from a glance at the headlines, the evening news or cable TV. However, some of that information is biased, overblown or incorrect.
This doesn’t mean you should ignore potential threats. You just need to put them in perspective.
Learn what experienced investors do about common stock market worries
There is never a shortage of ways to ease your stock market worries. “You never go broke taking a profit,” is a favourite of brokers I’ve met over the years. They used them to spur their clients to do more trades, to boost their own commission income.
Our view now is that stocks are still a good place for your money, if you can afford to stay invested for several years. If you expect you will need to take money out of your portfolio, you should think about selling sooner than you need to.
Look beyond immediate stock market movements to help reduce your anxiety and stock market worries
Stock market trends are the general direction in which the stock market is heading. These market trends are dictated by a number of factors: what sector investors favour at the moment, economic and world news, interest rates and other trends from industries such as technology or resources, and so on. These trends could be positive or negative, and they could lead to a huge boom for a stock market. They could also lead to a big downturn.
It pays to keep in mind that the stock market anticipates changes, and no stock trend lasts forever. Stocks can go on lengthy downturns due to business and economic problems. However, the market typically starts to go back up long before the problems get solved.
We think that in general, long-term investors should be cautious optimists. Don’t let media sound bites and self-serving short-term predictions dictate your decisions when you’re investing in stocks.
Anxiety recedes with investment quality, diversification and portfolio balance
You’ll find that many of your worries concern things that are unlikely to happen; that are already largely discounted in current stock prices; and that probably won’t matter as much as you feared they would. Continue Reading…