General

Which lotteries attract the most Americans, broken down by state

By Mike Brown

Special to the Financial Independence Hub

LendEDU’s fourth annual lottery spending report analyzed the most recent U.S. Census data to see what the average American is spending on the lottery, which states spend the most, and how each state spends its yearly lottery revenue.

In the United States, the lottery offers one of the quickest routes to the American Dream; for just a few dollars, you could become a multi-millionaire in a matter of minutes.

Yet, the odds of that happening are incredibly slim, and the money spent on lottery tickets can quickly become substantial.

For the last three years, LendEDU has analyzed U.S. Census Bureau data on annual lottery spending by state to find how much the average American spends, in addition to each state’s lottery expenditure per capita.

Our fourth annual lottery spending report brings you those same statistics and some new ones. This year, we also broke down how each state spends its annual lottery revenue and what each state’s lottery expenditure per capita is as a percentage of its median household income.

Average Lottery Spending by Americans Hits Recent High

The U.S. Census Bureau releases its lottery spending data on a two-year lag, so the data that was released on January 31, 2020 reflects lottery spending data from 2018.

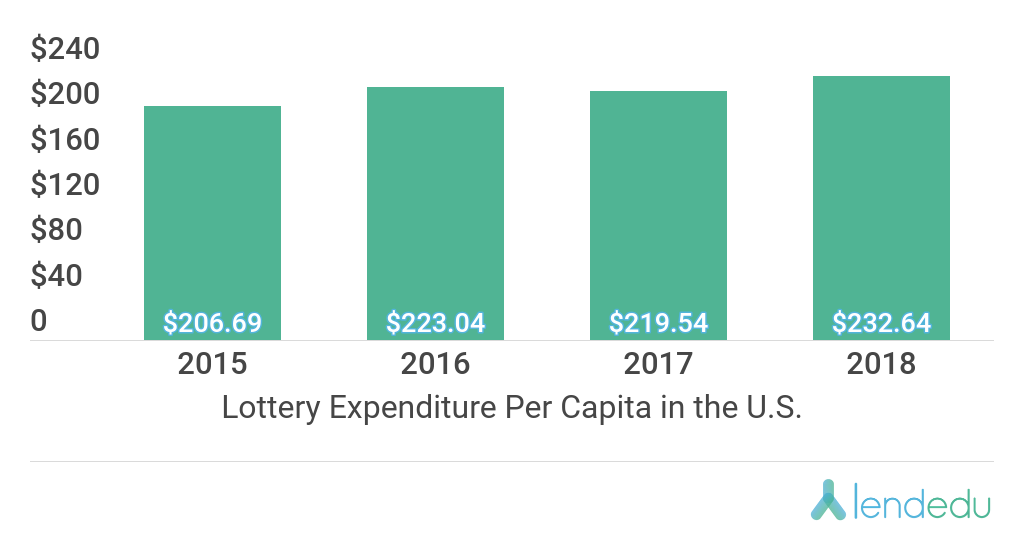
Since LendEDU started doing this report, lottery spending per capita in the U.S. hit a recent high in 2018.

In 2018, Americans spent a combined $76,362,627,000 on the lottery, while the most recent U.S. population estimate from the Census is 328,239,523.

This puts the lottery expenditure per capita in the U.S. at $232.64, which is up $13.10 compared to 2017’s figure.

Massachusetts spends the most on the Lottery

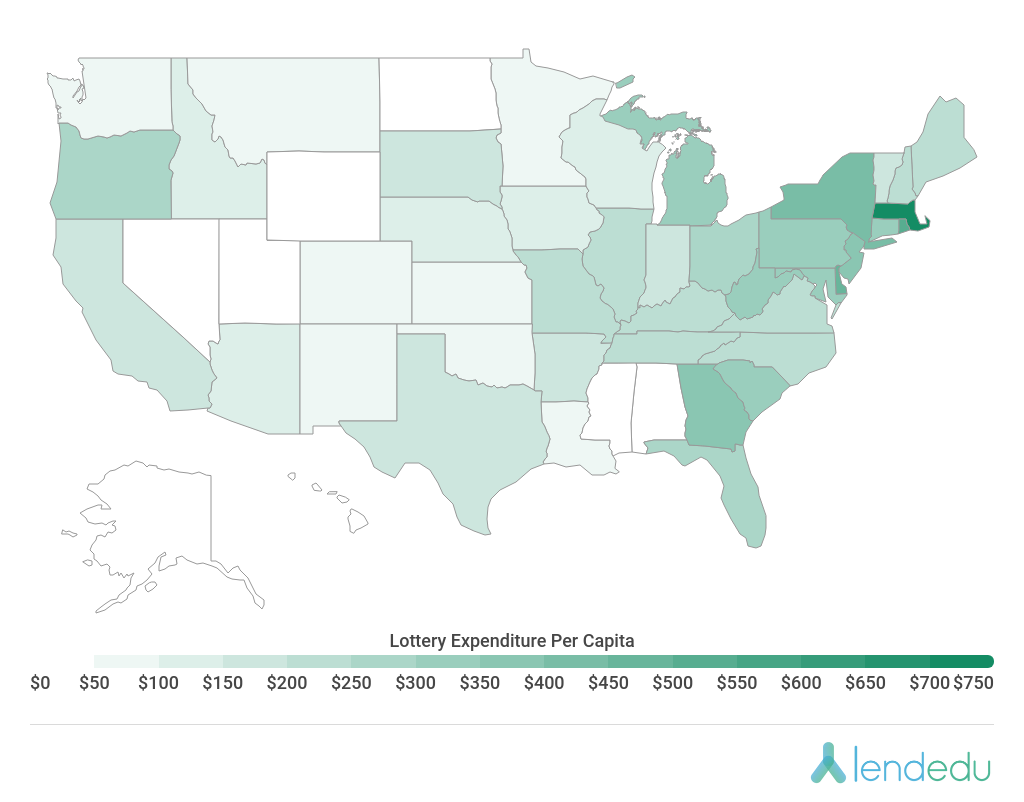
By taking each state’s total lottery expenditure from 2018 and dividing it by the most recent population estimate, we put together a map that breaks down state lottery spending per capita.

And once again, lottery players from Massachusetts spent the most on the lottery in 2018, $765.90. This figure is up from the state’s number from last year, $737.01. In comparison, North Dakota once again had the lowest expenditure per capita, going from $34.68 in 2017 to $30.32 in 2018.

For reference, six states do not offer a lottery: Alabama, Alaska, Hawaii, Mississippi, Nevada, and Utah. Washington D.C. does offer a lottery but does not report any official figures to the U.S. Census Bureau, therefore they have been excluded from this report.

State-by-State Lottery Expenditure Per Capita From 2016 to 2018

Below, you will see how each state’s lottery expenditure per capita has changed from 2016 to 2018 according to each state’s lottery revenue and population from each year. Continue Reading…

Advisor’s Alpha

By John De Goey, CFP, CIM

Special to the Financial Independence Hub

One of the great debates around the investing world revolves around the extent (if any) to which advisors add value.  Many in the media say the number is either small or negative. Many advisor cheerleaders say the number is substantial.  Everyone should be skeptical.  What follows is my unscientific assessment of the pseudo-debate (two opposing factions that have a story to spin where it is difficult to ascertain or refute either position).

The people at Vanguard have long been touting their own research (complete with quantified bandwidths for varying activities) on this topic.  Their general position is that advisors add about 3% in “value” to their clients’ portfolios.  Colour me skeptical.  To begin, it is possible to drown in a river that is, on average, only two feet deep.  Averages can be deceptive, especially when the variance in the things being measured is likely to be wide.  There is really no such thing as an average advisor or an average client.  Using the word “typical” might be a bit more accurate and helpful, but frankly, I doubt it.

There are some good advisors out there – and some lousy ones, too.  When I hear people talk about the suite of services that might be offered, the usual presumption is that all advisors are doing all those things.  That’s simply not true.  In short, almost any assessment of value added (say 3%) is likely to be truest only of the very best practitioners.  Only the very best are likely to be doing all the good things that cause advisors to score highly.  Ordinary advisors don’t do those things.  Poor advisors might very well be doing the opposite.

That’s my major beef, but there are others.  Remember that advisors are not monolithic.  They’re all over the place regarding what they do, how they do it and who they do it for.  Part of that is because their clients are all over the place, too.  Some are slothful to the point of it being difficult to get them to do anything; others are hyper-sensitive to media hype and short termism.  Good advisors provide focus and discipline, but that is difficult to reliably quantify and, at any rate, likely looks different for different clients.

Two counter-narratives

Allow me to offer two counter-narratives to the idea of (most?) advisors (consistently?) adding 3% over a long-term time horizon.  The first is the annual Dalbar study, the “Quantitative Analysis of Investor Behaviour” (QAIB).  Dalbar admits that while the study purportedly shows how investors can do unnecessary harm to their return by (among other things) chasing past performance, the people at Dalbar have no way of disaggregating causation.  Continue Reading…

Are you tax planning for you …. or for your estate?

By Aaron Hector, B.Comm., CFP, RFP, TEP

Special to the Financial Independence Hub

“In this world nothing can be said to be certain, except death and taxes.” – Benjamin Franklin

While death and taxes may be certain, the variables in and around them are certainly not. That’s why they warrant attention and planning. The following analysis provides some food for thought when deciding whether to use proactive tax planning to optimize your living net-worth or your after-tax estate.

A tisket, a tasket, a future tax basket

Most retirees have baskets of “future tax” that are just sitting there in abeyance. The most common of these tax baskets is the one that’s attached to RRSP accounts. When you contribute to your RRSP, you get a tax deduction which gives you a break on the taxes payable in that year. But when the time eventually comes to make a withdrawal, each dollar you remove from your RRSP will be fully taxable and increase your income accordingly.

Depending on the situation, there could be several other future tax baskets as well. For example, you might have unrealized capital gains that are attached to a non-registered investment account, or even an additional property. When these assets are sold in the future, the capital gain at that time will be subject to taxation.

Our tax system is progressive, which means the tax rates continue to increase as your income does, thus moving you from a lower tax bracket to a higher one. When you die (without a surviving spouse), all of the remaining tax baskets are dealt with at that time. This often results in a significant amount of taxable income that’s exposed to the highest marginal tax rates which can exceed 50%, depending on your province of residency.

Managing future tax

What can be done to manage this future tax in a way that avoids exposure to such high tax rates? One popular approach is to look at your projected retirement income and identify when in the future there might be years where income is lower than average or higher than average, and then try and shift income away from the high years to fill in the low years. This “tax averaging” often results in an acceleration of income in earlier years, which then lowers the exposure to high tax rates later in life or upon death.

If you think this sounds challenging, remember that any financial planner worth their salt should be able to review your assets and liabilities, then map out your projected income going forward on a year-by-year basis. The low-income years most commonly occur immediately following retirement; the paycheque has stopped, but maybe you have ample cash and non-registered savings that can be used to fund your lifestyle. It’s quite possible that the income you would report on your tax return in these years would be minimal. However, by the end of the year that you turn 71 your RRSP accounts must be converted into RRIF accounts, giving rise to forced annual withdrawals that are fully taxable. These mandatory withdrawals might mark the beginning of your high-income retirement years and may even result in your Old Age Security (OAS) being clawed back. That being said, it really depends on one’s individual circumstances.

The nice thing about the future tax is that, for the most part, you have flexibility in deciding when you convert that future tax into current tax. Just because you can wait until age 72, when you are forced to make your first withdrawal from your RRSP (RRIF), doesn’t mean that you must wait until you are 72. Furthermore, this doesn’t need to be a cash flow decision. If you don’t need the money to fund your lifestyle, then you can simply take the money that is withdrawn from the RRSP and then (subject to withholding taxes) reinvest it back into another account such as your TFSA or non-registered account. The point here is that you have the option of choosing what you believe to be an optimal year to increase the amount of income that will be reported on your tax return.

Similarly, you can choose to trigger a capital gain within a non-registered account at any time. A sale of a stock doesn’t need to be an investment decision – it can be a tax decision. Simply sell the stock, thereby triggering the capital gain, and then immediately rebuy it. The capital gain will then be reported on your tax return in the year it was sold, and your taxable income will be increased accordingly.

In a nutshell, every dollar of income that you accelerate is a dollar of income that you don’t have to report in the future, and you get to choose what tax rates get applied to that dollar; the current marginal rate, or the future marginal rate (which could be higher). It’s easy to see how this process can result in your paying a lower average lifetime tax rate.

How to impact your lifetime assets and estate

Let’s dig a bit deeper. How do these choices carry forward and impact your lifetime assets and ultimately your estate? I’ll begin with some foundational ideas and then provide a real-life example.

Imagine a scenario where your current marginal tax rate is 30% while living, but if you died then the marginal tax rate on your final tax return would be 50%. Continue Reading…

We can no longer ignore our Financial Health

By Tanya Oliva

Special to the Financial Independence Hub

Prior to the pandemic, the financial health of Canadians was of great concern to the Bank of Canada, who often cited the record level of household debt as a serious threat to our economy. In 2019, the average Canadian household was carrying $1.76 in debt for every $1.00 of disposable income.

Other statistics related to the financial health of the average working Canadian were just as alarming: 52% were living pay-cheque to pay-cheque, 44% say it would be difficult to meet financial obligations if their pay was late, 40% were overwhelmed by their level of debt, and 48% were losing sleep because of financial worries.

We all know now that the COVID-19 Pandemic of 2020 is the gravest economic and financial shock anyone could have imagined. With no time to prepare, millions of Canadians and countless businesses are facing extreme financial stress and a global economic recession has taken hold. Now, more than ever, Canadians must focus on their financial health.

We need to think of health as a three-legged stool

Our overall health is connected on three levels: physical health, mental health, and our financial health. Financial challenges and difficulties are experienced by individuals across all income levels and age groups. Financial stress is the most obvious symptom and proves that financial health is strongly linked to our mental health.

Poor financial health can lead to more serious mental health issues such as anxiety and depression and can also negatively impact our physical health, from fatigue, poor nutrition, to substance abuse and dangerous conditions like high-blood pressure and heart disease.

A state of being in good financial health is when an individual:

  1. has control over their day-to-day, month-to-month expenses,
  2. has the capacity to absorb a financial shock,
  3. is on track to meet financial goals – short, medium and long term, and
  4. has the financial ability to make choices that allow them to enjoy life and seize opportunity.

Just like our physical and mental health, we need to put in the time, effort and commitment, and apply proven strategies, to maintain and improve our financial health. The Financial Health Network has created a measure of financial health called the FinHealth Score™.  An individual’s score is based on four financial behaviours: how you Spend, Save, Borrow and Plan for the unexpected and your future.  Your overall score will change with your circumstances and ranges on a spectrum from financially healthy to financially coping to financially vulnerable. Continue Reading…

Book Review: Mary Trump’s entertaining read on Uncle Donnie

There seems to be no end to the number of books devoted to America’s flawed president but certainly the two dominant ones this summer have been John Bolton’s The Room Where it Happened and now Mary Trump’s Too Much and Never Enough.

Bolton’s book topped the New York Times best-seller list last time I looked but I expect it will be knocked off shortly by Mary Trump’s intimate portrait of her uncle’s early days, and how his character and outlook has never really changed. Mary Trump’s book sold 950,000 copies within days of its release and should be nicely past a million by the time you read this.

I have copies of both books but confess to having given up on Bolton’s long snoozer once Mary’s much shorter and more entertaining book came out. Mary’s is just over 250 pages. Both books have been extensively reviewed since their release and of course the White House’s attempt to block publication of them and muzzle their authors only ended up backfiring and turning both books into bestsellers.

In Bolton’s case, I found the numerous reviews sufficient to get the gist of what he was saying: the book is just too pedantic and self-serving to tolerate unfiltered.

Mary’s book, on the other hand, is a compelling fast read, as you’d expect a book would be when written by someone actually in the Trump family. If indeed she believes Uncle Donnie is the world’s most dangerous man, then she’s a brave lady, as she demonstrated last Friday evening on CNN, when she ably rebutted Trump’s belated attempts on Twitter to discredit her.

I think most readers can safely disregard White House flack Kayleigh McEnany’s blanket dismissal of the book as “a pack of lies,” given that she also confessed at the same time she hadn’t read the book.

Perhaps Mary focuses too much on the early days of her father (Fred Junior) and his early death by alcoholism, largely caused by some abominable treatment by his younger brother (Donald) and their father, Fred Senior. But an understanding of this relationship is crucial to the book’s thesis, given that Mary notes near the end that “Vladimir Putin, Kim Jong-un, and Mitch McConnell, all … bear more than a passing psychological resemblance to Fred.”

I found the book more compelling the further you get into it. The last few chapters are especially insightful and pretty damning, judging by the extent to which I underlined it.  Below are a few examples:

Protected from his many failures

Author Mary Trump

The last full Chapter (14, A Civil Servant in Public Housing) starts with an idea I’ve not seen discussed elsewhere, as Mary sees parallel “through lines” from the House where the Trump family was raised to Trump Tower to the West Wing; and from Trump Management to the Trump Organization to the Oval Office. The first reveals a progression of controlled environments that took care of Donald’s material needs, while the second constituted “a series of sinecures in which the work was done by others and Donald never needed to acquire expertise in order to attain or retain power …. All of this has protected Donald from his own failures while allowing him to believe himself a success.”

Also intriguing is the interpretation that — far from Donald  taking advantage of others, which he certainly did — “there was a line of people willing to take advantage of him.” This started with the New York tabloid press in the 1980s, which “discovered that Donald couldn’t distinguish between mockery and flattery and used his shamelessness to sell papers.”

By 2004, Donald’s finances were “a mess,” Mary writes, at which time his “empire” consisted of “increasingly desperate branding opportunities such as Trump Steaks, Trump Vodka, and Trump University.” And this made him an easy target for Mark Burnett, who saved his career by convincing Trump to be the star of the reality TV show, The Apprentice, where he played the part of the successful businessman he wasn’t in reality.

She also recounts the many times his father bailed him out, including at least one of his failing casinos (It seems the House always wins, unless Donald Trump owns it). As she notes:

“Nobody has failed upward as consistently and spectacularly as the ostensible leader of the shrinking free world.”

In short, Mary concludes, her uncle “was neither self-made nor a good dealmaker … His real skills (self-aggrandizement, lying, and sleight of hand) were interpreted as strengths unique to his brand of success.”

Mary’s credentials as a psychologist also make her observations relevant, such as this shocking sentence:

“Donald today is much as he was at three years old: incapable of growing, learning, or evolving, unable to regulate his emotions, moderate his responses, or take in and synthesize information.”

The stress of distracting from his vast ignorance

While his fundamental nature hasn’t changed, he has experienced more stress since taking on the presidency. However, she explains: Continue Reading…