General

Risk, Return & the Essence of Adding Value

Image courtesy Outcome/Shutterstock

By Noah Solomon

Special to Financial Independence Hub

This month, I explore how the relationship between risk and return forms the bedrock of sound (or poor) investment results. I will also demonstrate why the management of these two elements constitutes the essence of adding or destroying value for investors. Lastly, (reader beware), I include a rant about investor complacency and the detrimental effects it can have on one’s wealth.

Good is Not the Enemy of Great: It is Great

David VanBenschoten was the head of the General Mills pension fund. In each of his 14 years in this role, the fund’s return had never ranked above the 27th percentile or below the 47th percentile.

Using simple math, one might assume that over the entire period the fund would have stood in the 37th percentile, which is the midpoint of its lowest and highest ranks. However, despite never knocking the lights out in any given year, VanBenschoten managed to achieve top-tier results over the entire period. By consistently attaining 2nd quartile performance in each and every year, over the 14-year period the fund achieved an enviable 4th percentile ranking.

The Hippocratic Oath and Investing

The seemingly irreconcilable difference between the average of VanBenschoten’s rankings and his overall rank over the whole 14-year period stems as much from the performance of other funds as from his own results.

To achieve outstanding performance, one must deviate from the crowd. However, doing so is a proverbial double-edged sword, as it can lead to vastly superior or inferior results. The preceding rankings indicate that most of the managers who were at the top of the pack in some years also had a commensurate tendency to be near the bottom in others, thereby tarnishing their overall rankings over the entire period.

In contrast, the General Mills pension fund, by being consistently warm rather than intermittently hot or cold, managed to outperform most of its peers. Managers who aim for top decile performance often end up shooting themselves in the foot. The moral of the story is that when it comes to producing superior results over the long term, consistently avoiding underperformance tends to be more important than occasionally achieving outperformance. In this vein, managers should take the physicians’ Hippocratic Oath and pledge to “first do no harm.”

Robbing Peter to Pay Paul: The Bright and Dark Sides of Asymmetry

The Latin term Sine Que Non describes an action that is essential and indispensable. In the world of investing, the ability to produce asymmetrical results meets this definition. It is the ultimate determinant of skill.

A manager who delivers twice the returns of their benchmark but has also experienced twice the volatility neither creates nor destroys value. They have simply robbed Peter (higher volatility) to pay Paul (commensurately higher returns). Since markets tend to go up over time, clients may marvel at the manager’s superior long-term returns. However, this does not change the fact that no value has been created – clients have merely paid in full for higher returns in the form of higher volatility.

If this same manager delivered 1.5 times the benchmark returns while experiencing twice the volatility, not only would they have failed to add value but would have destroyed it – they would have simply robbed Peter by exposing him to higher volatility while paying Paul less in the form of excess returns. In contrast, if the manager had produced twice the returns of the benchmark while experiencing only 1.5 times its volatility, then they deserve a firm pat on the back. They would have achieved asymmetrically positive results by paying Paul far more in outperformance than what they stole from Peter in higher volatility.

The Efficient Market Hypothesis: Why bother?

The efficient-market hypothesis (EMH) states that asset prices reflect all available information, causing securities to always be priced correctly and making markets efficient. By extension, the EMH asserts that you cannot achieve higher returns without assuming a commensurate amount of incremental risk, nor can you reduce risk without sacrificing a commensurate amount of return. It argues that it is impossible to consistently “beat the market” on a risk-adjusted basis. When applied to the decision to hire an active manager rather than a passive index fund, the EMH can be neatly summarized as “why bother?”

Continue Reading…

Misleading Retirement Study?

Ben Carlson, A Wealth of Common Sense

By Michael J. Wiener

Special to Financial Independence Hub


Ben Carlson says You Probably Need Less Money Than You Think for Retirement.  His “favorite research on this topic comes from an Employee Benefit Research Institute study in 2018 that analyzed the spending habits of retirees during their first two decades of retirement.”  Unfortunately, this study’s results aren’t what they appear to be.

The study results

Here are the main conclusions from this study:

  • Individuals with less than $200,000 in non-housing assets immediately before retirement had spent down (at the median) about one-quarter of their assets.
  • Those with between $200,000 and $500,000 immediately before retirement had spent down 27.2 percent.
  • Retirees with at least $500,000 immediately before retirement had spent down only 11.8 percent within the first 20 years of retirement at the median.
  • About one-third of all sampled retirees had increased their assets over the first 18 years of retirement.

The natural conclusion from these results is that retirees aren’t spending enough, or that they oversaved before retirement.  However, reading these results left me with some questions.  Fortunately, the study’s author answered them clearly.

At what moment do we consider someone to be retired?

People’s lives are messy.  Couples don’t always retire at the same time, and some people continue to earn money after leaving their long-term careers.  This study measures retirement spending relative to the assets people have at the moment they retire.  Choosing this moment can make a big difference in measuring spending rates.

From the study:

Definition of Retirement: A primary worker is identified for each household. For couples, the spouse with higher Social Security earnings is the assigned primary worker as he/she has higher average lifetime earnings. Self-reported retirement (month and year) for the primary worker in 2014 (latest survey) is used as the retirement (month and year) for the household.

There is a lot to unpack here.  Let’s begin with the “self-reported retirement” date.  People who leave their long-term careers tend to think of themselves as retired, even if they continue to earn money in some way.  Depending on how much they continue to earn, it is reasonable for their retirement savings either to decline slowly or even increase until they stop earning money.  What first looks like underspending turns out to be reasonable in the sense of seeking smooth consumption over the years.

The next thing to look at is couples who retire at different times.  Consider the hypothetical couple Jim and Kate.  Jim is 6 years older than Kate, and he is deemed to be the “primary worker” according to this study’s definition.  Years ago, Jim left his insurance career and declared himself retired, but he built and repaired fences part time for 12 more years.  Kate worked for 8 years after Jim’s initial retirement.

Their investments rose from $250,000 to $450,000 over those first 8 years of retirement, declined to $400,000 twelve years after retirement, and returned to $250,000 after 18 years.  Given the lifestyle Jim and Kate are living, this $250,000 amount is about right to cover their remaining years.  Although Jim and Kate have no problem spending their money sensibly, they and others like them skew the study’s results to make it seem like retirees don’t spend enough.

What is included in non-housing assets?

From the study:

Definition of Non-Housing Assets: Non-housing assets include any real estate other than primary residence; net value of vehicles owned; individual retirement accounts (IRAs), stocks and mutual funds, checking, savings and money market accounts, certificates of deposit (CDs), government savings bonds, Treasury bills, bonds and bond funds; and any other source of wealth minus all debt (such as consumer loans).

So cottages and winter homes count as non-housing assets.  This means that a large fraction of many people’s assets is a property that tends to appreciate in value.  Even if they spend down other assets, the rising property value will make it seem like they’re not spending enough.  It is perfectly reasonable for people to prefer to keep their cottages and winter homes rather than sell them and spend the money. Continue Reading…

Should you have 100% of your portfolio in stocks?

The 100% equity ETFs from iShares and Vanguard/Canadian Portfolio Manager

By Mark Seed, myownadvisor

Special to Financial Independence Hub

A reader recently asked me the following based on reading a few pages on my site:

Mark, does it make sense to have 100% of your portfolio in stocks? If so, at what age would you personally dial-back to own more cash or GICs or bonds? Thanks for your answer.

Great question. Love it. Let’s unpack that for us. 

References:

My Dividends page.

My ETFs page.

Should you have 100% of your portfolio in stocks?

Maybe as a younger investor, you should.

Let me explain.

Members of Gen Z, which now includes the youngest adults able to invest (born in the late-1990s and early-2000s), represent a cohort that could be investing in the stock market for another 60 more years. 

According to a chart I found on Ben Carlson’s site about stuff that might happen in 2023, over 60+ investing years in the S&P 500 (as an example) historical indexing performance would suggest you’d have a better chance of earning 20% returns or more in any given year than suffering an indexing loss. Pretty wild.

S&P 500 - 100 stocks

Source: A Wealth of Common Sense. 

Shown another way as of early 2023:

S&P 500 Returns Updated

Source: https://www.slickcharts.com

This implies younger investors, in my opinion, should at least consider going all-in on equities to take advantage of long-term stock market return power when they are younger given:

  1. As you age, your human capital diminishes – your portfolio (beyond your home?) can become your greatest asset.
  2. Younger investors can also benefit from asset accumulation from periodic price corrections – adding more assets in a bear market; allowing assets to further compound at lower prices when corrections or crashes occur (i.e., buying stocks on sale).

Consider in this post on my site:

In the U.S.:

  • a market correction occurs at least once every 2 years, of 10% or more
  • a bear market at least every 7 years, where market value is down 20% or more
  • a major market crash at least every decade.

And in Canada for additional context:

The C.D. Howe Institute’s Business Cycle Council has created a classification system for recessions, grouping them together by category.

According to the council: Continue Reading…

Despite recession fears & inflation, DB pension health improving: Mercer

Things appear to be looking up for members of Defined Benefit [DB] pension plans in Canada, despite inflation and rising fears of a looming recession.

In the third quarter, Canadian defined benefit (DB) pension plans continued to improve, according to the Mercer Pension Health Pulse (MPHP), released on Monday.

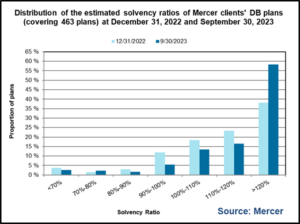
The MPHP, which tracks the median solvency ratio of DB pension plans in Mercer’s pension database, finished the third quarter at 125%, up from 119% last quarter. At the beginning of the year, the MPHP was at 113%, as shown in the chart above left.

This strengthening appears somewhat counterintuitive, as pension fund asset returns were mostly negative in the quarter, Mercer said in a news release. Over the quarter, bond yields increased, which decreases DB liabilities.  This decrease, along with a fall in the estimated cost of buying annuities, “more than offset the effect of negative asset returns, leading to stronger overall funded positions.”

Plans that use leverage in the fixed-income component of their assets will not have seen this type of improvement, it added.

Of plans in its database, at the end of the third quarter 88% were estimated by Mercer to be in surplus positions on a solvency basis (vs. 85% at the end of Q2). About 5% are estimated to have solvency ratios between 90% and 100%, 2% have solvency ratios between 80% and 90%, and 5% are estimated to have solvency ratios less than 80%.

Ben Ukonga

“2023 so far has been good for DB pension plans’ financial positions,” said Ben Ukonga, Principal and leader of Mercer’s Wealth practice in Calgary [pictured on right],” “However, as we enter the fourth quarter, will the good news continue to the end of the year?”

The global economy is still on shaky grounds, Mercer says.  “A recession is not completely off the table, despite continued low unemployment rates. Inflation remains high, potentially back on the rise, and outside central banks’ target ranges.”

Geopolitical tensions also remain high, reducing global trade and trust and fragmenting global supply chains – which further reduces global trade. And the war in Ukraine “shows no sign of ending – adding economic uncertainty atop a geo-political and humanitarian crisis.”

Mercer also questions whether recent labour disruptions at U.S. auto manufacturers will be resolved quickly, with Canadian workers expecting large wage increases, leading to further inflationary pressures.

Interest rates may stay at high levels

Mercer also worries that central banks globally may continue to keep benchmark interest rates at elevated levels.

 “Given the delayed effect of the impact of interest rate changes on economies, care will be needed by central banks to ensure their adjustments (and quantitative tightening) do not tip the global economy into a deep recession, as the full effects of these actions will not be known immediately. As many market observers now believe, the amount of quantitative easing during the COVID-19 pandemic was more than was needed.”

Most Canadian DB pensions are in favourable financial positions, with many plans in surplus positions, the release says: “Sponsors who filed 2022 year-end valuations will have locked in their contribution requirements for the next few years, with many being in contribution holiday territory (for the first time in a long time).”

That said, it added, DB plan sponsors should not be complacent: “Markets can be volatile, and given that plans are in surplus positions, now more than ever is the time for action, such as de-risking, pension risk transfers, etc. These actions can now be done at little or no cost to the sponsor.”

Mercer also said DB plan sponsors should “remain cognizant of the passing of Bill C-228, which grants pension plan deficits super priority over other secured creditors during bankruptcy and insolvency proceedings.”   Continue Reading…