By Bipan Rai, Managing Director, BMO Global Asset Management
(Sponsor Blog)
The end of the year is a special time. The slowing modulation of the markets gives many an analyst time to unplug, which inevitably leads to reflection about what the next year will bring. And as ideas begin to take shape, convictions start to form and a general sense of where the market is headed is reached.
It is almost always a humbling exercise.
For instance, just consider a subset of the important macro/market events from 2025:
- The repeated rounds of tariffs and counter-tariffs between the U.S. and its largest trading partners (Canada/Mexico/China/EU).
- A massive sell-off in the spring that took the S&P 500 into bear market territory.
- The U.S. toying with the idea of raising taxes on foreign investors (Section 899).
- Inflation remaining above target across many jurisdictions for most of the year.
- Israel and Iran exchanging strikes: with the U.S. also getting involved by attacking Iranian nuclear sites.
- Repeated attacks by the U.S. president on the sitting Fed chair, with the president openly admitting that he’d like to fire the chair and replace him with someone who is more aligned to his views.
- The U.S. president attempting to remove a sitting Fed board member.
- The longest U.S. government shutdown in history.
- Market concentration remaining high with AI tiptoeing further into ‘bubble’ territory.
If, at the end of 2024, you had given us the above observations for 2025 there is little chance we would have expected U.S. equities to return 15-16% that year. We would have probably gotten the direction on gold right, but almost certainly whiffed on the magnitude of gains (at around 60%).
That is why we are going into this exercise clear-eyed and with a sense of trepidation (and maybe a bit of dread). What we can say is, given the current set-up the below trades are best positioned to serve our readers well as they look to calibrate for 2026. Please note, this is a very different exercise than our portfolio strategy (which will be out later in the new year). Instead of constructing a portfolio tailored for a particular investing approach, we are selecting ETF trades that we feel will outperform given the available information on the macro that we have on hand now.
First, some basic assumptions:
- We expect the U.S. economy to grow at trend (1.8-2.0%1) in 2026 with inflation remaining above the 2% target for the year. Additionally, the labour sector should remain under some modest pressure, which leads the Federal Reserve to cut interest rates 1-2 more times in 25 basis-point (bps) increments.
- For Canada, growth is likely to slow from this past year and settle at around 1.4-1.5%. That is still slightly below potential, which implies that inflationary pressures should remain contained. The Bank of Canada (BoC) is likely done easing for now and talks of rate hikes in late 2026 still feel premature.
- We expect the S&P 500 to rally by about 8-10% in 2026.
- We expect a consolidative environment for CAD and U.S. yields to start the year, which should give way to upside as the year progresses.
- We see downside risks to USD/CAD2 over the next three months.
With that out of the way, let’s get started.
Theme #1: Late-cycle dynamics still favour Quality …
Into 2026, we’d characterize the backdrop for the U.S. economy as one that favours resilience over cyclicality. That is not least given that the current phase of economic expansion feels a bit long in the tooth and the combination of fiscal and monetary measures might lead to an economy that runs hot (i.e., higher prices, moderate growth). In such an environment, we expect investors to prioritize companies with strong balance sheets and stable earnings: important ‘Quality’ characteristics.
Top trades for this theme:
Chart 1 – Average monthly returns for months when Core CPI is > 2%3
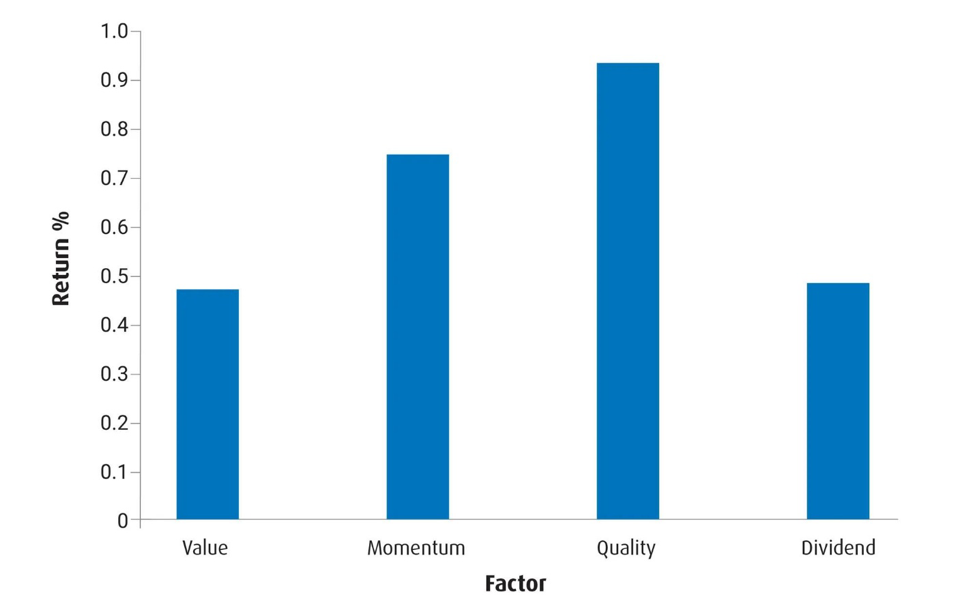 Source: BMO Global Asset Management / MSCI. For U.S. factors; observations go back by 14 years.
Theme #2: … But with broader leadership …
Much of 2025 was characterized by a migration of flows out of the U.S. and into EAFE and EM markets.4 Given the strength and stability of earnings outside of North America, we expect this theme to continue into 2026.
Aside from valuation (see Chart 2), two other catalysts for this resiliency will be the widespread adoption of new technologies in non-U.S. markets, and fiscal expansion in many countries. Both should work together to improve productivity trends outside of the U.S.
In the emerging world, we see the alignment of different themes working together to attract additional capital to these regions. Indeed, commodity exporters in Latam5 should continue to benefit from rising prices, while an improving backdrop in China should boost activity in smaller Asian markets.
Top trades for this theme:
Chart 2 – Several international markets still look cheap relative to the U.S.
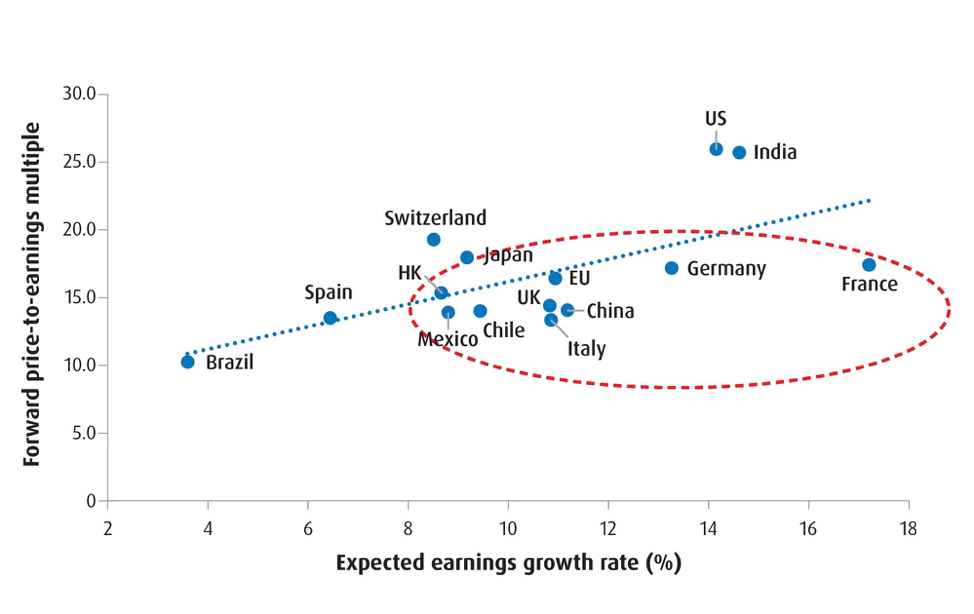 Source: BMO Global Asset Management / MSCI. A forward price-to-earnings ratio (Fwd P/E) is a stock valuation metric that compares a company or stock index’s current share value to estimated future earnings over the next 12 months.
Theme #3: … And a rotation away from AI
The delicate rotation away from AI/Tech and into other sectors should continue and will likely engender further uncertainty. However, greater adoption of technology outside of Tech/Communications sectors will likely shift capital over to cheaper segments of the U.S. market.
Within the Tech/Communications sectors, we feel active strategies will be better placed to perform. That is largely because the market will become judicious about picking winners and losers in the AI race as increased reliance on debt financing will mean that existing capital structures are more heavily scrutinized. That should portend a more consolidative environment for broad tech: which supports a product like ZWT, given its generous yield.
Outside of tech, two sectors that we feel are best positioned are U.S. Health Care and Financials. In particular, Health Care has emerged as an effective hedge against AI-related concerns. The sector is still a bit ‘cheap’ as well, which has also worked to support its performance over the past months.
For Financials, we expect demand for loans in the U.S. economy to remain strong: not least as household balance sheets remain in good standing and as valuations remain cheap when compared to other sectors. An additional tailwind comes from regulatory changes that should free up more capital for deployment.
Top trades for this theme:
- BMO Covered Call Technology ETF (Ticker: ZWT)
- BMO SPDR Health Care Select Sector Index ETF (Ticker: ZXLV)
- BMO SPDR Financials Select Sector Index ETF (Ticker: ZXLF)
Theme #4: Elbows up!
In Canada, we remain constructive on Financials but also acknowledge that the market is likely to be one in which alpha6 can be generated through more active strategies.
Indeed, we continue to like Canadian banks. Strong capital positions and the ability to generate revenues outside of traditional retail-based lending means there are plenty of opportunities for capital deployment in 2026. However, valuation remains a bit of a headwind. As such, we favour a covered call strategy instead of a beta7 one. Continue Reading…