Inflation

Inflation

Franklin Templeton mid-year outlook: Caution lights on Recession

Jeffrey Schulze

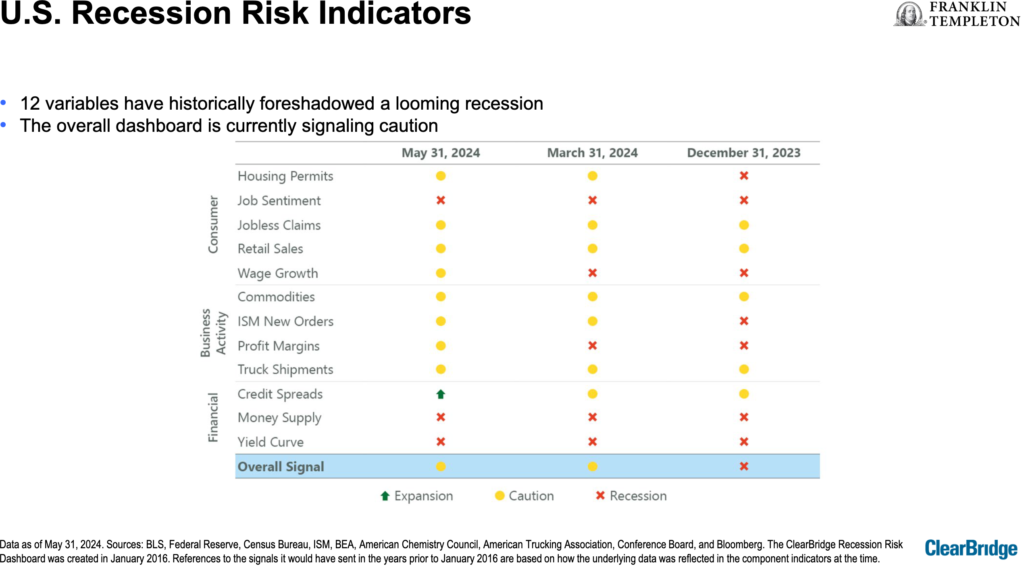
The 12 variables used to forecast Recessions are currently “signalling caution,” says Jeffrey Schulze, CFA.

Speaking Wednesday in Toronto at Franklin Templeton’s mid-year outlook, Schulze — Managing Director, Head of Economic and Market Strategy for Clearbridge Investments — told financial advisors and media that as of May 2024,  the 12 variables he tracks have “historically foreshadowed a looming recession … the overall dashboard [shown below] is currently signalling caution.”


Three indicators — Job Sentiment, Money Supply and Yield Curve — have been flashing red since the end of 2023 and continue to be, as you can see in the above chart taken from a presentation made available to attendees. The only green light is Credit Spreads, while the other eight — which include Housing Permits, Jobless Claims and Profit Margins — are all a cautionary yellow.

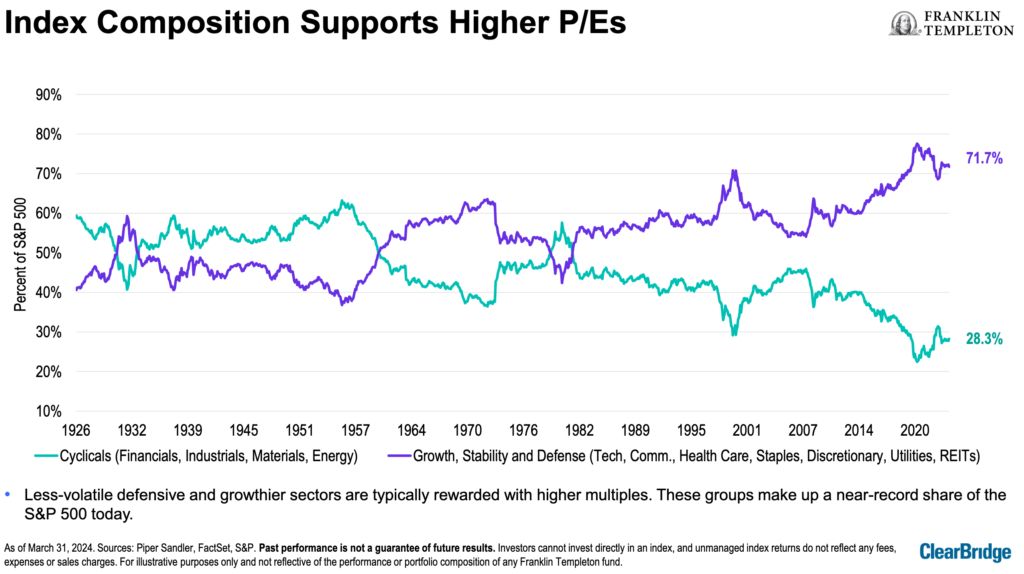
However, stock valuations do not appear to be too stretched at present. The composition of major stock indexes, such as the S&P500, support higher P/E ratios, Schulze said. “Less-volatile defensive and growthier sectors are typically rewarded with higher multiples. These groups make up a near-record share of the S&P 500 today.” As you can see in the chart below and in the higher purple line of the graph, these Defensive stocks include Tech, Consumer Staples, Utilities, and Health Care.

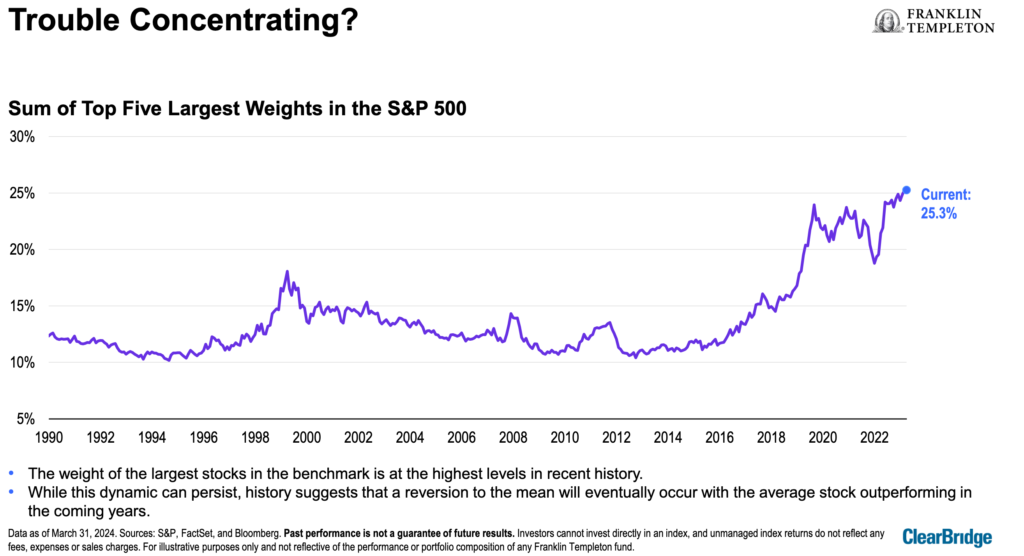
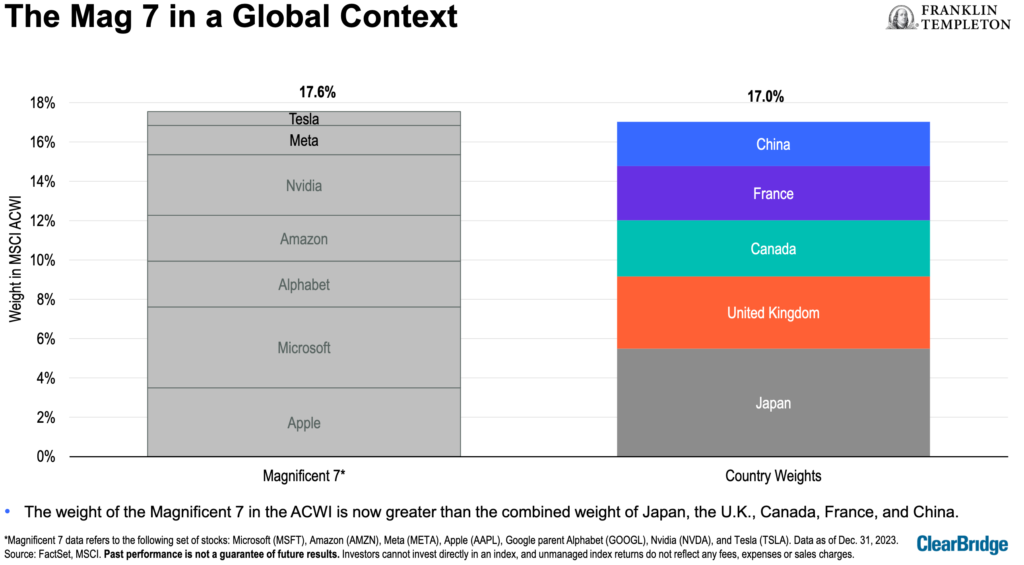
However, Schulze did note a “troubling” record-high concentration of the largest S&P500 names by market weight. As you can see in the chart below, the five largest-cap components now account for more than a quarter (25.3%) of the index, which is “the highest levels in recent history … While this dynamic can persist, history suggests that a reversion to the mean will eventually occur with the average stock outperforming in the coming years.”


In fact, the combined weight of the so-called Magnificent 7 tech stocks now exceeds the combined market weight of the stock markets of Japan, the U.K., Canada, France, and China!


However, “after behaving fairly monolithically in 2023, the performance of the Mag 7 members have diverged substantially so far in 2024,” Schulze said. A slide of the “Divergent 7”  showed Tesla down 28.3% and Apple flat, while the others were higher, led by the 121.4% surge in the price of Nvidia this year.

A key driver of the Mag 7 outperformance has been superior earnings growth, Schulze said, but “this advantage is expected to dissipate in the coming year,  which could be the catalyst for a sustained leadership rotation.”

Companies that grow their dividends are overdue to start outperforming. “Over the past year, dividend growers have trailed the broader market to a degree rarely seen over the past three decades … Past instances of similar underperformance have been followed with a strong bounce-back for dividend growers.”

A positive for markets is the “copious” amount of cash sitting on the sidelines and being readied to deploy on buying stocks. After the October 2022 lows, investors flocked into money market funds with a net increase of US$1.5 trillion, or 32%, Schulze said:  “Should the Fed embark upon its widely anticipated cutting cycle later this year, investors may reallocate. This represents a potential source of upside for equities.” Continue Reading…

Stocks still marching to inflation’s drum

By Elias Barbour, Clearbridge Investments

(Sponsor Blog)

Inflation continues to be the biggest near-term driver for equity markets, given its influence on central bank decision-making regarding interest rates. Inflation rates have moderated from their peak levels; however, they remain above the 2% targets set by the Bank of Canada (BoC) and the U.S. Federal Reserve (Fed).

U.S. and Canada Inflation

As of April 30, 2024


Equity markets entered 2024 with six to seven U.S. interest rate cuts priced in over the course of 2024, with the first cut expected in March. Clearly, that did not happen. Both central banks have remained on hold, which has contributed to higher rates across the yield curve. That number has since moderated to only three cuts, and the timing of the first cut has now been pushed out to June in Canada and even later in the United States.

The effect of “higher for longer” interest rates has been particularly painful for interest rate-sensitive market sectors such as utilities and communication services. Nonetheless, pockets of the market that were expected to continue to grow have continued to advance, undeterred by the yield curve shifts.

Buoyed by hopes for a pivot in monetary policy as inflation trended closer towards the central banks’ targets, Canadian equities had a strong start to the year, although they paled compared to the ongoing boom in U.S. equities, where a large portion of the gains were derived from mega-cap information technology  and related names with less representation in Canadian markets.

Mind the lag

Although decelerating, the economy continues to show sufficient resilience, with customer spending remaining robust since the reopening of economies after the global pandemic-induced shutdowns. Fiscal stimulus has moderated since the immediate aftermath of the pandemic outbreak; however, fiscal policy continues to operate at odds with monetary policy. Labour strength and wage gains have further reinforced this view, fuelling fears of lingering inflation and the potential for a higher-for-longer rate environment. Continue Reading…

Inflation is getting to retirees and some pre-retirees, Fidelity survey finds

2024 Fidelity Retirement Report (CNW Group/Fidelity Investments Canada ULC)

More than four in five (82%) Canadian retirees say inflation is having a negative financial impact on them in retirement, according to a just-released report from Fidelity Investments Canada ULC.

The 2024 Fidelity Retirement Report also found that 43% of pre-retirees say the rising cost of living is delaying when they think they will retire. In addition, 59% of retirees report helping their non-student adult children in retirement: both with day-to-day expenses as well as big-ticket items like home purchases, weddings and even education savings for their grandchildren.

“It comes as no surprise that retirees are feeling the bite of inflation. Other macroeconomic issues such as a slowing economy, rising rates and volatile markets are also common factors that have negatively affected retirees financially,” says the report, “Pre-retirees are also feeling the pinch. We find that compared with last year, a larger share of pre-retirees are considering delaying their retirement in response to the rising cost of living.”

As you can see from the graphic below, the percentage of pre-retirees who plan to retire later than originally expected rose from 37% in the 2023 survey to 47% in the new 2024 edition.

While less than a third of those already in retirement have worked in some capacity once they have left full-time work, most pre-retirees anticipate that they will work at least part-time once they’re retired, according to the report.

While Fidelity cites rising inflation as one reason for this trend, it also says “most pre-retirees would like extra money for recreational purposes.” Further, the report says, “We also find that there isn’t a clear relationship between those working in retirement and their level of household income, suggesting that in general, many Canadians may be working or anticipating working to maintain a higher material standard of living, rather than just to keep up with the rising cost of essentials.”


Continue Reading…

Gold glitters amid Persistent Inflation and Rate Uncertainty

Image courtesy BMO ETFs/Getty Images

By Chris Heakes, CFA

(Sponsor Blog)

Gold prices have gained more than 14% since late last year, renewing market interest for the precious metal.

Recent gains have been driven by an expectation that the U.S. Federal Reserve (Fed) is getting closer to reducing its trendsetting overnight rate, which led to a weaker U.S. dollar index to close 2023.

In recent months, inflation concerns have ramped back up with recent U.S. CPI data coming in slightly ahead of expectations. While consumer prices continue to trend in the right direction, higher shipping costs are becoming a concern with cargo ships having to avoid the Suez Canal. Shipping costs have surged 150% as a result, potentially add 0.5% percentage points to core inflation1: and re-igniting worries that CPI could accelerate again.

These developments have created a favourable environment for gold, given bullion tends to be used as a multi-purpose hedge for portfolios.

BMO Global Asset Management has launched a gold ETF that is backed by physical bullion. This ETF stores physical 400-oz. bars, secured in a local vault operated by BMO. Investing in the new BMO Gold Bullion ETF is efficient for investors as it is listed on the Toronto Stock Exchange (TSX) and trades like any stock or ETF. Additionally, since the underlying bullion holdings are professionally vaulted, investors do not have to worry about safe-keeping on their own. The BMO Gold Bullion ETFs are available at a cost-efficient management fee of 0.20%.

The BMO Gold Bullion ETF

Benefits

  • Amid reaccelerating inflation concerns and interest rate uncertainty, gold could be used as a defensive hedge.
  • Macro as well as weaker-U.S. dollar risks have risen in recent years, and could remain elevated going forward.
  • Gold offers effective diversification from stocks and bonds, which have experienced a notable rise in correlation3.

Why Gold could continue to Glitter

Gold is often used to hedge three main risks: macro-economic/geopolitical and inflation risks, as well as against a weaker U.S. dollar and fiat currencies4. All of these risks have risen in recent years and it is quite possible and perhaps probable that they will remain elevated going forward, spurring further demand. Continue Reading…

Real Life Investment Strategies #2: Debunking Retirement Financial “Rules”

Should you Plan your Retirement Savings according to the 4% Withdrawal Rate Rule or 70% of Pre-Retirement Income Rule?

Lowrie Financial: Canva Custom Creation

By Steve Lowrie, CFA

Special to Financial Independence Hub

Last month, we kicked off our “Real Life Investment Strategies” series by taking on the geopolitical world. Today, we’re going to tackle an FAQ that hits closer to home.

Whether you’re an accumulator or preparing for retirement, how do you plan for saving AND spending your hard-earned cash in retirement?

My Answer: It depends.

All those popular retirement spending rules you hear about in the popular press or through your favourite financial guru really should be called guidelines. Augmenting blunt estimates with finer-pointed planning may not be as quickly accomplished. But it’s a far more effective way to plan for how much to save as you accumulate wealth, and how much to spend as you withdraw it. In fact, it’s best to consider retirement spending as being a variable process, versus a one-and-done equation.

Which is why it depends.

Let’s bend some Rules: the 4% Withdrawal Rate Rule & the 70% Pre-Retirement Income Rule

I do feel most popular retirement spending rules were made to be broken: or at least bent to fit your specific assumptions, and adjusted over time as you encounter various phases in your retirement lifestyle.

Take the 4% Retirement Rule, for example. The catchphrase has been around since 1994, when William Bengen published his Journal of Financial Planning paper, “Determining Withdrawal Rates Using Historical Data.” In it, Bengen suggested that under certain assumptions, retirees could avoid outliving their money by withdrawing no more than 4% of their wealth in the year they retire, and then adjusting this figure annually for inflation.

The 70% Retirement Rule is another popular retirement spending hack. Here you plan to spend no more than 70% of your pre-retirement income in retirement and save accordingly toward that figure. This is supposed to work because, in theory, retirees spend less in retirement to fulfill their lifestyle wants and needs.

There are many similar shortcuts for guesstimating your retirement numbers. It’s tempting to accept these simplified rules as close enough and assume they’re all you’ll need to proceed. But the thing is, while Bengen’s analysis was rightfully lauded as an innovative new way to think about withdrawal rates in retirement, I don’t think even he meant for the 4% figure to serve as a hard and fast rule for every retiree, under every assumption, throughout their entire retirement (during which your lifestyle is likely to evolve).

The same goes for the 70% rule, and similar retirement rules.

Financial Talking Heads’ Rants on Retirement withdrawal Rate and other Shenanigans

In lieu of rules of thumb, people are also known to follow the shotgun advice of popular financial gurus who spout sweeping generalities as perfect solutions for one and all.

A prime example is Dave Ramsey of The Ramsey Show, who recently assured listeners that an 8% retirement withdrawal rate should “last forever,” as long as you invest as he suggests. He said a 4% spending rate was “asinine,” based on calculations generated by “super nerds,”“goobers,” and “morons who live in their mother’s basement with a calculator.” He then goes on a Wizard of Oz tirade about flying monkeys stealing your ruby slippers. Seriously, you can’t make this stuff up. (Check out 01:19:20 in The Ramsey Show’s “You Can’t Win with Money if You Don’t Know Where Your Money Is”  podcast episode.)

Ramsey’s math is simple, which makes it appealing and easy to understand: “If you’re making 12 [percent] in good mutual funds and the S&P is averaging 11.8, and if inflation for the last 80 years is 4%, if you make 12 and you need to leave 4% in there for average inflation raises, that leaves you eight. So, I’m perfectly comfortable drawing eight. But if you want to be a little bit conservative, seven. But, sure, not five or three.”

In a Rational Reminder rebuttal episode, “Retiring Retirement Income Myths with the Retirement Income Dream Team,” my super-nerd friends (David Blanchett, the Managing Director and Head of Retirement Research for PGIM DC Solutions; Michael Finke, a distinguished professor of wealth management at the American College of Financial Services; and Wade Pfau, Director of Retirement Research at McLean Asset Management) offer what I believe is a considerably more realistic assessment of the market’s risks and expected rewards over time, with no monkey business involved:

Without going too heavily into the math, the two main counter arguments against an 8% withdrawal rate from the Retirement Income Dream Team are:

  • There can be large differences between geometric returns (what you earn in an investment) and arithmetic returns (the simple average). For example, an average 12% return doesn’t mean that a retiree’s portfolio grows by 12% per year. If $1 million invested in stocks falls by 20%, you now have $800,000. If it rises by 25% the next year, you’re back up to $1 million. The average return of -20% and positive 25% is 2.5%. But you still only have a million bucks. Your actual return was zero.
  • A 100% stock portfolio significantly increases the sequence of returns risk. For example, a U.S.-based investor, owning U.S. stocks in the 2000s and following an 8% withdrawal rule would have run out of money in as little as 13 years.
Source:  https://www.thinkadvisor.com/2023/11/13/supernerds-unite-against-dave-ramseys-8-safe-withdrawal-rate-guidance/

I would add from a behaviour side of things, that a 100% stock portfolio, especially during retirement would be virtually impossible to stick with.

When it comes to Retirement Savings, One Size rarely fits all

Besides, don’t you want your retirement numbers to be based on personalized levels of evidence and reason, instead of hope and hype? I know I do, which is why I treat sweeping assumptions and general rules of thumb as starting rather than ending points.

By necessity, generic advice involves making assumptions, often huge ones, that may or may not reflect your own realities. The original 4% Rule, for example, assumed the investor is investing their retirement nest egg in 50% stocks/50% bonds, held entirely in tax-sheltered accounts. It also assumed a 30-year retirement.

Not everyone wants or needs to invest this conservatively. At the other end of the spectrum, Ramsey appears to assume you’re going to put your entire nest egg in the U.S. stock market, mostly large-company growth. He also seems to assume (quite erroneously) that we can rely on this market to deliver an average 12% pre-inflation return forever.

My take: There’s nothing nerdy about wanting to avoid hoarding or squandering your wealth. If your retirement years are short enough, your income remains ample enough, and your market timing is lucky enough, spending 8% annually in retirement might be right for you. For others, even 4% is overly optimistic. Either way, I wouldn’t bank on any given number without first engaging in some serious reality checks, and revisiting your plans as you proceed.

Let’s return to our fictional investors to illustrate how real-life retirement planning, withdrawal rate, and spending works. Continue Reading…