Building Wealth

For the first 30 or so years of working, saving and investing, you’ll be first in the mode of getting out of the hole (paying down debt), and then building your net worth (that’s wealth accumulation.). But don’t forget, wealth accumulation isn’t the ultimate goal. Decumulation is! (a separate category here at the Hub).

Violating my Principles

By Noah Solomon

Special to Financial Independence Hub

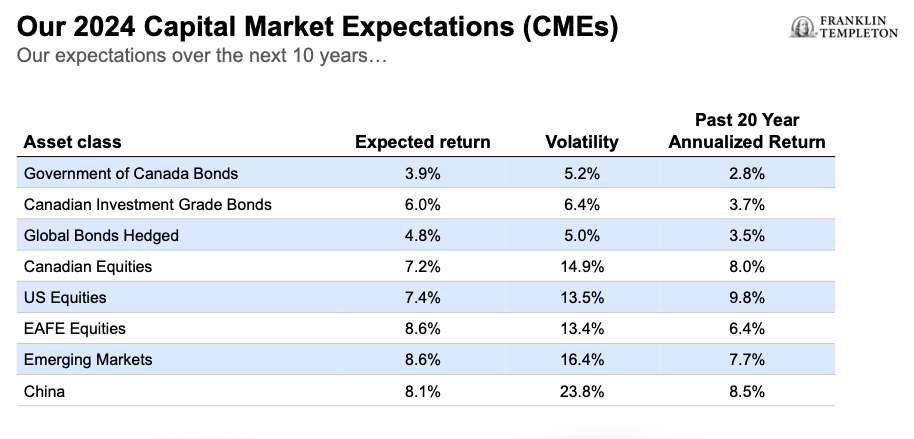
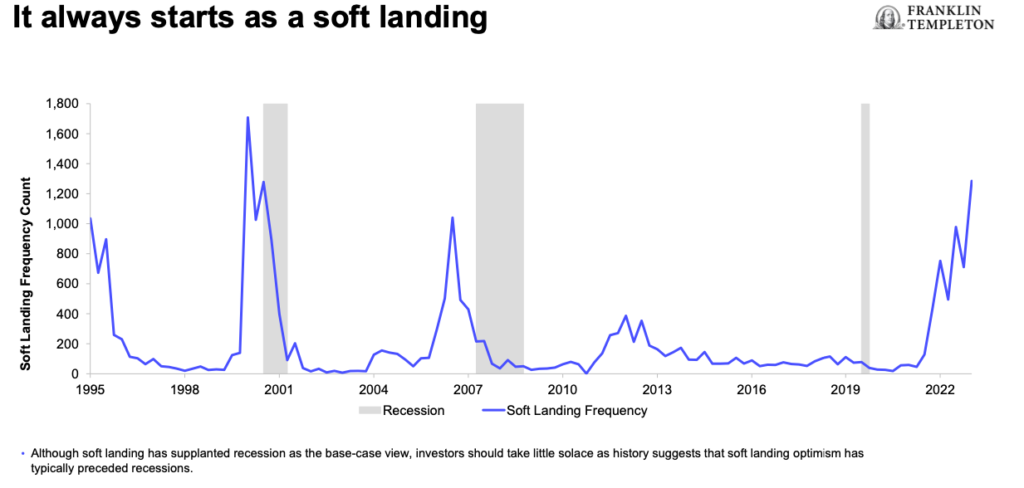
As I have written in the past, predicting stock market returns is largely an exercise in futility. Over the past several decades, the forecasted returns for the S&P 500 Index provided by Wall Street analysts have been slightly less accurate than someone who would have merely predicted each year that stocks would deliver their long-term average return. Importantly, not one major Wall St. strategist predicted either the tech wreck of the early 2000s or the global financial crisis of 2008-9.

To be clear, I am still adamant that consistently accurate forecasts are beyond the reach of mere mortals (or even quant geeks like me). Any investor who could achieve this feat would reap returns that put Buffett’s to shame. However, there may be some hope on the horizon. Good is not the enemy of great. The objective of any investment process should not be perfection, but rather to make its adherents better off than they would be in its absence.

To this end, I have decided to sin a little and model some of the most commonly cited macroeconomic variables that influence stocks market returns, with the objective of (1) ascertaining whether and how these factors have historically influenced markets and (2) what these variables are signaling for the future.

Don’t Fight the Fed

It is often stated that one shouldn’t fight the Fed. Historically, there has been an inverse relationship between changes in Fed policy and stock prices. All else being equal, increases in the Fed Funds rate have been a headwind for stocks while rate cuts have provided a tailwind.

Prior 1-Year Change in Fed Funds Rate vs. 1-Year Real Returns: S&P 500 Index (1960-Present)

As the preceding table illustrates, the difference in one-year real returns following instances when the Fed has been pursuing tighter monetary conditions has on average been 6.6%, as compared to 10.6% following periods when it has been in stimulus mode.

As of the end of June, the Fed increased its policy rate by 3.5% over the past 12 months. From a historical perspective, this change in stance lies within the top 5% of one-year policy moves since 1960 and is the single largest 12-month increase since the early 1980s. Given the historical tendency for stocks to struggle following such developments, this dramatic increase in rates is cause for concern.

Valuation, Voting, and Weighing

Over the past several decades, valuations have exhibited an inverse relationship to future equity market returns. Below-average P/E ratios have generally preceded above-average returns for stocks, while lofty P/E ratios have on average foreshadowed either below-average returns or outright losses.

Trailing P/E Ratio vs. 1-Year Real Returns: S&P 500 Index (1960-Present)

Since 1960, when P/E ratios stood in the bottom quintile of their historical range, the S&P 500 produced an average real return over the next 12 months of 9.4% compared with only 6.9% when valuations stood in the highest quintile. Sky high multiples have proven particularly poisonous, as indicated by the crushing bear market which followed the record valuations at the beginning of 2000.

To be clear, valuations have little bearing on the performance of stocks over the short term. However, their ability to predict returns over longer holding periods has been more pronounced. As Buffett stated, “In the short run, the market is a voting machine but in the long run, it is a weighing machine.”

Although valuations are currently nowhere near the nosebleed levels of the tech bubble of the late 1990s, they are nonetheless elevated. With a trailing P/E ratio hovering north of 21, the S&P 500’s valuation currently stands in the 84th percentile of all observations going back to 1960 and is at the very least not a ringing endorsement for strong equity market returns.

From TINA To TARA To TIAGA

At any given point in time, stock market valuations must be considered in the context of the yields offered by high quality money market instruments and bonds. The difference between the earnings yield on stocks and interest rates has historically been positively correlated to future market returns.

Earnings Yields Minus Fed Funds Rate vs. 1-Year Real Returns: S&P 500 Index (1960-Present)

When the difference between earnings yields and the Fed Funds rate has stood in the top quintile of its historical range, the real return of the S&P 500 Index over the ensuing 12 months has averaged 8.7% versus only 2.2% following times when it has stood in the bottom quintile.

Until the Fed began to aggressively raise rates in early 2022, TINA (there is no alternative) was an oft-cited reason for overweighting stocks within portfolios. Yields on bank deposits and high-quality bonds yielded little to nothing, thereby spurring investors to reach out the risk curve and increase their equity allocations.

As the Fed continued to raise rates, increasingly higher yields made money markets and bonds look at least somewhat attractive for the first time in years, thereby causing market psychology to shift from TINA to TARA (there are reasonable alternatives). Continue Reading…

Long-term Financial Concerns when moving to a New Region

Image Source: Unsplash

By Beau Peters

Special to Financial Independence Hub

There are many reasons that people may move to a new state or province, including job opportunities, a change of pace, or wanting to be closer to family. However, one of the major factors in relocating is that where they currently live is more expensive than where they could be.

It’s easy to live in the now and make a drastic change because you believe the grass is greener on the other side, but you must also prepare for the future, and be aware of how your finances could be impacted when you move across state lines. Here are a few long-term financial implications you’ll want to keep in mind before you go.

Cost of Living

Some people move to another state because they like the weather or have friends they want to be closer to, but they’re shocked when they realize that the price of living is exponentially higher than the place they left. Some states have higher prices for the things we buy most, and the costs will likely stay that way for the foreseeable future.

We’re not just talking about the price of milk or groceries either. Costs can vary for many products and services, including healthcare, utilities, gasoline, etc. Before you relocated, research how the costs will affect you personally. You may want to reconsider if you know you’ll have a long commute to work and discover that you’d be paying 50 cents more per gallon of gas. Search online for a cost comparison calculator, which you can use to research the potential costs and make an educated decision.

Sometimes you must move for non-negotiable reasons, such as job opportunities or to be closer to family. If that’s the case and you know that the new state will be more expensive, then you may need to make some adjustments now to reduce costs — especially if you’re moving with young children. Though the actual process of moving with young kids can be difficult, there are ways to mitigate those challenges before, during, and after the move. Mapping out the route you plan to take ahead of time and arranging for childcare the day of the move are both ways to reduce stress during your relocation.

However, beyond the move itself, you have to be prepared for higher costs while raising your children, which may mean dealing with more expensive childcare, healthcare, and school expenses for years to come. These expenses shouldn’t necessarily prevent you from moving, but you should take them into account to ensure you’re making the right decision for your family and finances.

Taxes will be Different

Many people get excited because they hear that the cost of living is less in another state, but they often forget how taxes come into play.

One talking point that gets a lot of folks fired up is when a state doesn’t have an income tax. That’s the case in nine U.S. states, including Florida, Nevada, and Washington. However, you may not save as much money as expected because the states need to make that money up somehow. They often do so by charging more for sales, property, and estate taxes. If you buy a home, the property taxes can be a significant shock every year, so do your research. Continue Reading…

Vanguard Home Bias study says Canadians should raise global stock exposure to 70%

Vanguard Canada has released an interesting study on home country bias around the world, and makes the familiar case that most Canadian investors are woefully overweight Canadian equities and underweight the rest of the world. You can find the full report (PDF), by clicking here.

The report is written by Bilal Hasanjee, CFA®, MBA, MSc Finance, Senior Investment Strategist for Vanguard Investments Canada. He points out that Canadian stocks account for only 3.4% of the total global stock market as of June 30, 2022, but as the chart to the left shows, the average Canadian investor is more than 50% in domestic (Canadian) equities. That’s a whopping overweight position of 15 times!

“There are good reasons to have some overweight to Canada for domestic investors, including future return differentials, preference for the familiar, favourable tax considerations, the need to hedge domestic liabilities and currency risk,” writes Hasanjee, “However, Vanguard believes the optimal asset allocation for Canadian investors is 30% vs 70% allocation to Canadian versus international equities, based on our research …”

In other words, it’s okay to be overweight Canada by a factor of nine (30% versus 3.4) but most of us still need to boost our foreign content by roughly 50%: from 47.8% to 70%.

Home Country bias is hardly unique to Canada

Home country bias is hardly unique to Canada, the report says: it’s certainly the case in the United States and many developed countries, as Figure 2 demonstrates:

Americans are also overweight their home market —  the United States — but they can get away with it, as more than half the global market capitalization is in American stocks, plus many of those are blue-chip corporations that have the world as their market. If anything, Interestingly you can see from the above that Australia, which is similar to the Canadian stock market in being focused mostly on energy/resources and financials, suffers even more than Canada from home country bias. Continue Reading…

TIARA: There Is a Real Alternative

Designed Wealth Management

By John De Goey, CFP, CIM

Special to the Financial Independence Hub

By now, you’ve likely heard the term FOMO: the Fear of Missing Out.  You’ve likely also heard the term TINA: There Is No Alternative.

Taken together, these handy little pop culture acronyms explain a good deal of what has gone on in capital markets over the past three years or so. I’d like to take this opportunity to push back a little on the second one.  Based on current valuations, there may not be a sensible alternative to stocks, bonds, and real estate, but there may well be an alternative in …. wait for it…. alternatives.

Alternative assets are varied and the term ‘alternative’ could mean different things to different people. The asset class is known on a non-correlated basis by offering opportunities in such varied assets as infrastructure, liquid alternatives, structured notes, and hedge funds.  While I personally dislike the last option due to high fees, illiquidity, and opaque reporting, depending on client objectives and risk tolerance, I believe there’s often a strong case that can be made for adding alternatives to your portfolio.  As such, here’s a new term: TIARA. It stands for: There Is A Real Alternative.  You’re not stuck with having to only choose between some combination of stocks and bonds. [Editor’s Note: John De Goey coined this term.]

A third major Asset Class

In the past half decade or so, many more traditional asset allocation strategies have changed significantly as bond yields have declined.   The asset class that has been gaining the most traction is alternatives. Continue Reading…

Should you Dump your All-Equity ETF?

By Justin Bender, CFA, CFP  

Special to Financial Independence Hub

In our last blog/video, we introduced the all-equity ETFs from iShares and Vanguard. These ETFs make it easy to gain and maintain exposure to global stock markets with the click of a mouse, eliminating the hassle of juggling several ETFs in your all-equity portfolio.

Vanguard and iShares don’t offer their services for free though.

The MERs for their all-equity ETFs are slightly higher than the weighted-average MERs of their underlying holdings. Consider this modest surcharge as the price of admission for their professional asset allocation and rebalancing services. In my opinion, that’s a bargain for most investors.


Then again, there are those who might prefer to squeeze every last penny out of their portfolio costs. If that’s you, you may want to try skipping the value-add of an all-equity ETF, and simply purchase the underlying ETFs directly, in similar weights. If you take on the task of rebalancing back to your targets each month when you add new money to your portfolio, you should be able to mimic an all-equity ETF for a lower overall MER.

That’s the goal anyway. But it’s still going to take time, money, or both to keep your asset allocations on track each month. Let’s look at three potential strikes against trying to reinvent an all-equity ETF on your own, as well as one potential play that may serve as a suitable compromise.

Strike One: The potential cost savings are minimal.

For example, let’s say you’ve got $10,000 to invest. Instead of investing it in the Vanguard All-Equity ETF Portfolio, or VEQT, you could divide it up among VEQT’s component funds. The estimated cost savings might let you rent an extra movie each year, but are the savings really worth it? The extra time you’ll need to spend on rebalancing may not leave you much time to even enjoy your movie.

For larger amounts, the fee savings start adding up, but only if you can buy and sell ETF shares at zero commission as you rebalance. If not, you can forget about it.

Strike Two: Managing a portfolio of four ETFs (instead of just one) will be more difficult.

Sticking with our VEQT example, a DIY investor would either need to visit Vanguard’s website monthly to collect the individual ETF weights within VEQT, or use the market cap data from the FTSE and CRSP index fact sheets to determine how to allocate each of the underlying ETFs. They would then need to calculate how many ETF units to buy or sell across various accounts to get their portfolio back on target, and place multiple trades to get the job done. Continue Reading…

Powered by the Financial Independence Hub.
© 2013-2024 All Rights Reserved.
Financial Independence Hub Logo

Sign up for our Daily Digest E-Mail!

Get daily updates from the FindependenceHub.com straight to your inbox.