For the first 30 or so years of working, saving and investing, you’ll be first in the mode of getting out of the hole (paying down debt), and then building your net worth (that’s wealth accumulation.). But don’t forget, wealth accumulation isn’t the ultimate goal. Decumulation is! (a separate category here at the Hub).
‘Cause I wanna be the minority I don’t need your authority Down with the moral majority ‘Cause I wanna be the minority
Minority, by Green Day
I Stand Corrected
In past commentaries, I stated that (1) forecasting the future is next to impossible, and (2) it is therefore of no use when it comes to successful investing. After careful consideration, I acknowledge that there are exceptions to my first statement. I nonetheless maintain that forecasts, even to the extent they are accurate, are generally of no use when it comes to achieving better than average investment results.
Most people assume that accurate forecasting and outperformance go hand-in-hand. As such, my contention that accurate forecasts do not generally lead to outperformance seems paradoxical. This month, I will explain why, despite my change of heart when it comes to some peoples’ ability to forecast, I am holding steadfast to my belief that forecasting and investment results are fundamentally estranged.
Accuracy and Success are not Synonymous
There is a saying that if you are being chased by a bear, “You don’t have to run faster than the bear to get away. You just have to run faster than the person next to you.” With respect to forecasting, the ability to outperform doesn’t stem from making accurate predictions, but rather from making predictions that are more accurate than those of others.
Contrary to popular opinion, economic developments or corporate earnings do not move markets. Rather, it is only when such events come as a surprise that meaningful movements in asset prices occur.
Imagine a scenario where you position your portfolio based on a forecast for strong economic growth, low unemployment, declining inflation, and falling interest rates. If (1) your predictions turn out to be correct and (2) most market participants have the same view, your performance will be average. Your forecast would already be reflected in security prices, resulting in average performance.
Similarly, reactions to earnings announcements show that it’s not earnings per se, but rather earnings which come as a surprise (that differ from what the consensus was predicting) that cause meaningful movements in stocks. The stock price of a company that reports a doubling of earnings will not necessarily rise and may even decline. If most investors had predicted that the company would grow its earnings by less than 100%, the price of its shares would likely rise after its earnings announcement. However, had the consensus been for earnings growth of more than 100%, its stock would likely decline. Most likely (yes, the consensus is right most of the time), the majority would be expecting earnings to double, in which case there would be little if no post announcement movement in the company’s stock price.
The upshot is that even when forecasts are accurate, they generally don’t result in above average performance. It is only forecasts that both differ from consensus and are correct which result in superior performance.
Easier Said than Done
Just as being no faster or slower than the other person being chased by a bear does not guarantee your survival, accurate forecasts don’t lead to superior performance if the consensus forecast is similarly correct. Unfortunately, the other person being chased by the bear is damn fast! The consensus view is right most of the time.
If consensus forecasts are usually correct, then by definition contrarian ones are more often than not incorrect. Consequently, non-consensus and accuracy, the two forecasting characteristics required to achieve above average results, generally stand in opposition to each other. Pick your poison: either stick with the consensus and deliver average results or stray from the crowd and run a high risk of underperformance.
The Past is the Best Predictor of the Future … Until it Isn’t
Most forecasters are incrementalists: they use current conditions as a baseline and then make only minor adjustments depending on their respective views.
Things generally continue as they have been. Economic expansions and bull markets tend to last several years. Years in which stocks rise tend to be followed by further gains in the following year. Given this pattern, incremental forecasting tends to work most of the time.
The minority of occasions when consensus forecasts fail — which are also when non-consensus forecasts can add the most value — tend to happen during major turning points in markets, which are the exception rather than the rule. Not only are such sea changes extremely difficult to predict, but they are also hard to act on.
There’s no Point in Explaining to Someone who doesn’t Want to Listen
During the late 1990s tech bubble, most investors were convinced (or convinced themselves) that markets were experiencing the dawn of a new era abounding with limitless possibilities. A “no price is too high” mentality permeated the masses’ minds, causing tech stocks to rise at a parabolic rate and reach unsustainable valuations. Similarly, by the mid 2000s, the consensus view was that real estate was a bulletproof investment which could only go up, causing home prices to become completely detached from fundamentals and leading to lending practices that were profoundly estranged from risk management.
Notwithstanding the bitter endings to these episodes, there were few forecasters at the time who were willing to take a sober and skeptical view of what was bordering on utter lunacy. Perhaps more importantly, few investors were willing to listen to those who did, dismissing them as being “tone deaf” to what was perceived as a new reality in which the old rules did not apply. When the party is in full swing, nobody wants to either be or listen to the naysayer warning of impending hangovers.
Being Right isn’t Enough: You need to be Right Soon
Forecasts that can produce outperformance not only necessitate accuracy and straying from the crowd at times when it is most difficult to do so but also require precise timing. It’s hard enough to predict inflection points in markets, but predicting the precise timing of such pivots is next to impossible.
Among the few lonely souls who saw trouble brewing in the late 90s tech bubble or the early 2000s real estate craze, most of them were devastatingly early. Both tech stocks and real estate continued to appreciate at a torrid pace after the few naysayers (who were largely ignored) began ringing alarm bells. Few contrarians had the resolve to stick with their views as prices continued to rise, even though their predictions were becoming more likely as valuations became increasingly unsustainable.
A correct insight which is too early can lead to losses, insolvency, or ridicule. As legendary investor Howard Marks stated, “Being too far ahead of your time is indistinguishable from being wrong.” Even John Paulson, who eventually made billions in profits by shorting the U.S. housing market in 2006, had to endure massive losses in 2007 before his bet paid off.
Career Risk & Safety in Numbers
In the world of forecasting, being wrong can be very detrimental, particularly with respect to one’s career and credibility.
Most forecasters got caught flat footed when markets began reeling in 2000 and 2008. However, they could take solace in the fact that they were in the majority, which provided them with sufficient cover. On the other hand, being wrong on a contrarian view can have devastating consequences. The asymmetric risk of differing from the crowd is best described by John Maynard Keynes’ observation:
“It is the long-term investor who will in practice come in for the most criticism. For it is the essence of his behaviour that he should be eccentric, unconventional and rash in the eyes of the average opinion. If he is successful, that will only confirm the general belief in his rashness; and if in the short run he is unsuccessful, which is very likely, he will not receive much mercy. Worldly wisdom teaches that it is better for reputation to fail conventionally than to succeed unconventionally.”
Those who Tell don’t Know. Those who Know don’t Tell
Cynically speaking, if someone had the ability to make accurate, non-consensus forecasts that could generate better than average performance, why on earth would they share them? Such skills could produce returns that would make Buffett look like a chump. Those with such prowess (who are rare to non-existent) would be far better off following their own advice rather than wasting their time convincing others to follow it!
Algorithmically Embracing the Unknown
At Outcome, our views on forecast-based investing are best summed up by H.L. Mencken’s assertion that “We are here and it is now. Further than that, all human knowledge is moonshine.”
We always have and continue to shun forecast-based investing, with which we believe neither we nor anyone else can add value. We will continue to apply our machine-learning based investment models to markets that are subject to behavioural biases and non-economic motivations to deliver outperformance over the long-term.
Of note, our approach to investing has consistently enabled the Outcome Canadian Equity Income Fund to mitigate losses and preserve capital in challenging markets, with last month being no exception. In March, the TSX Comp. Index declined 4.3%, while the S&P 500 Index fell 5.0%. In comparison, the Outcome Canadian Equity Income Fund rose 0.7%.
Noah Solomon is Chief Investment Officer for Outcome Metric Asset Management Limited Partnership. From 2008 to 2016, Noah was CEO and CIO of GenFund Management Inc. (formerly Genuity Fund Management), where he designed and managed data-driven, statistically-based equity funds.
Between 2002 and 2008, Noah was a proprietary trader in the equities division of Goldman Sachs, where he deployed the firm’s capital in several quantitatively-driven investment strategies. Prior to joining Goldman, Noah worked at Citibank and Lehman Brothers. Noah holds an MBA from the Wharton School of Business at the University of Pennsylvania, where he graduated as a Palmer Scholar (top 5% of graduating class). He also holds a BA from McGill University (magna cum laude).
Noah is frequently featured in the media including a regular column in the Financial Post and appearances on BNN. This blog originally appeared in the March 2026 Outcome newsletter and is republished on Findependence Hub with permission.
I originally wrote this article about buying a house in Canada back in 2021: right as the price of housing was picking up. I’ve kept it updated over the last few years as it caught the attention of Rob Carrick over at the Globe and Mail, as well as a few other big names. Five years after writing the initial version of this article, the value proposition on buying a house in Canada has certainly changed!
2026 Editor’s Note: I still don’t own a home, and while I’m not 100% averse to the idea of owning one day, that day is definitely not in the near future
Image by satheeshsankaran from Pixabay
By the end of the summer I will no longer be a homeowner.
In many countries that statement would be a simple matter of personal finance. Selling an asset, paying off a loan (mortgage) and moving on to another living space.
But not in Canada.
No, in Canada selling our house means that my wife and I are making a massive change to our identities. A core shift in our very essence.
Many would say we are taking a careless step backward on the path to living a fulfilled “real adult” life.
Several friends and family will likely believe that we are crazy for tossing away “the best investment one can ever make.”
The absolute obsession with homeownership in Canada continues to astound me. The emotional connection between Canadians and their real estate has been well documented, but that doesn’t make it any more logical! Even though my wife and I have owned a home for years, this was much less because we subscribed to the traditional “own at all costs” mentality, and more due to the fact that rural Manitoba housing vs rent decisions are quite different than most places in Canada.
We’ll certainly miss some of the small luxuries (goodbye big garage) of our old home, but here’s some of the reasons why we believe selling our house will be a weight off of our shoulders.
1) Endless Fear of Hearing a Strange Noise
Is that the furnace taking its last breath?
Perhaps it’s the water treatment system deciding to spring a leak?
Is that rain I hear: is it possible our septic system is backing up?!
My dad loves fixing stuff. His day is not complete until he has improved the physical world around him.
I am not my dad.
My lack of handyman skills has now become a joke that I’m comfortable laughing at, but for years I was incredibly self-conscious about possessing nearly zero masculinity-affirming fix-it ability. You want someone to work hard doing menial chores such as cutting lawns, raking leaves, shovelling snow, or lifting heavy things from Point A to Point B: I got you covered.
Anything that requires technical skills or mechanical problem-solving ability … not so much.
Because my father’s handyman-dominant brain was not passed down to his oldest son, I lived in perpetual fear of things breaking when I owned a home. I never really got this “pride of ownership” thing. For me it was definitely more of a “fear of ownership.” I had so much of my net worth tied up in this one asset – which required constant maintenance – and I really had no idea what it was doing. “Learning by doing” constantly scared me as errors were quite costly.
Hiring any specialized help on something like an air conditioning unit always seemed to cost triple what was estimated, so that just exponentially added to my anxiety levels around maintenance.
Renting = not my problem!!!
2) Is Renting still a Better Financial Decision than Buying in 2026?
Back in 2021 I wrote that it was “quantifiably true” that renting was better than buying. In fact, I went on to say:
I know … that’s a big statement.
It’s probably worth an article all on its own.
It will probably lead to crazy comments (as all real estate articles in Canada do): Editor’s Note: It did!
iii) Here’s Ben Felix’s 5% rule in action. I personally believe that Ben is shooting a bit high on real estate estimates (today’s giant houses are not comparable to historical returns data he quotes), and a bit low on property taxes + maintenance costs. He also isn’t factoring in closing costs (which are a pretty big deal when you move the number of times the average Canadian does), nor the difference between renters insurance and home insurance.
I do like his methodology, but the 5% rule of thumb for non-recoverable costs is pretty badly slanted towards real estate due to the factors mentioned above. I could probably live with a 6% rule: (speaking as a soon-to-be former homeowner of ten years).
Editor’s Note: Ben has done a ton of work in the rent-vs-buy realm since 2021. I still think he’s underestimating maintenance costs, as inflation rates on tradespeople over the last 10 years are really high even relative to overall inflation. His most recent deep dive shows that renting still wins out the majority of the time (even during a massive boom for housing in Canada vs the Great Recession in stocks in 2008).
iv) I’ve talked to many real estate experts who claim “the 1%” rule of thumb is a great filter for a potential landlord looking to add a revenue-generating property to their real estate portfolio.” That means that if you can’t get at least 1% of your purchase price in monthly rent, then it’s not really worth considering the property.
The flip side of that is that if you’re renting for substantially less than 1% of the purchase price of a comparable home: then you’re getting a good deal. Bryce over at Millennial Revolution explains his rule of 150 which comes to similar conclusions.
Those are all great looks at accurately comparing financial costs vs benefits of purchasing a house to live in.
2026 Update: I continue to think these are great rules of thumb for comparing renting and buying. So let’s take a look at how these rules would guide us as we look at rent and buying across Canada in 2026.
Toronto Real Estate
The average price of a property sold in the GTA in March of 2026 was $1,017,796. Interestingly, that’s actually slightly less than when we looked at this in 2021 ($1,108,453) while the average rent is closer to $2,250 (up slightly from $2,100 in 2021). Before we crunch the numbers, it’s interesting to note that both purchase price and rent have went up at a rate less than general inflation since 2021!
Our 1% rule landlord of thumb says that a $1,050,000 house better get you $10,500 per month in rent: or it’s not a good buy.
Using John’s or Preet’s calculators we see that renting is WAY ahead given these parameters.
My modified Ben Felix 6% rule tells us that if we can rent for $5,250 or less: then it’s a pretty good deal to rent. If we stick to his original 5% rule, we need to rent for less than $4,375 to be a good deal.
Bryce’s preferred rule of 150 means that the $2,250 rental average, would dictate a mortgage payment of $1,500 as a good measuring stick for if they should buy.
Conclusion: By any measure … It’s still a better deal to rent in Toronto, even though the price of homes hasn’t gone anywhere in 4 years!
Buying a House in Calgary
Back in 2021, Calgary was still recovering from the oil shock. These days, we see that rents and property values have increased substantially.
The average rent in Calgary is roughly $1,700 (compared to $1,200 back in 2021) and the average cost of a property has gone from $510,000 to about $616,000.
Our 1% rule of thumb says that a $616,000 house better get you $6,160 per month in rent; or it’s not a good buy.
Using John’s or Preet’s calculators we see that renting is substantially ahead given these parameters.
My modified Ben Felix 6% rule tells us that if we can rent for $3,080 or less: then it’s a pretty good deal to rent. If we stick to his original 5% rule, we need to rent for less than $2,567 to be a good deal.
Bryce’s preferred rule of 150 means that the $1,700 rental average, would dictate a mortgage payment of $1,133 as a good measuring stick for if they should buy or not. A $1,133 mortgage would correlate to a purchase price of roughly $250,000.
Even with rental prices going up at a much faster rate than home prices, it’s still a good deal to rent in Calgary!
Home Prices in Halifax
Back in 2021 I decided to throw Halifax into the mix as a substantially different housing market than the big cities like Toronto and Calgary.
In 2026 the average rent in Halifax is about $1,900 per month (versus $1,600 back in 2021) and the average cost of property has risen from $465,000 to about $560,000. (Just a note, these are weighted averages taken from across all home types.)
Our 1% rule of thumb says that a $560,000 house better get you $5,600 per month in rent: or it’s not a good buy.
Using John’s or Preet’s calculators we see that renting is substantially ahead given these parameters.
My modified Ben Felix 6% rule tells us that if we can rent for $2,800 or less: then it’s a pretty good deal to rent. If we stick to his original 5% rule, we need to rent for less than $2,333 to be a good deal.
Bryce’s preferred rule of 150 means that the $1,900 rental average, would dictate a mortgage payment of $1,267 as a good measuring stick for if they should buy or not. A $1,267 mortgage would correlate to a purchase price of under $300,000.
Canada’s current price-to-rent levels are 574% higher than they were in 1970.
Since 1970, Canada’s price-to-rent level has risen at roughly 21x as quickly as the USA’s.
Canada’s current price-to-rent levels are substantially higher now than the USA’s was before their 2008/09 housing crash.
In 2026, I’d add to this:
Our current price-to-rent levels aren’t much changed in 2025, and are still WAY higher than in 1970 (we’re now at about 587% versus 1970).
Since 2021, the U.S. market has cooled slightly more than the Canadian market has, thus exacerbating that comparison point.
Rent dynamics are flipping as supply catches up. After rents jumped 6.3% in 2023 and 7.9% in 2024, vacancy rose from 1.5% (2023) to ~2.3% (2024). Rents have now declined in Canada for 18 consecutive months according to Rentals.ca. Result: asking-rent growth is easing, especially in older stock.
Population policy is easing some demand pressure. Ottawa lowered permanent-resident targets and, for the first time, set caps on temporary residents (aiming to reduce the temp-resident share toward 5% of the population). CMHC explicitly baked in “weakening migration” into its 2025 call for higher rental vacancies.
Clearly, while the numbers have changed slightly, there aren’t really any new conclusions to draw from the rent vs buy math alone.
3) Opportunity Cost of being Rooted into Place
I grew up in a single house: owned by a homeowner. (My parents were unique in that my dad built his own house on a very cheap piece of rural land and never took out a mortgage. Feel free to try and copy that strategy in 2021.)
It was really nice. I get that there can be some very pleasant reasons to own the house/condo that you live in.
But let’s be honest about the big picture here: there are some large trade-offs involved.
Buying a home makes you much less likely to move in order to accept a promotion or career opportunity. That’s impossible to quantify, but it’s a really significant consideration.
One of the quickest ways to climb in any industry (or even make an advantageous jump to a new industry) is to be willing to move to where the opportunity is. The cost to your career of feeling as if you are anchored to the house you worked so hard to get into could be massive!
4) Our Brains Work Differently when we think about Renting a Place to Live vs “Buying a Forever Home” – Lifestyle Inflation is Almost Inevitable.
Funny things begin to happen as we approach the leap from renter to homeowner. Suddenly, cost-benefit calculations we were doing about third bedrooms or fancy kitchens fly out the window … only the best will do for our “forever home” after all.
Weird mantras like, “We’ll grow into it,” begin to creep into our heads and suddenly we’re looking at fancy countertops, upgrading bathrooms, etc.
I’m not sure whether to blame HGTV and the homeshopping shows or what it is, but there is no doubt that most of us look at properties completely differently whether we are renting or buying. Keeping up with the Joneses becomes so much more important (is this what “being a real adult” is truly all about?) when you’re buying and furnishing a house.
One thing that we have learned from moving overseas is that we can be 98% as satisfied in a two-bedroom apartment as we were in our large bungalow. Now, I hear you that things might be different if you have a young family. I’m sure this equation changes substantially when adding children to the picture, but when you look at the smaller average house size that the larger families of yesteryear were raised in, it raises some interesting questions about how much room we all need to be happy.
5) “Drive until you Qualify” = Too Much Driving
I have consistently found that we underestimate the cost of driving: in both lifestyle and dollars!
There have been many studies done on how spending time in the car can really impact your physical health in a myriad of ways. It doesn’t take a genius to figure out that the more time you spend sitting by yourself (often stuck in frustrating traffic) the less healthy and happy you are likely to be.
Maybe this work-from-home thing is going to reduce these financial and physical costs … but I have my doubts as to how many people this will actually affect a few months from now.
When calculating how much your commute will cost you, one needs to factor in depreciation and repairs, in addition to the price of gasoline (or perhaps electricity) and possibly parking. The government of Canada believes it costs about $0.73 per km to drive, while CAA posts similar estimates (and that’s prices from before the recent surge in Canadian gas prices).
At 260 work days per calendar year, every km you move further from your workplace will cost you about $380 per year! If you have two working adults that are both commuting in your household, it doesn’t take long for those numbers to really add up.
6) My House is Definitely NOT the Best Investment I’ve ever Made
If the real estate boosters didn’t try to burn down this website after reading the rent vs own comparison earlier in this article, they will surely reconsider after reading this.
If I’ve heard it once, I’ve heard it two hundred times: “My house is the best investment I’ve ever made.”
While I have written extensively on this topic (and had to explain the point to many parents in the course of teaching personal finance over the years) there is simply no debating the following considerations about owning your home from an investment perspective. Note: We’re not talking about owning a rental property here: that’s a much different conversation.
There are many reasons why the Holy Grail of investment advice is Thou Shalt Diversify. Tying up all of your cash (and then borrowing huge amounts of money that tie up all future earnings) is NOT diversification. Having your entire net worth determined by one building in one location is not a smart risk management decision.
Why is it that when people borrow money to invest in the stock market (known as leverage) it’s considered inherently risky, but when people borrow 9x their downpayment on a house it’s considered “common sense”?
When we think about how much money we’ve “made” on our home, we often forget to include all of the non-recoverable costs involved such as taxes, maintenance and repair costs, transaction fees to buy & sell, renovations that cost way more than they added resale value, etc.
The Case-Shiller Housing Index has stated that between 1928 and 2013, the average annualized rate of return for American housing was 3.7%. The average annual rate of return for American stocks was 9.5% during that time period. Canadian housing and stocks track much the same path.
The National Association of Home Builders in the USA has stated that the average home in 1950 was 983 square feet, and by 2015 it had nearly tripled in size to 2,740 square feet! When you adjust for this fact, the actual increase in value per-square-foot of house is much smaller than the 3-4% number that is commonly tossed around in both Canada and the USA. Likely more in the 1.5-2% territory.
If you think that the last few decades have been the “golden age of Canadian real estate” then you might be surprised to find out that since 1982, Canada’s house prices have only gone up an average of 1.7% per year (vs an average inflation rate of 2.46%).
House values do NOT always go up : no matter what your friend in Toronto says. Go back and ask a Floridian in 2008 or a Calgarian in 2014.
Remember, these considerations are looking backwards at record return decades for Canadian real estate. We are now likely close to the top of that mountain (if not at the peak), so going forward …
Alternative investments to Canadian real estate: View our guide about Canada’s best dividend stocks if you want to learn more about beginner-friendly ways of investing your money into safe non-real-estate assets.
7) Freedom to Travel … Forever
Ok, so this one is likely somewhat unique to us.
I get that not everyone wants to spend years travelling without a fixed address.
That said, I think most Canadians would be amazed at how cheap it is to travel months on end if they don’t have to pay a mortgage back home, and don’t have to fly during the peak weeks of the year. I know that my wife and I were astounded when we went down the digital rabbit hole and found out just how many people were “slow travelling” 12-months per year for under $25,000 CAD.
I don’t think we’re quite as frugal as many of these veteran travellers, but after some pretty extensive research and many conversations with people actually living the “digital nomad” or “FIRE” lifestyle, we think we could pretty easily mix 6 months in relatively expensive countries like Canada, the USA, Western Europe, etc, with 6 months in cheaper countries centred on Eastern Europe and SE Asia, for $40,000 CAD.
2025 Update: My wife and I actually did this last year. We spent 3 months at our family cabin in rural Ontario, then went to Portugal for three months, Thailand for two months, Bali for a month and Japan for a month.
All-in, the price tag came in around $45,000. That includes many flights, an excellent cheap ticket on a Japanese cruise sale, several 3-to-5-day stays at luxury resorts, and several months in good-to-great Airbnbs. Financially, it was a success. It was a bit lonelier than we anticipated at times: but that’s not the math’s fault!
Beyond the obvious fun of seeing more of the world, we love the idea that we will get to spend more time with friends and family that don’t live close to where our 9-to-5 jobs were in rural Manitoba.
AirBnb and competing rental platforms have really changed the game when it comes to attempting to live this “no fixed address” lifestyle. With monthly discounts and competition keeping prices low, finding a place to live for 1-3 months has never been so convenient or affordable. If you want to be responsible for someone’s pets, there are even more affordable travel opportunities available!
Canadian Housing Prices in 2026 (How Expensive is Canada Really?)
After we wrote about gas prices in Canada a couple of weeks ago, I thought it might be useful to take a look at housing affordability in Canada for 2026.
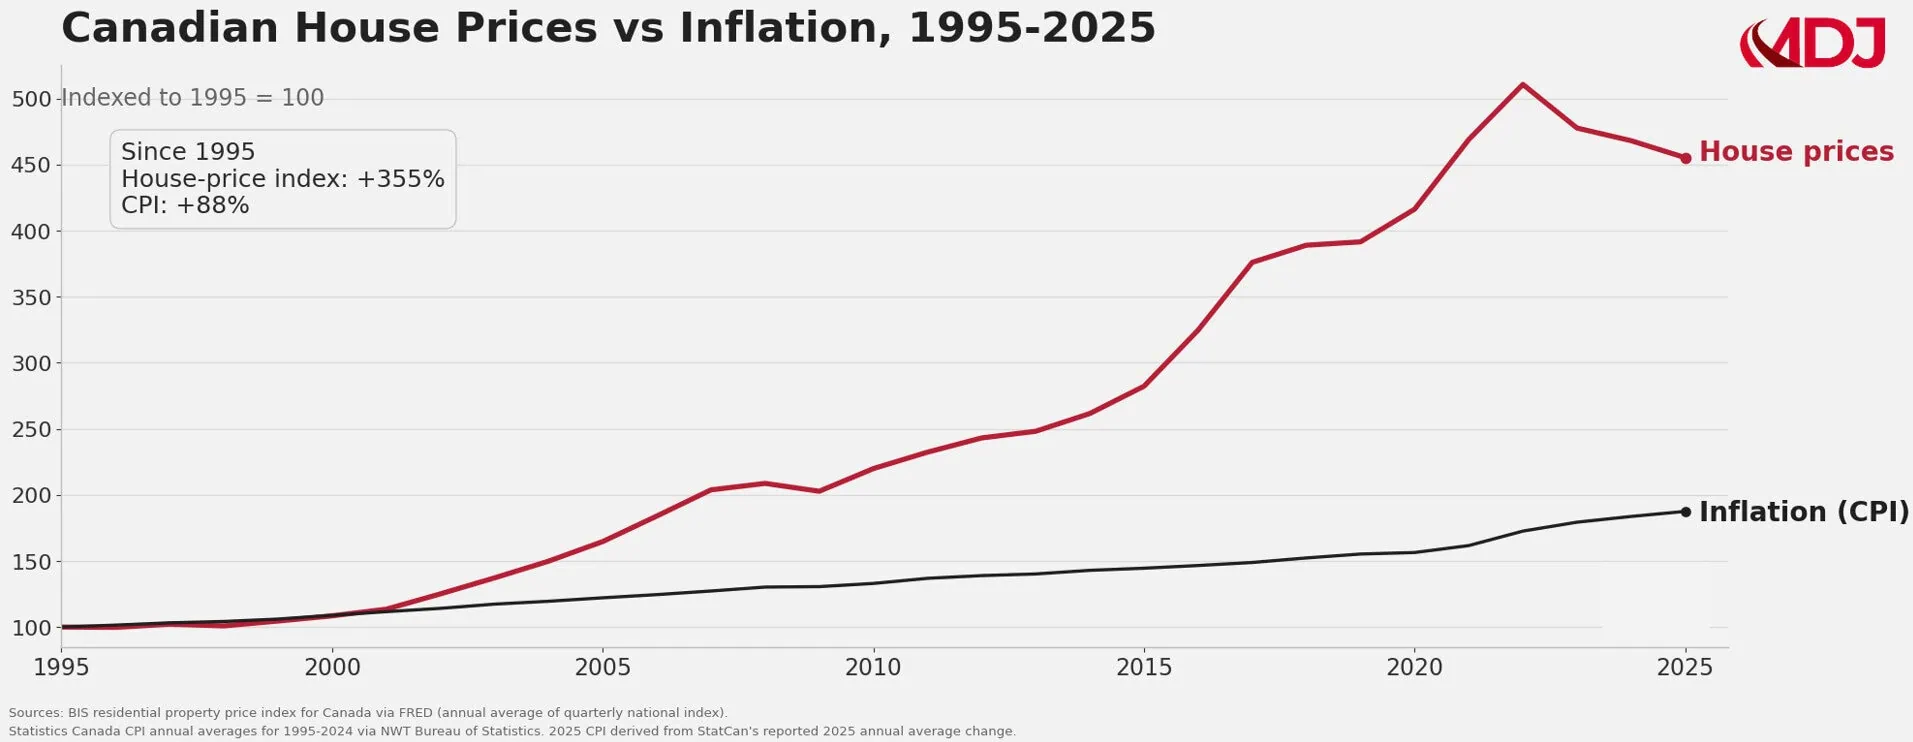
If you’re wondering just how expensive housing has gotten in Canada over time, you can take a look at the inflation-adjusted Canadian house prices charts below. The first one I put together to show just how much faster Canadian housing has went up relative to the average overall inflation (and don’t forget that housing is actually a pretty big part of the overall CPI basket as well, so that means that the gap between housing and “everything else” is actually larger than what you can see here.
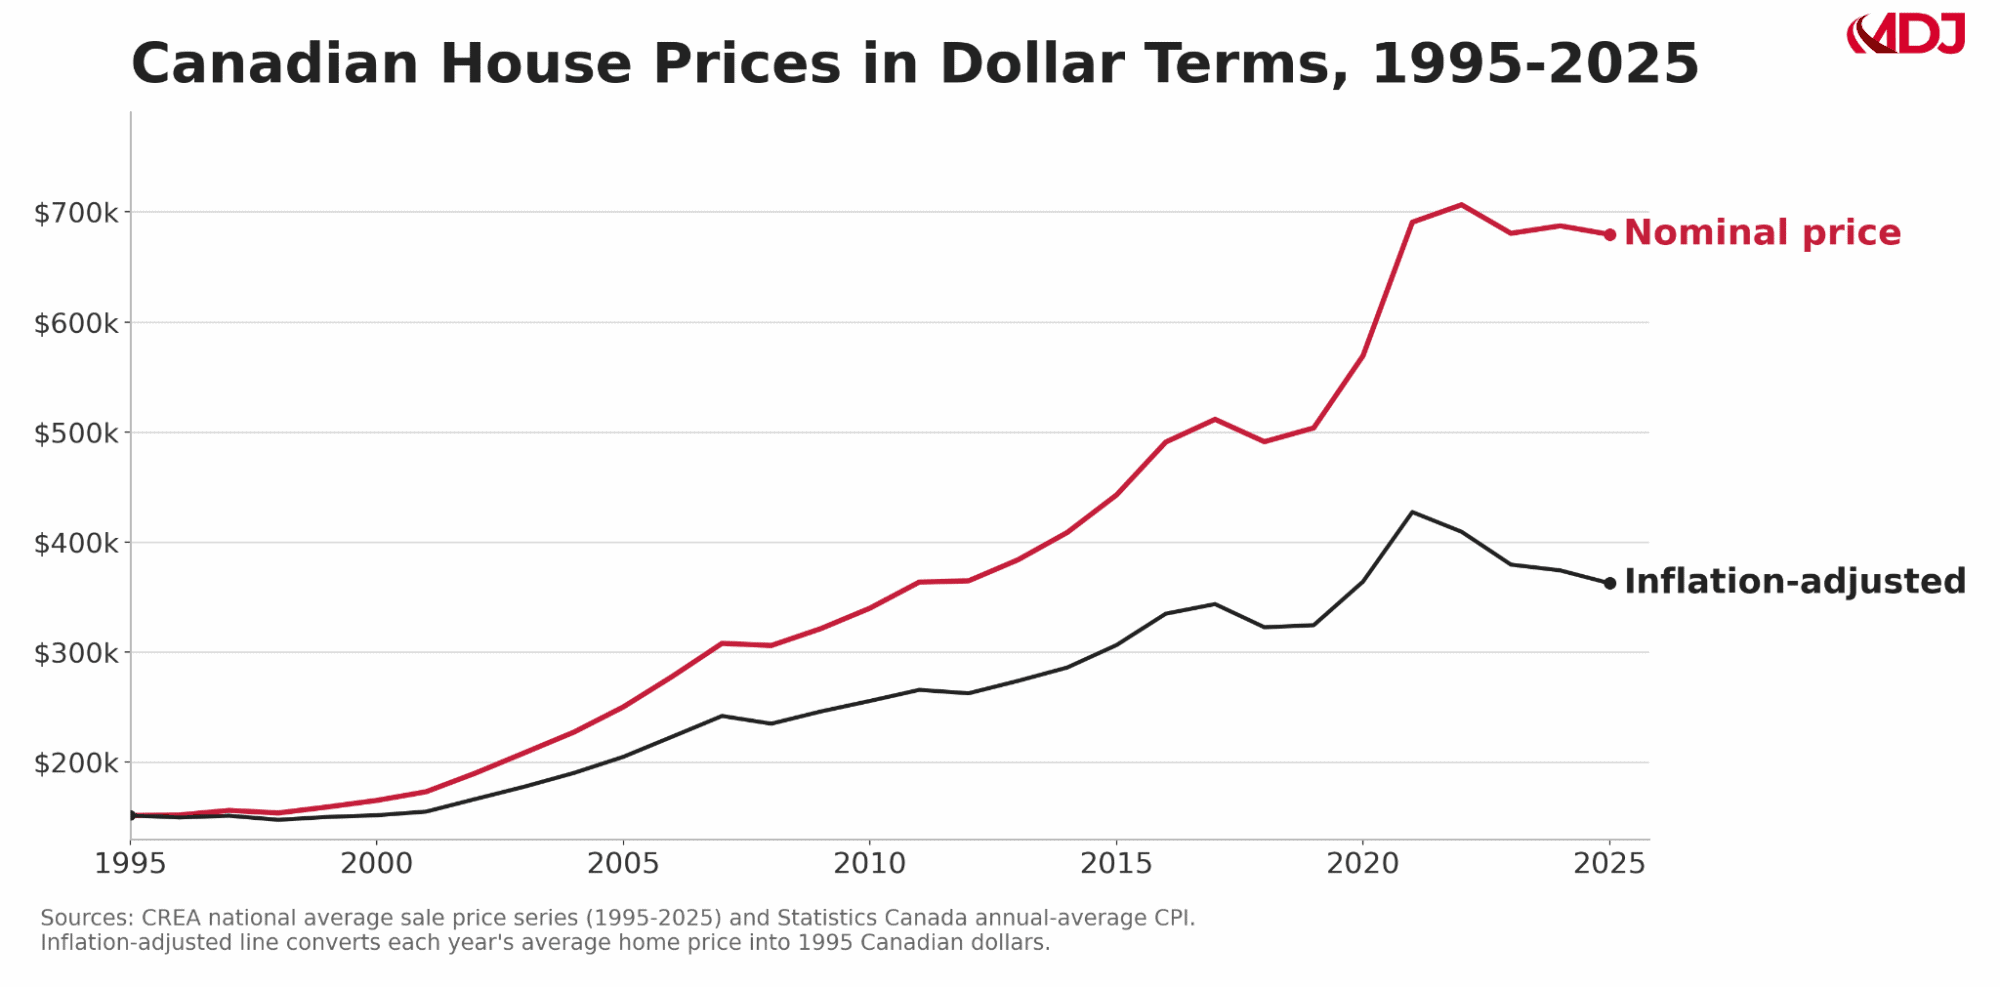
Then, I wanted folks to be able to see in real dollar terms just how expensive housing has gotten in Canada and why some folks call it a housing affordability crisis.
It’s pretty clear to see that the cost of living in the Canadian housing category has went up significantly in the last 20 years.
It’s also interesting to note that while Canadian real estate gurus like to say, “Oh the market is just taking a bit of a breather until it goes up again: it has hardly gone down at all.”
… That’s not exactly true in real-life.
Because inflation has been somewhat high the last few years, we see that in inflation-adjusted terms, Canadian housing has actually lost a substantial amount of value. When you compare that to the massive stock market returns of the last five years, I’d say my 2021 housing sentiment holds up pretty well!
The good news is that housing affordability in Canada has improved slightly in the last few years. The bad news is that the overall cost of living for the housing category is still way higher than it was even 20 years ago.
Canada Cost of Living: Housing Costs
I still think a lot of Canadians underestimate where their total housing costs come from. I have yet to meet a homeowner of more than a few years (who didn’t buy new) who thinks they only spend 1% in maintenance. I also think that we look at our mortgage payment and we don’t totally mentally calculate how much of that is interest.
Let’s take a quick look at a plausible home ownership case. Helen the Homeowner decides that she’s ready to take the plunge and buys a $700k house in a small Ontario city.
She has diligently saved up the 70K that she needs (making good use of her FHSA and RRSP). With 10% Helen is going to need a mortgage for nearly $650k because as a high-ratio insured mortgage, she is going to owe some extra. Here’s a rough idea of what her total housing cost of living will be over the next 25 years if she averages a 4.3% mortgage interest rate (pretty generous by historical standards). I’m keeping everything in 2026 dollars here for ease of comparison.
Down payment: $70,000
Home principal repaid: $630,000
Mortgage interest: $407,403
CMHC insurance premium: $19,530
Ontario tax on CMHC premium: $1,562
Property tax: $131,250
Home insurance: $37,500
Maintenance: $262,500
Ontario land transfer tax: $10,475
Total 25-year out-of-pocket cost: about $1,570,220
So for the first 25 years of home ownership, that works out to the following breakdown:
Home principal repaid: 40.1%
Mortgage interest: 26.0%
Maintenance: 16.7%
Property tax: 8.4%
Down payment: 4.5%
Home insurance: 2.4%
CMHC premium: 1.2%
Land transfer tax: 0.7%
Tax on CMHC premium: 0.1%
It’s interesting to note that the actual price of the home is significantly less than half of the total housing cost of living.
It’s OK to Own a Home – and It’s OK NOT to Own one Too!
It’s odd to say, but that makes it no less true: Owning your home in Canada is an emotional decision heavily tied to middle-class identity.
Because the decision is so important, no one likes to think that they chose the “wrong” path. Consequently, there are very few rational conversations to be had when it comes to home ownership. Like most issues that cut to the core of our identity, we usually choose our side, and then selectively look for arguments or data to support the decision we made.
I’ve been on both sides of the home ownership debate and the only thing that I can decisively say is that for some people owning a home makes sense: but for many others it simply does not.
Hey, if you are 80%+ sure that you’re going to be rooted in the same area for 10+ years, and you derive a lot of enjoyment out of handyperson fixes/renos, then the benefits of home ownership might make it the perfect choice for you.
That said, judging by all the “buy at all costs” talk I continue to hear from coast-to-coast, I think we really need to examine the bigger picture when it comes to home ownership.
2026 Update: Very little has changed since 2021 that has led me to change my thinking on rent vs buy. You can see in the comments below that it hit a major pain point for a lot of folks (as I predicted it would). While rent and housing prices remain fairly stagnant in most markets since 2021 (and have actually decreased relative to general inflation).
At the end of 2020, the S&P 500 was at USD$3,756 and the TSX 60 was at CAD$1,034. As of writing this update they are at $7,126 and $1,996 respectively. Good for a stock market gain of 90% and 93% respectively. Once you factor in that the S&P 500 would have spun off a dividend of a little less than 2%, and the TSX 60 would have rewarded you with 3%, the case for stocks gets even stronger.
Now, who knows, the next five years could look much different, but I’m going to take a victory lap on this controversial article for the time being!
Kyle Prevost is a financial educator, author and speaker. When he’s not on a basketball court or in a boxing ring trying to recapture his youth, you can find him helping Canadians with their finances over at MillionDollarJourney.com, and the Canadian Financial Summit.The newly updated version of this blog appeared on MillionDollarJourney on April 24, 2026. It has been slightly edited and is republished on Findependence Hub with permission.
By Dale Roberts, CutTheCrap Investing, Retirement Club
Special to Financial Independence Hub
Schwab’s SCHD is a popular U.S. dividend ETF that has been disappointing investors for a long time. Does that disappointment mean that the fund is going to shine when (if) the AI bubble bursts? And speaking of shining, we’ll take a look at gold. Can it go even higher? Plus, Canada’s most defensive sector ETF has a surprising history of outperformance.
What to expect from the U.S. stock market over the next 10 years? Not much.
Once again, having lived through it, and invested through it I remember:
He pointed to a JPMorgan chart from late last year that looked at what an investor’s annual return on average over the next 10 years would be if they had bought S&P 500 at a given price/earnings ratio. The P/E was 23 at the time, meaning that average return would be 2% to minus 2%, he said.
Of course there are other lost decades, such as the Depression era and the stagflation era of the late 60s into the early 8’s. But don’t worry: it was all ‘easily handled by a balanced portfolio with some inflation protection. We call that an all-weather portfolio of course.
Even a 5% allocation to gold during the stagflation era would have allowed you to breeze through the period. Add in oil and gas stocks and yer laughing.
That portfolio idea (not advice) uses defensive sectors in concert with dedicated inflation fighters.
Is SCHD well-positioned for a dot.com-like correction?
I’ve penned extensively on the concept that retirees might pay attention to valuation issues and hedge that risk with a U.S. value-oriented holding. We’d continue to hold some U.S. market or U.S. growth, but layer in a value holding. The Schwab Dividend ETF SCHD is a popular choice. What’s up with SCHD? Or what’s down might be the appropriate question.
I created a meaningful position in iShares Quality Dividend ETF XDU-T (Canadian Dollars) as a valuation slant. It outperformed SCHD in 2024 and that continues in 2025. In price terms SCHD was down 1.7% in 2025 while XDU-T was up 4.4% (at time of writing late in October 2025). We might attribute about 2% of that gain to the Canadian currency weakness vs the U.S. Dollar.
The S&P 500 was up 13.66% in 2025. The Nasdaq 100, QQQ was up 18.36%. Money continues to flow to growth-oriented stocks in the U.S.
This article on Seeking Alpha (sign up or sub required) suggests that SCHD might be well-positioned if we do get a major correction and rotation to value and quality.
The top 3 sectors for SCHD were leading sectors when the dot com bubble burst …
That chart tracks Energy, Consumer Staples and Healthcare vs Tech.
Who knows, but SCHD’s stubborn decline might be creating even greater value. Here’s an interesting table on sectors and valuation.
worldperatio.com
In the search for value you might also consider small cap, or mid cap or a classic value index ETF such as iShares VLUE. As I wrote for Findependence Hub, these might be challenging times for recent retirees who do not pay attention to valuation. You’ll find more bubble-bursting ideas in that post 😉
Accumulators with decades to go might ignore the valuation “issue.”
I’m happy with XDU and some of my other U.S. value-oriented stocks. In my U.S. RRSP account, my individual U.S. stock portfolio was up 20.7% in 2025 (again, as of time of writing). The core stocks are still driving the bus.
For years, I have been telling friends: “Just buy the market, don’t waste your time with individual stocks.”
The problem is that most of them don’t know what I am talking about, and to be honest, sometimes I don’t know what I am talking about either. Because not all “markets” are created equal. They don’t behave the same way, and they aren’t all appropriate for every investor.
Today, I will talk about the three primary markets people discuss, how each one behaves, and how a regular Canadian can choose between them. Those three markets are:
QQQ, the
S&P 500, and the
TSX index.
Once you understand the differences, you will be able to judge which is a better fit for your portfolio and where they should be placed.
Higher Returns always come with Higher Risk
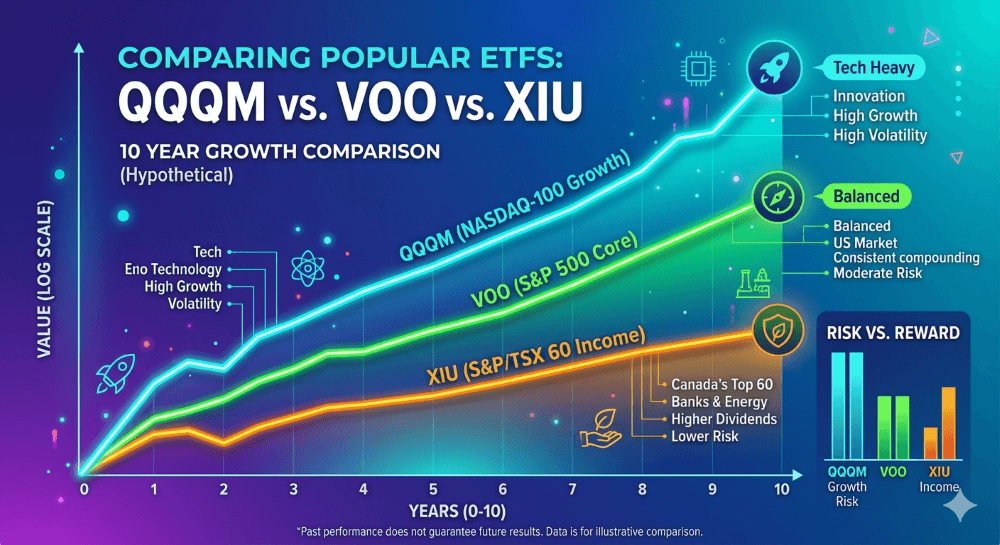
If we stack our three indexes on a risk-return basis, this is what we get:
QQQ has the highest returns and the highest risk.
The S&P 500 is less risky and has lower returns than QQQ.
The TSX has lower returns than the S&P 500 but offers different sector exposure.
My preferred ETFs to buy these indexes are:
For QQQ: I like an ETF called QQQM.
For the S&P 500: I like VOO.
For the Canadian TSX: I like XIU.
For your information, there are different ETF which cover the same indexes. I like the above mentioned because they have low management fees, they are highly liquid, and they have a good reputation.
To give you an idea of the difference in total returns for these three investments over the past 10 years (approximate):
This is why the returns are high; most of these companies’ business models are scalable globally. But be careful: in a single year, the QQQ was down 32.58%. You need a strong stomach to tolerate a drop of that magnitude.
VOO: The S&P 500 Standard
The S&P 500 is composed of the 500 largest corporations in the U.S. The risk is lower than QQQM because it is diversified across many industrial sectors.
Annualized return: About 14%.
Highest annual return: About 31%.
Lowest annual return: About -18%.
XIU: The TSX for Canadian Patriots
XIU is composed of the 60 biggest Canadian companies.
Dominated by banks, oil, and mining.
Higher dividend yield than the U.S. indexes.
Lower long-term growth potential.
Risk vs. Reward Table
Index
Returns
Risk
Role
QQQ
Highest
Highest
Aggressive Growth
S&P 500
Strong
Moderate
Core Portfolio
TSX
Lower
Cyclical
Income & Diversification
Summary: QQQ makes you rich faster (and scares you more); the S&P 500 makes you rich steadily; the TSX pays you while you wait.
How should a Canadian Investor use this Information?
Everything in this account grows tax-free. This is the place for your highest-return investments. If you make a 100% return, it is 100% tax-free.
Best for: QQQM or high-growth individual stocks. You keep all capital gains; $0 goes to the government.
2. RRSP (Registered Retirement Savings Plan)
Capital gains and dividend income are tax-deferred until you withdraw the money. Furthermore, there is no U.S. withholding tax on dividends in an RRSP. Normally, the IRS imposes a 15% tax on dividends paid to non-residents, but the Canada-U.S. tax treaty waives this for the RRSP.
Best for: VOO (S&P 500) or any U.S. dividend-paying stocks.
3. Non-Registered Account (Taxable)
Once you hit your TFSA and RRSP contribution limits, you use a regular investment account. In Canada, domestic dividends receive favorable tax treatment through the Dividend Tax Credit.
Best for: XIU (TSX Index) or Canadian bank stocks that pay regular quarterly dividends
RRSP → S&P 500 / U.S. equities (Avoid U.S. withholding tax).
Non-registered → Canadian dividend stocks (Utilize Dividend Tax Credit).
Final Thought: Stop looking for the “Best” Index
There is no single “best” index. There is only the one that matches your risk tolerance, time horizon, and emotional discipline. QQQ will outperform until it doesn’t. The TSX will lag until commodities surge. The S&P 500 will quietly compound in the background. The real edge isn’t picking the winner—it’s understanding why each one wins at different times and positioning yourself accordingly.
Frequently Asked Questions (FAQ)
Which is better for Canadians: VOO or XIU? It depends on your goal. VOO (S&P 500) offers higher historical growth and U.S. tech exposure, while XIU (TSX 60) offers higher dividends and stability through Canadian banks and energy.
Why should I hold U.S. stocks in my RRSP instead of my TFSA? While both are great, the RRSP is uniquely exempt from the 15% U.S. withholding tax on dividends. If you hold a U.S. dividend-payer in a TFSA, the IRS takes 15% before you see it.
Is QQQM the same as QQQ? Essentially, yes. They track the same index (Nasdaq-100), but QQQM has a lower management fee, making it better for long-term “buy and hold” investors.
What is the “Dividend Tax Credit” for Canadians? It is a tax incentive that reduces the amount of tax you pay on dividends received from taxable Canadian corporations, making the TSX very attractive for non-registered accounts.
Alain Guillot is a part time event photographer, part time Salsa teacher, and part time personal finance blogger. He came to Quebec as an immigrant from Colombia. Due to his mediocre French he was never able to find a suitable job, so he opened a Salsa/Tango dance school and started his entrepreneurship journey. Entrepreneurship got him started into personal finance and eventually into blogging. Now he lives a Lean FIRE lifestyle and shares his thoughts in his blog AlainGuillot.com. This blog appeared first on his blog and is republished here with permission.
Second Quarter 2026 BMO Macro Regime Model – Strategy Report
By Bipan Rai, BMO ETF & Structured Solutions
(Sponsor Blog)
Upon reflecting on the current state of markets, we’re reminded of the lessons from Barbara Tuchman’s The Guns of August, which illustrates how hubris and rigid systems can override rational decision-making.
While we are not drawing direct parallels to the current situation in the Middle East, the book offers important lessons for investors as they navigate portfolio construction in the months ahead.
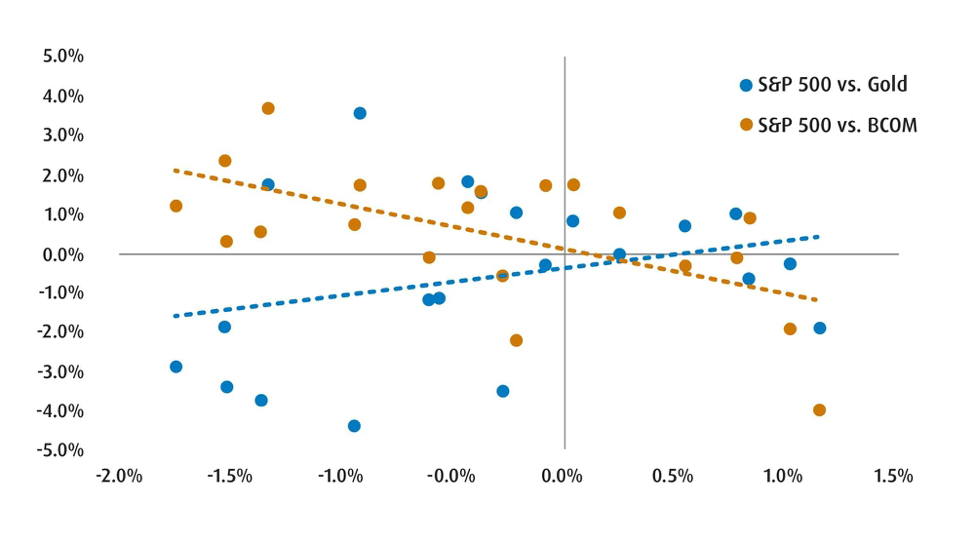
As an example, periods of higher inflation generally increase the co-movement between U.S. stocks and interest rates, requiring a more pragmatic approach to diversification. This often leads to greater interest in real assets like gold, as we’ve seen in recent years.
But what happens when even gold fails to provide adequate diversification during a geopolitical shock? Tuchman’s work reminds us of the importance of stress-testing assumptions before a crisis unfolds. When correlation structures break down and traditional hedges falter, investors who have considered tail risks in advance are better positioned.
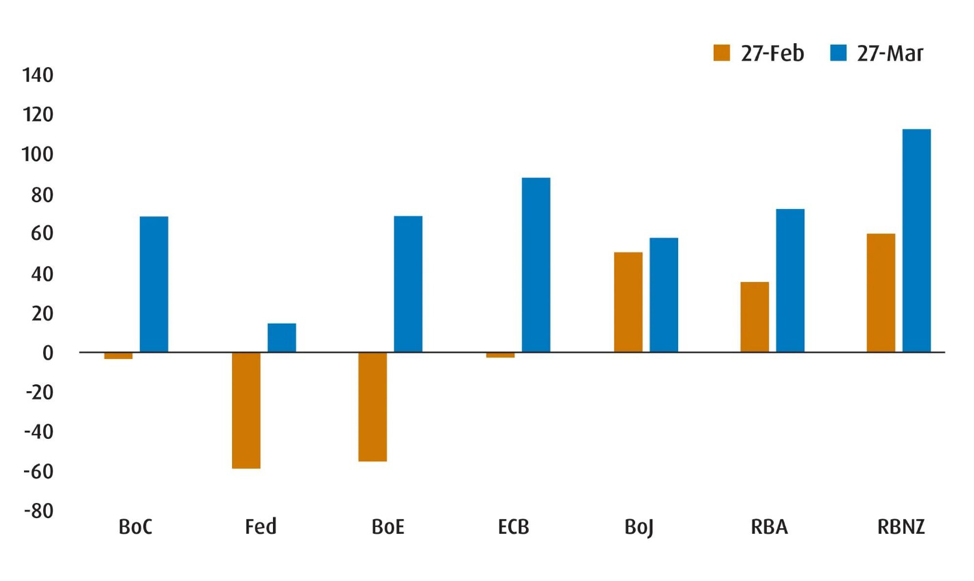
With that in mind, let’s consider the present environment. Even if the Middle East conflict is resolved quickly, the economic and market consequences will likely persist. Inflation risks are no longer symmetrically distributed, and price pressures appear likely to rise. Damage to energy-related infrastructure points to a prolonged period of crude oil and LNG supply disruption, pushing prices higher for longer. This affects refined products (such as gasoline, jet fuel, and kerosene), fertilizer production, and the supply of helium: complicating central bank messaging. Markets have responded by pricing out expected Federal Reserve rate cuts and pricing in aggressive hikes for other developed-market central banks (Chart 1).
Chart 1 – Markets Have Priced in Tighter Central Bank Policy by End-2026
Source: BMO Global Asset Management, as of March 27, 2026.
At the same time, growth risks are shifting in the opposite direction. Higher input costs act as a tax on consumers and weigh on corporate margins. The speed at which rising energy prices feed into slower growth depends largely on a country’s economic slack, which explains why some central banks have recently acknowledged growth risks more explicitly than they did in early 2022.
Indeed, our own proprietary macro regime model is signaling that we are transitioning from a ‘reflation’ backdrop to a more stagflation-like regime (Chart 2).1 This emerging stagflation regime need not mirror the 1970s, but we are still positioning our portfolios to be more robust and resilient. We’re broadening our commodity exposure to provide a more direct hedge against supply shocks. In an environment where inflation surprises are more likely to be positive, this type of convexity is valuable.2
We are also allocating to front-end TIPS (Treasury Inflation-Protected Securities) as a hedge against inflation pressures. While breakevens3 have moderated with recent disinflation progress, they do not fully reflect a sustained energy shock. TIPS offer a cleaner way to express inflation risk without requiring a strong view on nominal growth.
Within equities, we are tilting toward quality and low volatility. If growth slows while cost pressures persist, companies with strong balance sheets, durable margins, and stable cash flows should outperform more cyclical or highly leveraged peers. Low-volatility exposures can also help reduce drawdowns during headline-driven market swings.
History teaches us that conflict does not guarantee crisis. But periods of stress often reveal underlying fragilities. Our role as stewards of capital is not to forecast every geopolitical development, but to recognize that the distribution of macro outcomes is tilting toward a stagflation-like environment: and to position portfolios accordingly.
Chart 2 – Broad Commodity Exposure is Now a Better Diversification Strategy than Just Relying on Metals
Source: BMO Global Asset Management, Bloomberg. Daily returns from February 27 to March 27.
Asset Allocation
Relative to the Q1 edition, we’re making some modest changes to our asset allocation splits. The most notable shifts are that we are paring our positions in the equity and alternative sleeves and reallocating them towards fixed income. Of course, these aren’t big changes: as we still remain underweight fixed income and overweight both equities (slightly) and alts.
Our macro regime model suggests that we are in the midst of a transition from reflation to stagflation: characterized by low growth and high inflation. This is still consistent with the late cycle feel of the macroeconomic backdrop.
Despite the challenging backdrop, the underlying fundamentals remain sound enough to maintain a neutral/slightly overweight broad equity position for now. Ahead of the conflict, we did see earnings growth across several sectors in the U.S. and Canada. At the same time, the situation in the Middle East remains fluid, which requires us to be nimbler and more flexible.
In the fixed-income sleeve, the increase in weight reflects our view that the Canadian yield curve4 provides better value and that we feel U.S. TIPS should outperform in the months ahead. For the alts sleeve, the reduction in weight reflects our shift away from gold and towards a broader set of diversifiers in the commodity and infrastructure spaces.
Importantly, we are bullish on the U.S. dollar (USD) for the coming months. This means that our preference is to keep our U.S. exposure unhedged on a tactical basis. The main reasons for this view are the following:
We expect the CAD swaps market to price out rate hikes for the Bank of Canada in 2026.
We expect USD upside as net long positioning remains relatively light.
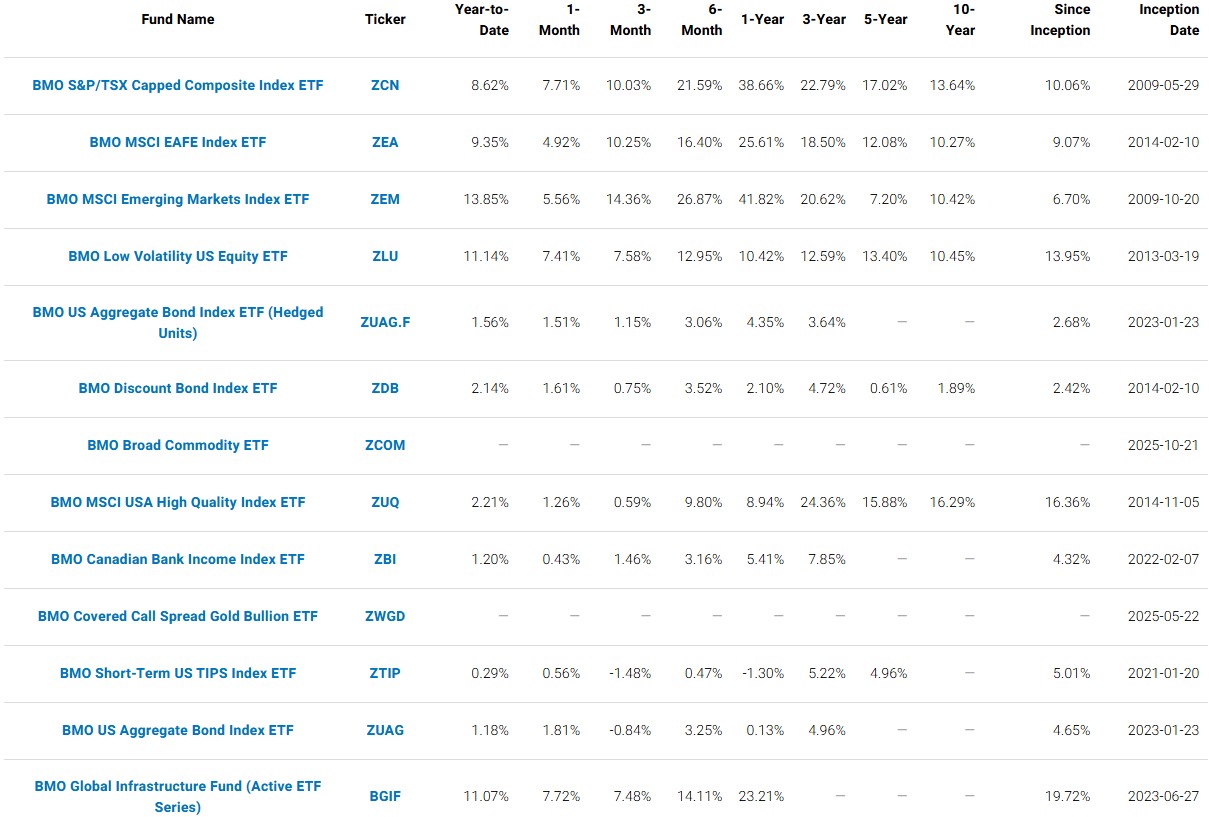
Equities
We are increasing our allocation to ZCN (BMO S&P/TSX Capped Composite Index ETF)as Canada remains well positioned as a commodity and energy producer. With energy prices supported by ongoing geopolitical uncertainty, the Canadian equity market should continue to benefit, though outcomes will remain sensitive to the duration of the conflict in the Middle East.
For our U.S. position, we are adding ZLU (BMO Low Volatility US Equity ETF)to complement our existing exposure through ZUQ (BMO MSCI USA High Quality Index ETF). This combination reflects a preference for defensive characteristics and earnings resilience during a period whereby investors remain selective on valuation and fundamentals.
We’ve also added ZTIP (BMO Short‑Term US TIPS Index ETF)as a tactical position as we expect inflation risks to stay firm given energy and broader commodity pressures.
Alts/Hybrids
The most notable change we’ve made in Alts/Hybrids is adding a tactical allocation to ZCOM (BMO Broad Commodity ETF)to broaden our inflation and geopolitical hedge. Energy has led performance on a year‑to‑date basis, but a persistent risk premium can support a wider set of commodities, which improves diversification if equity volatility picks up.
We’ve also upgraded the weight for BGIF (BMO Global Infrastructure Fund ETF)as we continue to constructive on infrastructure, including electric grids, and engineering/construction projects.
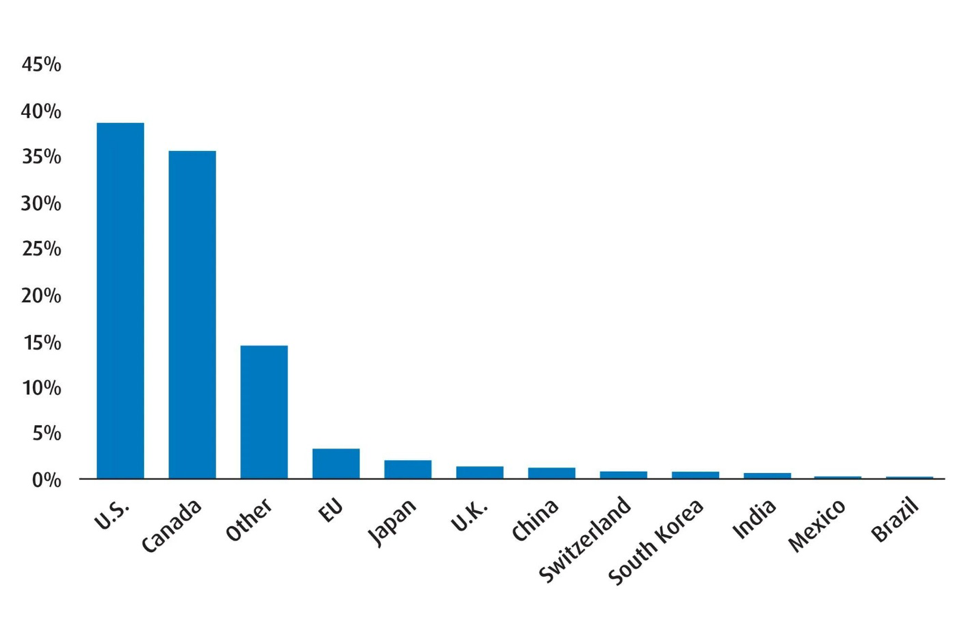
Chart 3 – Q2 2026 Regional Exposure
Source: BMO Global Asset Management, as of March 31, 2026.
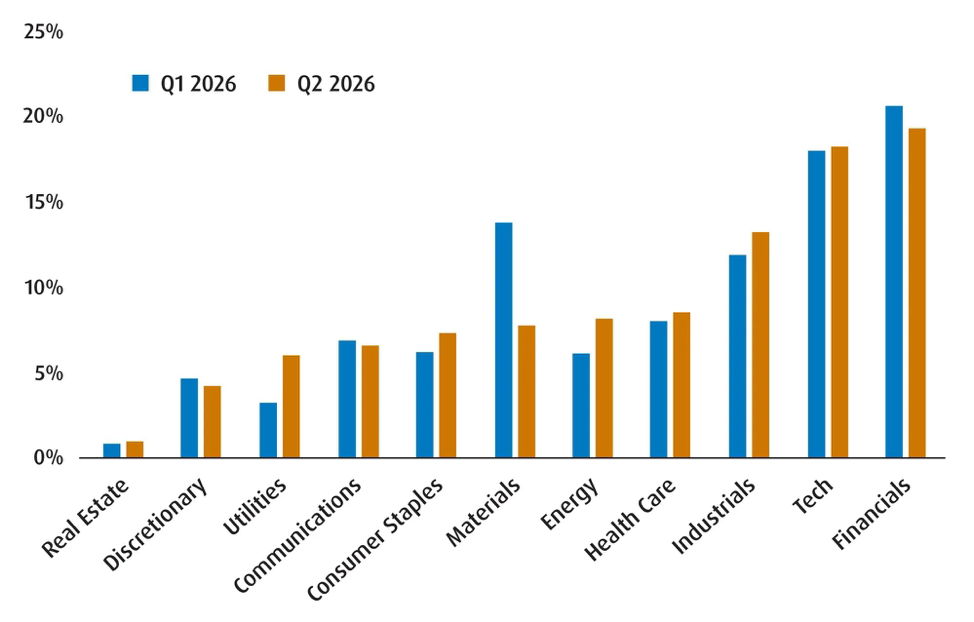
Chart 4 – Global Equity Sector Breakdown
Source: BMO Global Asset Management, as of March 31, 2026.


 Noah Solomon is Chief Investment Officer for Outcome Metric Asset Management Limited Partnership. From 2008 to 2016, Noah was CEO and CIO of GenFund Management Inc. (formerly Genuity Fund Management), where he designed and managed data-driven, statistically-based equity funds.