
By Hussein Rashid, Invesco Canada
Special to the Financial Independence Hub
2020 was a year for the history books: especially from a finance perspective. With COVID-19 ripping throughout the globe, we saw equity markets decline rapidly as several countries closed their borders.
At the same time, however, we saw some companies flourish as people spent more time at home. Companies like Apple, Microsoft, and Google1 shined brightly and became larger than ever before. Central banks globally introduced measures that aided this appreciation by reducing rates to record lows, fueling most growth-oriented stocks upward at a rapid pace.
However, over three months into 2021, we are now seeing signs of recovery towards normalcy, with continued supportive measures by many central banks and governments, along with a growing number of people being vaccinated.
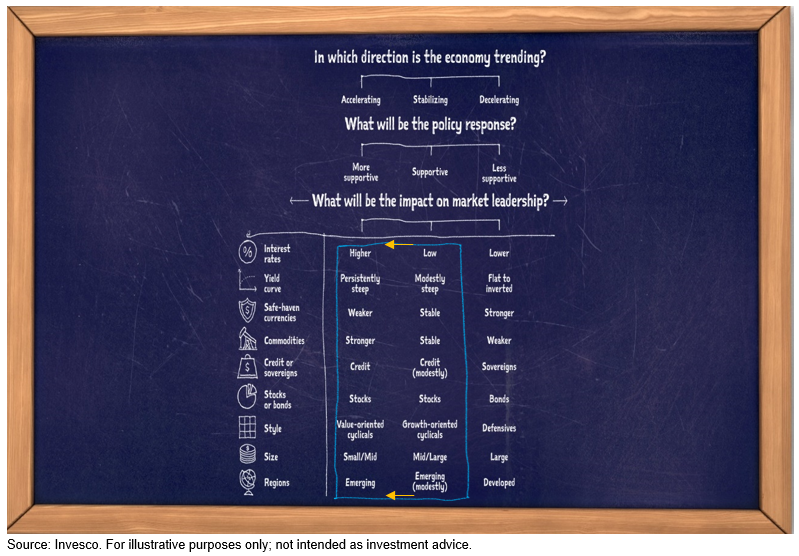
So, what does that look like from a market leadership perspective? As the recovery unfolds and economic activity accelerates, we would expect market leadership to align with that of the left column of the chart above.
We have already seen a steepening yield curve with longer-dated bond rates rising: this could temper the strong run up in growth-oriented stocks. Near the end of last year, the move from growth stocks to more value-oriented cyclical stocks, and the move from large-cap stocks to small/mid-cap stocks started to occur. Many of these stocks, especially names in the S&P 500®, will tend to benefit more from the economy and society reopening.
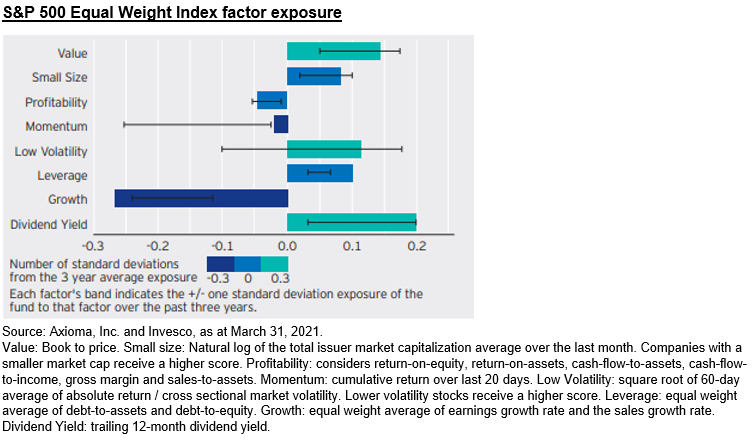
We take a look at the S&P 500® Equal Weight Index with respect to this reopening and potential for economic recovery. By equal-weighting the S&P 500®, one aims to remove the biases to the mega-cap names (like Apple, Microsoft, Google) and allocates more to the rest of the index constituents. This inherently gives more exposure to the smaller names in the S&P 500®, along with increased exposure to value-oriented sectors.
Historically, equal-weight indexing has provided outperformance during periods of recovery, relative to the broader market-cap weighted S&P 500® Index. In significant down periods, like the global financial crisis and tech bubble, the S&P 500® Equal Weight Index saw significant outperformance after the trough.
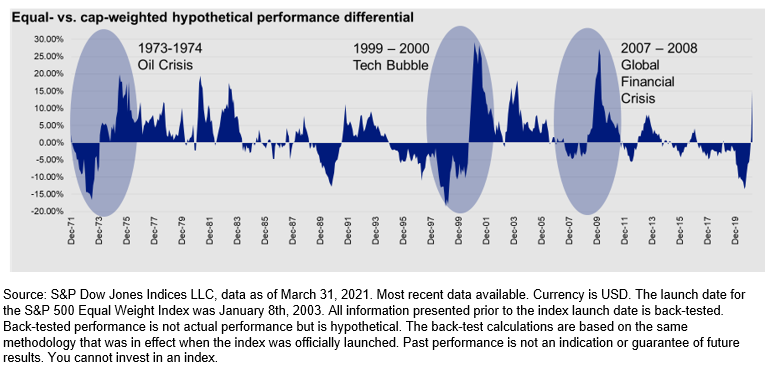
The chart above shows historical 12-month rolling excess return of the S&P 500® Equal Weight Index and the S&P 500 ® Index. After the significant decline from the tech bubble and global financial crisis, the S&P 500 ® Equal Weight Index showed significant excess return, as cyclical stocks, along with smaller names in the index, outperformed the mega-cap stocks in the index.
1 The above companies were selected for illustrative purposes only and are not intended to convey specific investment advice.
 Hussein Rashid is Vice President, ETF Strategist, for Invesco Canada, focused on the firm’s Canadian lineup of exchange-traded funds (ETFs) and index-based mutual funds. His areas of expertise include smart beta indices and factor investing as well as ETF portfolio implementation, liquidity and trade execution. Mr. Rashid began his career in the financial industry in 2010. Previous to his current role, he held various positions within product management and ETF capital markets at Invesco Canada. He earned a BBA (Hons.) in Management from the University of Toronto and holds the Chartered Financial Analyst designation. This blog originally appeared on Indexology on May 10, 2021 and is republished with permission.
