

By Hamilton ETFs
(Sponsor Blog)
Technology plays a central role in driving innovation, productivity improvements, and long-term economic growth, making technology companies a core component of many equity portfolios. However, how investors access technology exposure can meaningfully influence long-term outcomes.
Not all tech ETFs provide the type of exposure investors might expect. Many traditional technology indices rely on market-cap weighting, which focuses on company size rather than business quality. This can lead to meaningful exposure to companies with high valuations but less proven business models, while also concentrating portfolio risk in a small number of large stocks. The HAMILTON CHAMPIONS™ U.S. Technology Index ETF (QMVP) was launched to address these challenges by providing exposure to the most profitable U.S. technology companies, while managing concentration risk, all at a low annual management fee of 0.19%.
Outperformance from Tech Champions
QMVP tracks the Solactive HAMILTON CHAMPIONS™ U.S. Technology Index (“Tech Index”), which was designed to identify “Tech Champions,” the most profitable companies whose businesses are fundamentally driven by technology. By emphasizing profitability and managing concentration risk through a modified market cap-weight exposure[1], the Tech Index seeks to capture the long-term growth of the sector in a more balanced way.
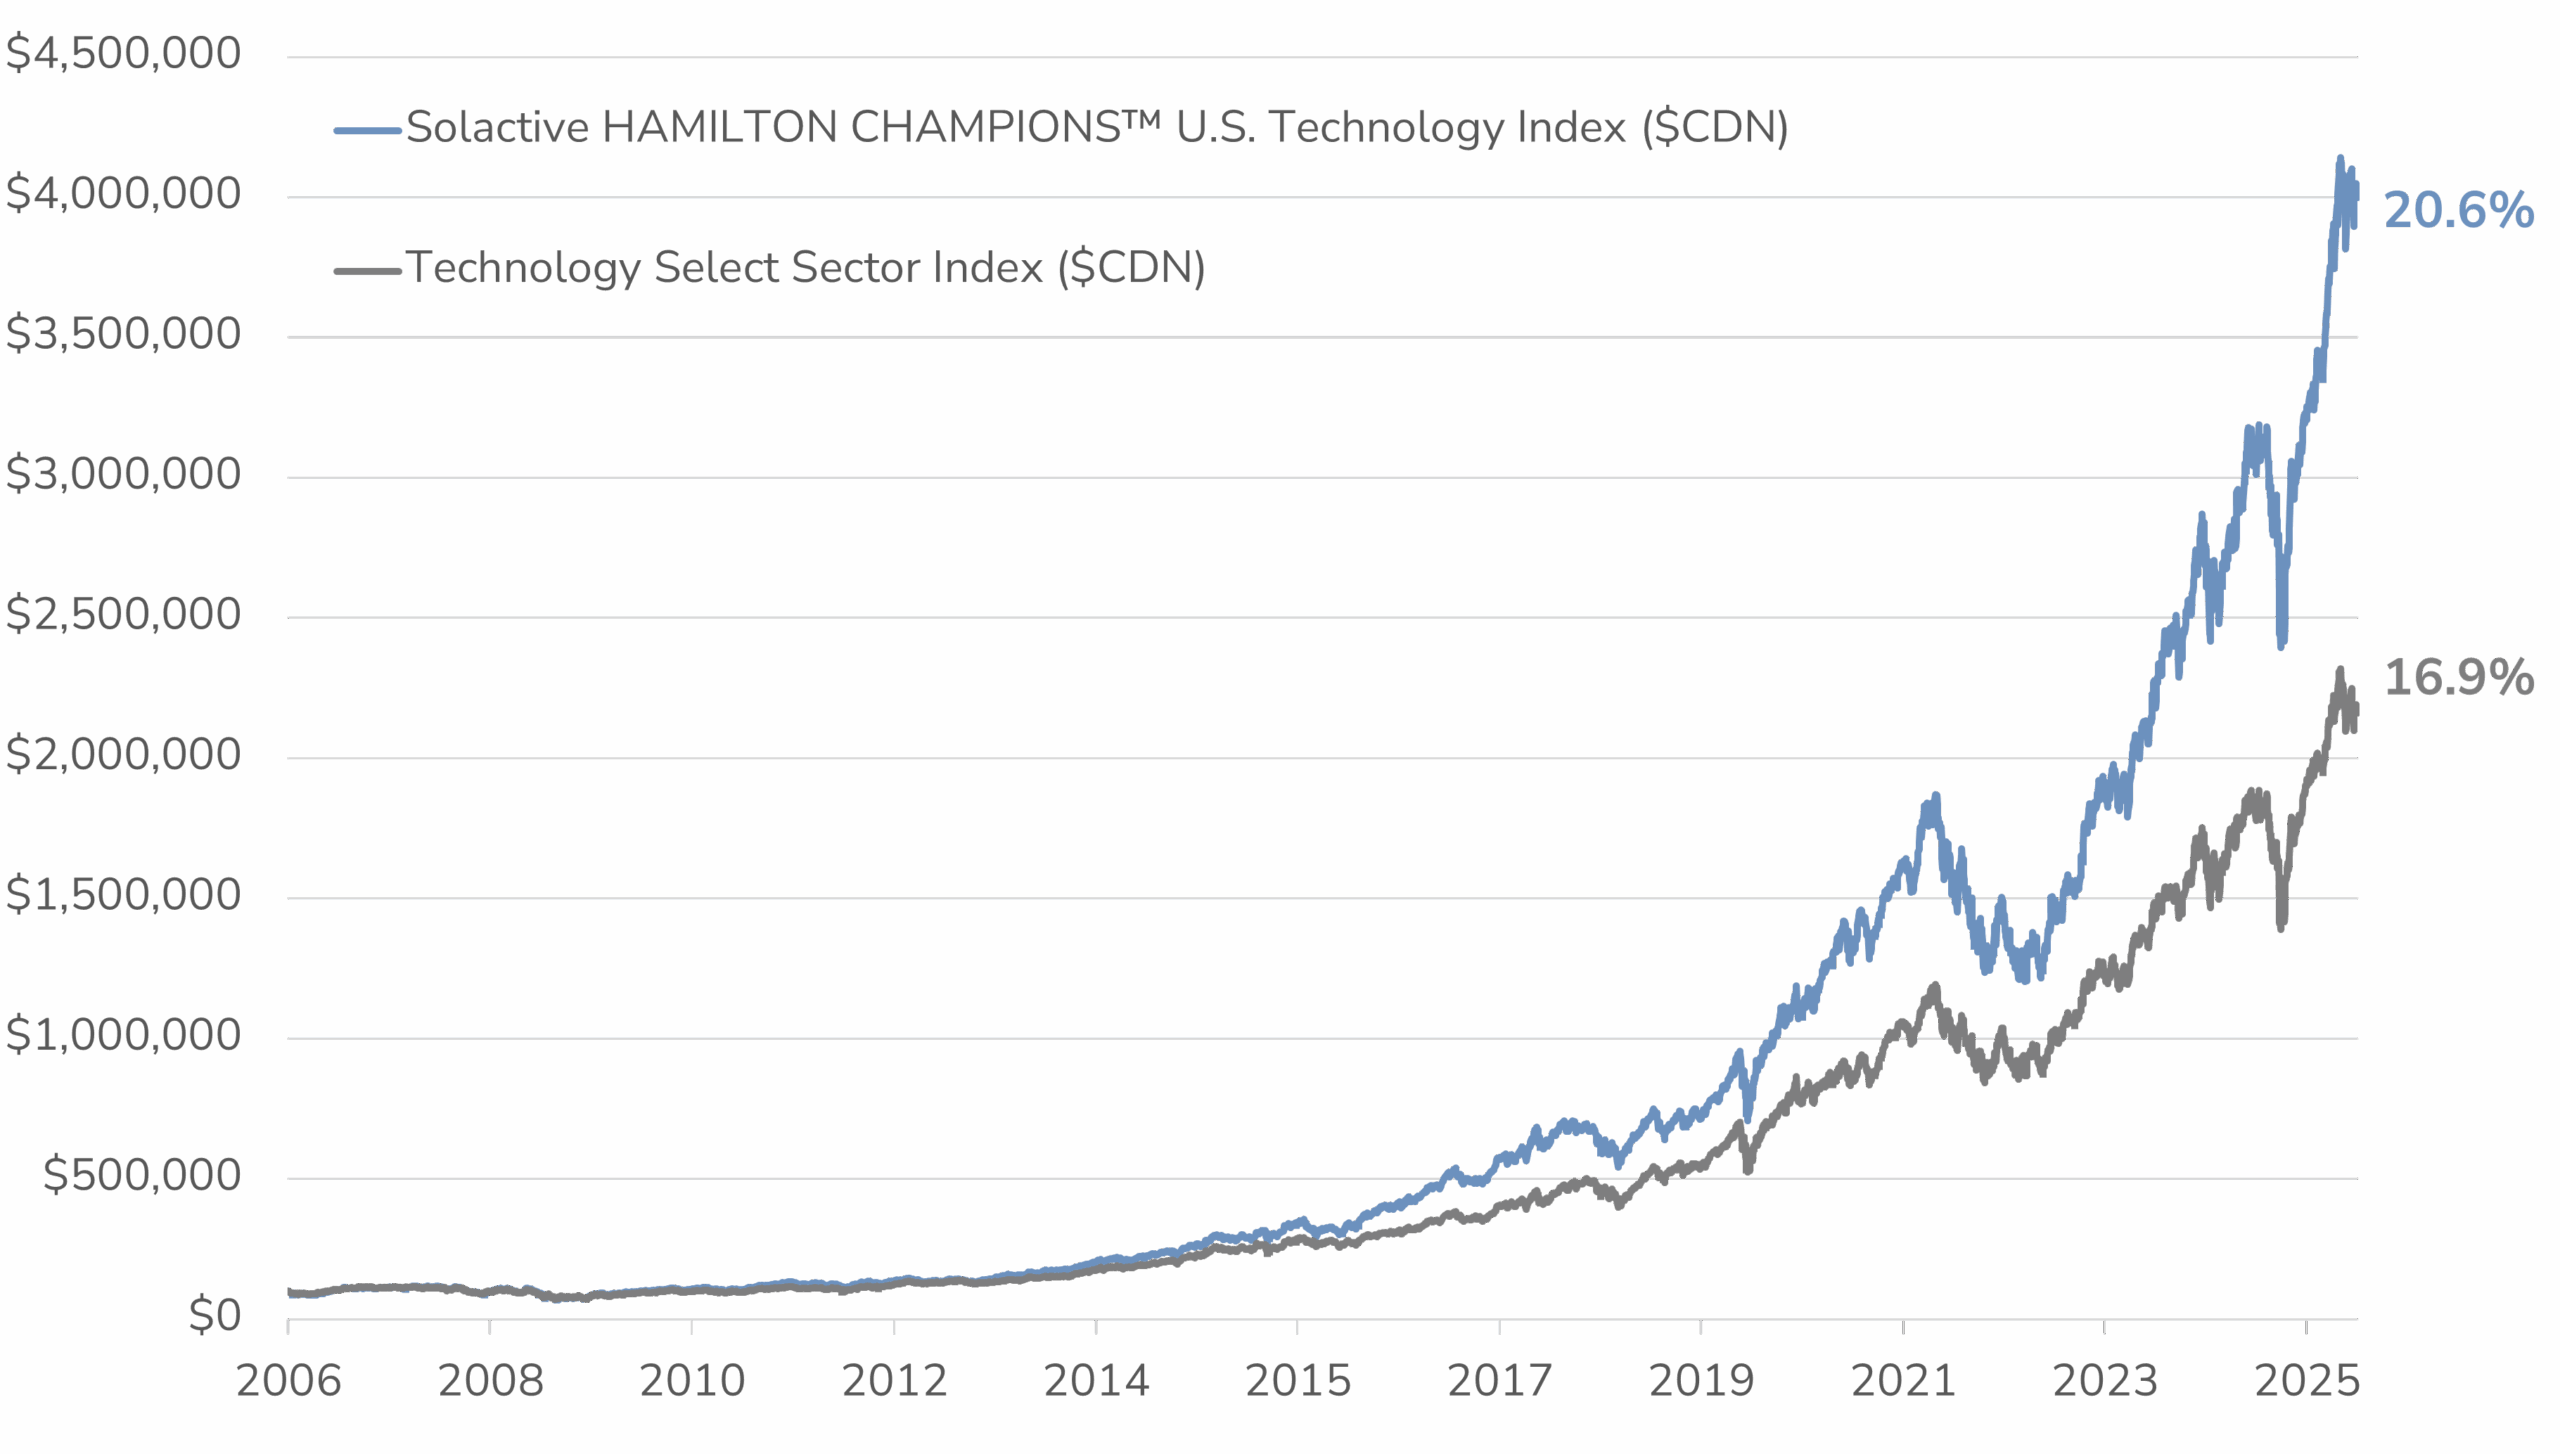
Historically, this approach has led to strong performance. The Tech Index that QMVP tracks has shown significant outperformance relative to the Technology Select Sector Index, illustrated by the growth of $100,000 invested since inception in 2006.
QMVP — Index Outperformance[2]
Building a Better Tech Index
The Tech Index was built around two core principles:
- An emphasis on profitability, which tends to favour large, established technology companies with proven business models.
- Management of concentration risk, limiting overreliance on a small number of large holdings.
Emphasizing Profitability over Size
Most technology indices, including the Technology Select Sector Index, are market-cap weighted, meaning companies with larger market values represent a greater share of the index. As a result, companies with high valuations may receive significant representation regardless of how profitable their businesses are.
The Tech Index behind QMVP takes a different approach by selecting U.S. tech companies with the highest gross profits, emphasizing established businesses while excluding more speculative names with high valuations but limited earnings history.
Managing Concentration Risk
In addition to which companies are selected, how they are weighted within an index can meaningfully affect portfolio performance and risk. Traditional market-cap weighted technology indices are often heavily influenced by a small number of mega-cap stocks, resulting in concentrated exposure to just a few names.
The Tech Index behind QMVP is designed to manage this risk through a modified market-cap weighting approach, with individual holdings weighted between 2% and 6% at each quarterly rebalance. This structure helps prevent overreliance on any single company and promotes a more balanced technology allocation.
Where QMVP Fits in a Growth-Focused Portfolio
We believe QMVP can serve as a low-cost, core U.S. technology holding for investors focused on long-term growth, offering a more disciplined way to invest in technology today.
Within a diversified equity portfolio, QMVP can complement broad market ETFs and other growth-oriented allocations by providing focused exposure to U.S. technology companies, at a low management fee of 0.19%.
Portfolio Snapshot: U.S. Tech Champions
____
[1] The modified market-cap weighting approach weights individual holdings between 2% and 6% at each quarterly rebalance.
[2] Source: S&P Global, Solactive AG, Hamilton ETFs. Data from May 8, 2006, to December 31, 2025.
The graph illustrates the growth of an initial investment of $100,000 in the Solactive HAMILTON CHAMPIONS™ U.S. Technology Index (SHUSTCHT) vs. the Technology Select Sector Index ($CDN) with annual compounded total returns. The graph is for illustrative purposes only and intended to demonstrate the historical impact of the indices’ compound growth rate. It is not a projection of future index performance, nor does it reflect potential returns on investments in the ETF. Investors cannot directly invest in the index. All performance data assumes reinvestment of distributions and excludes management fees, transaction costs, and other expenses which would have impacted an investor’s returns. SHUSTCHT data prior to December 3, 2025, is hypothetical back-tested data using actual historical market data. Actual performance may have been different had the index been live during that period.
The Technology Select Sector Index (“Index”) and associated data are a product of S&P Dow Jones Indices LLC, its affiliates and/or their licensors and has been licensed for use by Hamilton ETFs © 2026 S&P Dow Jones Indices LLC, its affiliates and/or their licensors. All rights reserved. Redistribution or reproduction in whole or in part are prohibited without written permission of S&P Dow Jones Indices LLC. For more information on any of S&P Dow Jones Indices LLC’s indices please visit www.spdji.com. S&P® is a registered trademark of Standard & Poor’s Financial Services LLC (“SPFS”) and Dow Jones® is a registered trademark of Dow Jones Trademark Holdings LLC (“Dow Jones”). Neither S&P Dow Jones Indices LLC, SPFS, Dow Jones, their affiliates nor their licensors (“S&P DJI”) make any representation or warranty, express or implied, as to the ability of any index to accurately represent the asset class or market sector that it purports to represent and S&P DJI shall have no liability for any errors, omissions, or interruptions of any index or the data included therein.
A word on trading liquidity for ETFs …
Hamilton ETFs are highly liquid ETFs that can be purchased and sold easily. ETFs are as liquid as their underlying holdings and the underlying holdings trade millions of shares each day.
How does that work? When ETF investors are buying (or selling) in the market, they may transact with another ETF investor or a market maker for the ETF. At all times, even if daily volume appears low, there is a market maker – typically a large bank-owned investment dealer – willing to fill the other side of the ETF order (at net asset value plus a spread). The market maker then subscribes to create or redeem units in the ETF from the ETF manager (e.g., Hamilton ETFs), who purchases or sells the underlying holdings for the ETF.
Hamilton ETFs is dedicated to helping Canadians get more from their portfolios.

Commissions, management fees and expenses all may be associated with investments in exchange traded funds (ETFs) managed by Hamilton ETFs. Please read the prospectus before investing. ETFs are not guaranteed, their values change frequently, and past performance may not be repeated.

Certain statements contained in this website may constitute forward-looking information within the meaning of Canadian securities laws. Forward-looking information may relate to a future outlook and anticipated distributions, events or results and may include statements regarding future financial performance. In some cases, forward-looking information can be identified by terms such as “may”, “will”, “should”, “expect”, “anticipate”, “believe”, “intend” or other similar expressions concerning matters that are not historical facts. Actual results may vary from such forward-looking information. Hamilton ETFs undertakes no obligation to update publicly or otherwise revise any forward-looking statement whether as a result of new information, future events or other such factors which affect this information, except as required by law.
