Tag Archives: asset allocation ETFs

North American stock portfolio outperforms when it counts

By Dale Roberts, cutthecrapinvesting

Special to the Financial Independence Hub

For U.S. stocks, my wife and I hold 17 Dividend Achievers, plus 3 stock picks. In Canada, I hold the Canadian Wide Moat 7, while my wife holds a Canadian High Dividend ETF – Vanguard’s VDY. There is also a modest position in the TSX 60 – XIU. The U.S. and Canadian stocks both outperform their respective stock market index benchmarks. Working together, the U.S. and Canadian stocks form an all-weather portfolio base.

In this post I’ll offer up charts on our U.S. stock portfolio and the Canadian stock portfolio. And I’ll put them together so that we can see how they work together. The total portfolio was designed to be retirement-ready. The fact that it beats the market benchmarks is a welcome surprise. At the core of the portfolio is wonderful Canadian dividend payers – the U.S. dividend achievers and 3 picks fill in some portfolio holes. We will also take a look at how these stocks can be arranged to provide an all-weather stock portfolio base.

When I write ‘our portfolio,” I am referring to the retirement portfolios for my wife and me. As for ‘backgrounders’ on the portfolios please have a read of our U.S. stock portfolio and the Canadian Wide Moat 7 performance update.

The stock portfolios

In early 2015 I skimmed 15 of the largest-cap dividend achievers. What does skim mean? After extensive research into the portfolio “idea” I simply bought 15 of the largest-cap dividend achievers. For more info on the index, have a look at the U.S. Dividend Appreciation Index ETF (VIG) from Vanguard. That is a U.S. dollar ETF. Canadian investors can also look to Vanguard Canada for Canadian dollar offerings (VGG.TO).

You’ll find the dividend acheivers and Canadian high dividend stocks in the ETF portfolio for retirees post. Both indices are superior for retirement funding, compared to core stock indices.

Dividend growth plus quality

At the core of the index is a meaningful dividend growth history (10 years or more) working in concert with financial health screens. It leads to a high quality skew. Given those parameters the dividend achievers index will certainly hold many dividend aristocrats (NOBL).

The 15 companies that I purchased in early 2015 are 3M (MMM), PepsiCo (PEP), CVS Health Corporation (CVS), Walmart (WMT), Johnson & Johnson (JNJ), Qualcomm (QCOM), United Technologies, Lowe’s (LOW), Walgreens Boots Alliance (WBA), Medtronic (MDT), Nike (NKE), Abbott Labs (ABT), Colgate-Palmolive (CL), Texas Instruments (TXN) and Microsoft (MSFT).

United Technologies merged with Raytheon (RTX) and then spun off Carrier Global Corporation (CARR) and Otis Worldwide (OTIS). We continue to hold all three and they have been wonderful additions to the portfolio. Given that those stocks are not available for the full period, they are not a part of this evaluation. That said, the United Technologies spin-offs added to the outperformance.

Previous to 2015 we had three picks by way of Apple (AAPL), BlackRock (BLK) and Berkshire Hathaway (BRK.B). Those stocks are overweighted in the portfolio. As you might expect, Apple has contributed greatly to the portfolio outperformance. Though the achievers also outperform the market with less volatility.

In total it is a portfolio of 20 U.S. stocks.

The Canadians

I hold a concentrated portfolio of Canadian stocks. What I give up in greater diversification, I gain in the business strength and potential for the companies that I own to not fail. They have wide moats or exist in an oligopoly situation. For the majority of the Canadian component of my RRSP account I own 7 companies in the banking, telco and pipeline space. I like to call it the Canadian wide moat portfolio. They also provide very generous and growing dividends. These days, they’d combine to offer a starting yield in the 6% range.

Here are the stocks:

Canadian banking

Royal Bank of Canada (RY), Toronto-Dominion Bank (TD) and Scotiabank (BNS).

Telco space

Bell Canada (BCE) and Telus (T).

Pipelines

Canada’s two big pipelines are Enbridge (ENB) and TC Energy (TRP).

*Total performance would be improved by holding the greater wide moat portfolio that includes grocers and railway stocks. That is a consideration for those in retirment and in the accumulation stage.

The Canadian mix outperforms the market, the TSX Composite. You’ll also find that outperformance in the Beat The TSX Portfolio. That BTSX strategy (like the Wide Moat 7) finds big dividends, strong profitability and value.

Once again, my wife holds an ETF – the Vanguard High Dividend (VDY) and a modest position in XIU. I did not want to expose her portfolio to concentration risk.

The charts

Here’s the returns of the U.S. and Canadian portfolios, plus a 50/50 U.S/CAD mix as the total portfolio. The period is January of 2015 to end of September 2022. Please keep in mind the returns are not adjusted for currency fluctuations. A Canadian investor has received a boost thanks to the strong U.S. dollar. U.S. investors owning Canadian stocks would experience a negative currency experience. Continue Reading…

Retired Money: Are Balanced Funds really dead or destined to rise again?

Is the classic 60/40 balanced fund destined to rise again, like the phoenix?

My latest MoneySense Retired Money column addresses the unique phenomenon investors have faced in 2022: for the first times in decades, both the Stock and Bond sides of the classic balanced fund or ETF are down.

Click on the highlighted headline to access the full column: The 60/40 portfolio: A phoenix or a dud for retirees? 

While the column focuses on the Classic 60/40 Balanced Fund or ETF, the insights apply equally to more aggressive mixes of 80% stocks to 20% bonds, or more conservative mixes of 40% bonds to 60% stocks or even 80% bonds to 20% stocks. Most of the major makers of Asset Allocation ETFs provide all these alternatives. Younger investors may gravitate to the 100% stocks option: indeed with most US stocks down 20% or more year to date, it’s an opportune time to load up on equities if you have a long time horizon.

However, we retirees may find the notion of 100% equity ETFs to be far too stressful in environments like these, even if the Bonds complement has thus far let down the tea. As Vanguard says in a backgrounder referenced in the column, the classic 60/40 may yet rise phoenix-like from the ashes of the 2022 doldrums.

“We’ve been here before.”

On July 7th, indexing giant Vanguard released a paper bearing the reassuring headline “Like the phoenix, the 60/40 portfolio will rise again.”  “We’ve been here before,” the paper asserts, “Based on history, balanced portfolios are apt to prove the naysayers wrong, again.” It goes on to say that “brief, simultaneous declines in stocks and bonds are not unusual … Viewed monthly since early 1976, the nominal total returns of both U.S. stocks and investment-grade bonds have been negative nearly 15% of the time. That’s a month of joint declines every seven months or so, on average. Extend the time horizon, however, and joint declines have struck less frequently. Over the last 46 years, investors never encountered a three-year span of losses in both asset classes.”

Vanguard also urges investors to remember that the goal of the 60/40 portfolio is to achieve long-term returns of roughly 7%. “This is meant to be achieved over time and on average, not each and every year. The annualized return of 60% U.S. stock and 40% U.S. bond portfolio from January 1, 1926, through December 31, 2021, was 8.8%. Going forward, the Vanguard Capital Markets Model (VCMM) projects the long-term average return to be around 7% for the 60/40 portfolio.”

It also points out that similar principles apply to balanced funds with different mixes of stocks and bonds: its own VRIF, for example, is a 50/50 mix and its Asset Allocation ETFs vary from 100% stocks to just 20%, with the rest in bonds.

Tweaking the Classic 60/40 portfolio

While very patient investors may choose to wait for the classic 60/40 Fund to rise again, others may choose to tweak around the edges. The column mentions how TriDelta Financial’s Matthew Ardrey started to shift many client bond allocations to shorter-term bonds, thereby lessening the damage inflicted to portfolios by bond funds heavily concentrated in longer-duration bonds. Continue Reading…

5 Reasons why the 60/40 Portfolio is NOT Dead

By Bilal Hasanjee, Senior Investment Strategist, Vanguard Canada

Special to the Financial Independence Hub

In the current record-breaking inflation and rising interest rate environment across all major markets, stocks and bonds have declined in values simultaneously.

As a result, many analysts and commentators have speculated on the death of the 60% stock/40% bond portfolios. But we have seen this before. Based on Vanguard’s research, balanced portfolios have proved critics wrong before and we believe they will prove them wrong, again. Here are five reasons why a 60% stock/40% bond portfolio is NOT dead.

Reason 1: Stock-bonds simultaneous decline is not long lasting

A simultaneous decline or positive correlation in stocks and bonds has typically not lasted long and the phenomenon has never occurred over a three-year span. A similar trend is visible on a 60/40 (stocks/bonds) portfolio.

Drawdowns in 60/40 portfolios have occurred more regularly than simultaneous declines in stocks and bonds; however, their frequency of occurrence also declines over longer periods. More regular occurrence is due to the far-higher volatility of stocks and their greater weight in that asset mix. One-month total returns were negative one-third of the time over the last 46 years. The one-year returns of such portfolios were negative about 14% of the time, or once every seven years or so, on average.

Figure 1

Source: Vanguard

Data reflect rolling period total returns for the periods shown and are based on underlying monthly total returns for the period from February 1976 through April 2022. The S&P 500 Index and the Bloomberg US Aggregate Bond Index were used as proxies for stocks and bonds.

Past performance is no guarantee of future returns. The performance of an index is not an exact representation of any particular investment, as you cannot invest directly in an index.

Stock-Bonds correlation remains negative in the long term

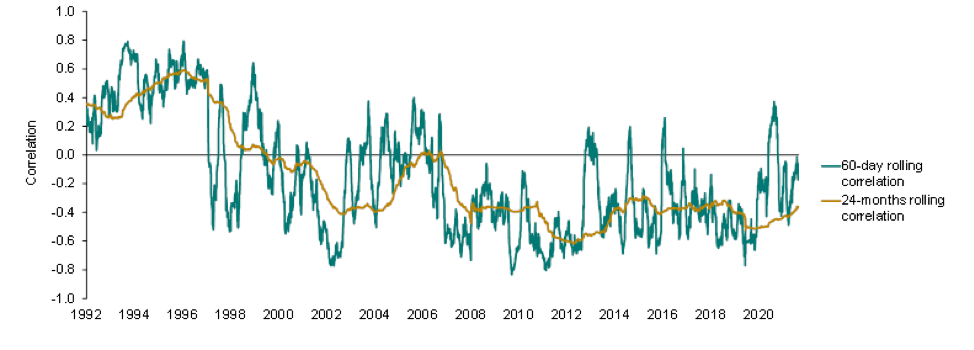
Our study of 60-day and 24-month stock-bonds rolling correlations from 1992 to 2022 suggests that over a long-term, correlation between stocks and bonds remains negative. That said, long-term inflation is one of the determinants of correlation between the two asset classes

Figure 2: Long-term correlations expected to remain negative

Notes: Rolling correlations are calculated on total returns of the S&P 500 Index and the S&P U.S. Treasury Bond Current 10-year Index, using daily return data for the period between 1989 and May 31, 2022.

Sources: Vanguard, using data from Refinitiv, as of May 31, 2022. Past performance is no guarantee of future returns.

The performance of an index is not an exact representation of any particular investment, as you cannot invest directly in an index.

Reason 2: Long-term expected returns from 60/40 are still achievable

The goal of a 60/40 portfolio is to achieve long-term annualized returns of roughly 7%. This is meant to be achieved over time and on average, and not every year. The annualized return of 60% U.S. stock and 40% U.S. bond portfolio from January 1, 1926, through December 31, 2021, was 8.8%.1 On a forward-looking basis, Vanguard Capital Markets Model (VCMM) projects the long-term average return to be around 7% for the 60/40 portfolio, over the next 10 years. Market volatility means diversified portfolio returns will always remain uneven, comprising periods of higher or lower: and, yes, even negative returns.

The average return we expect can still be achieved if periods of negative returns (like this year) follow periods of high returns. During the three previous years (2019–2021), a 60/40 portfolio delivered an annualized 14.3% return, so losses of up to –12% for all of 2022 would just bring the four-year annualized return to 7%, back in line with historical norms.

Our forecast points to improved stocks and bond returns

On the flip side, the math of average returns suggests that periods of negative returns must be followed by years with higher-than-average returns. Indeed, with the painful market adjustments year-to-date, the return outlook for the 60/40 portfolio has improved, not declined. Driven by lower equity valuations and higher bond yields, our 10-year annualized average return outlook for the 60/40 is now higher by 1.3 percentage points than before the recent market adjustment.

Reason 3: Selling bonds in a rising rate environment is like selling low and buying high (in short, don’t try to time the market)

Chasing performance and reacting to headlines are doomed to fail as a timing strategy every time, since it amounts to buying high and selling low. Far from abandoning balanced portfolios, investors should keep their investment programs on track, adding to them in a disciplined way over time. Continue Reading…

What you need to know before investing in All-in-One (Asset Allocation) ETFs

By Michael J. Wiener

Special to the Financial Independence Hub 


I get a lot of questions from family and friends about investing.  In most cases, these people see the investment world as dark and scary; no matter what advice they get, they’re likely to ask “Is it safe?”  They are looking for an easy and safe way to invest their money.  These people are often easy targets for high-cost, zero-advice financial companies with their own sales force (called advisors), such as the big banks and certain large companies with offices in many strip malls.  An advisor just has to tell these potential clients that everything will be alright and they’ll be relieved to hand their money over.

A subset of inexperienced investors could properly handle investing in an all-in-one Exchange-Traded Fund (ETF) if they learned a few basic things.  This article is my attempt to put these things together in one place.

Index Investing

Most people have heard of one or more of the Dow, S&P 500, or the TSX.  These are called indexes.  They are a measure of the price level of a set of stocks.  So, when we hear that the Dow or TSX was up 100 points today, that means that the average price level of the stocks that make up the index was up.

It’s possible to invest in funds that hold all the stocks in an index.  In fact, there are funds that hold almost all the stocks in the whole world.  There are other funds that hold all the bonds in an index.  There are even funds that hold all the stocks and all the bonds.  These are called all-in-one funds.

Most people know they know little about picking stocks.  They hear others confidently talking about Shopify, Google, and Apple, but it all sounds mysterious and scary.  I can dispel the mystery part.  Nobody knows what will happen to individual stocks.  Bold claims about the future of a stock are about as reliable as books about future lottery numbers.  However, the scary part is real.  If you own just one stock or a few stocks, you can lose a lot of money.

When you own all the stocks and all the bonds, it’s called index investing.  This approach to investing has a number of advantages.

Investment Analysis

Investors who pick their own stocks need to pore over business information constantly to pick their stocks and then stay on top of information to see whether they ought to sell them.  When you own all the stocks and all the bonds, there’s nothing to analyze or track on a frequent basis.

Risk

Owning individual stocks is risky.  Any one stock can go to zero.  Owning all stocks has its risks as well, but this risk is reduced.  The collective stocks of the whole world go up and down, occasionally down by a lot, but they have always recovered.  We can’t predict when they’ll drop, so timing the market isn’t possible to do reliably.  It’s best to invest money you won’t need for several years and not worry about the market’s ups and downs.

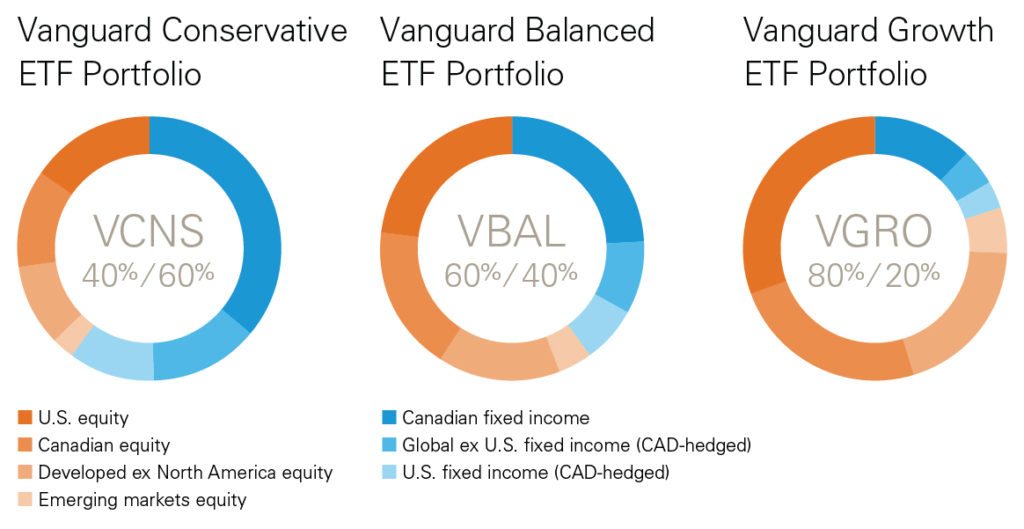
To control risk further, you can invest in funds that include both stocks and bonds.  Bonds give lower returns, but they’re less risky than stocks.  Taking Vanguard Canada’s Exchange-Traded Funds (ETFs) as an example, you can choose from a full range of mixes between stocks and bonds:
ETF Symbol     Stock/Bond %
      VEQT           100/0
      VGRO           80/20
      VBAL           60/40
      VCNS           40/60
      VCIP           20/80

Cost

Sadly, many unsophisticated investors who work with financial advisors don’t understand that they pay substantial fees.  These investors typically own mutual funds, and the advisor and fund company help themselves to investor money within these funds.  There is no such thing as an advisor who isn’t paid from investor funds. Continue Reading…

MoneySense ETF All-Stars 2022

MoneySense has just published its annual feature, the ETF All-Stars 2022. For the first time in several years, I was not the lead writer on this package although I was involved in my role as Investing Editor at Large. We passed the writing reins to veteran financial freelance writer Bryan Borzykowski, who has previously written MoneySense’s annual Robo-advisor feature and is currently writing a new book to be titled ETFs for Canadians for Dummies.

As I point out in another MoneySense column, there is another ETF book published in 2021 that makes a good complement to the All-Stars package.  Reboot Your Portfolio is written by Dan Bortolotti of PWL Capital. Dan was the lead writer of the first edition of the ETF All-stars and served as a panelist for several subsequent years, along with his PWL colleague Justin Bender. In recent years, PWL advisors Ben Felix and Cameron Passmore have served as some of the panelists responsible for selecting the All-stars. The team of 8 panelists is unchanged from last year.

You can find the new edition of the All-stars by clicking here: Best ETFs in Canada for 2022.

As Bryan points out in his overview, by design, the panel didn’t make that many changes from previous years. The idea all along has been to provide a bunch of core low-cost, broadly diversified ETFs that don’t need to be changed every year. Certainly, the panel has never felt obliged to recommend brand new “theme” ETFs just for the sake of change.

Here’s my summary of the main changes:

Canadian Equities

No changes to last year’s lineup.

US Equities

The panel dropped the list of US equity ETFs from ten last year to seven this year.

International Equities

Last year’s picks return, plus the panel added three Emerging Markets ETFs: XEC, ZEM and EMXC.

Fixed Income

While Fixed Income has been a languishing asset class in recent months, the panel didn’t view this as alarming. Its previous lineup of Bond ETFs returns largely intact, with just one casualty: the panel decided to remove the Vanguard Global Bond ETF (VGAB.) For those who are nervous about more losses from rising interest rates, it continues to emphasize short-term bond ETFs like VSB and XSB

Note that in my recent MoneySense Retired Money column on the alleged Death of Bonds, I quote panelist Ben Felix, who still sees a role for fixed income in diversified portfolios. My column suggests those worried by rising rates can either park in treasury bills and wait for further interest rate hikes later this year, or ladder 1- and 2-year GICs every few months. Several 1-year GICs now pay close to 3%. That may be below the rate of inflation of late but at least  its beats losses of near 10% sustained by aggregate bond ETFs. Continue Reading…