Tag Archives: Gen X

Gen Z driving surge in mobile Debit spending

Image courtesy Interac Corp.

An Interac survey being released today finds that more than two thirds (69%) of Canada’s Gen Z generation [defined as Canadians aged 18 to 27] have embraced the mobile wallet, while almost as many (63%) would rather leave their old-fashioned physical wallets at home for short trips. Gen Z’s Interac contactless mobile purchases also rose 27% in the first half of 2024, compared to the same period a year earlier.

Gen Z appears to be more enthusiastic than their counterparts in older cohorts: 60% of Millennials [aged 28-43]  embraced mobile wallets, compared to 44% of Gen Xers [aged 44-59] and just 27% of Baby Boomers [aged 60-78.] Only 10% of the older Silent Generation [age 79 or older] did so.

A whopping 63% of Gen Z mobile wallet users have loaded their Interac debit card on their smartphones, and 31% plan to set debit as their default method of payment. For 63% of them, the reason is perceived faster payment times compared to physical card payments.

 “Choosing your default payment method may feel like a small step, but it can play a big role in shaping Canadians’ ongoing spending habits,” said Glenn Wolff, Group Head and Chief Client Officer, Interac in a press release. “When consumers tap to pay with their phones, the decision to select a card from the digital wallet is easy to miss. Canadians could end up unintentionally using a default payment method that prompts them to take on more debt. This differs from traditional physical wallets where the consumer had to select the card they wanted to use each time.”

Majority want to be smarter with money

62% of Gen Z want to be “more mindful when spending” with 57% saying they want the option to use debit when paying in store or online; 79% of them say the cost of living is too expensive and 59% feel the need to be smarter with their money.

Interact says this generation’s desire to control overspending is heightened by back-to-school season: last year, family clothing stores saw almost twice as many Interac Debit mobile purchases in September and October compared to earlier that year in January and February. 54% of Gen Zs see the need to develop new habits to stay in control over their finances, while 56% are setting a timeline for this September to introduce new habits. Continue Reading…

Young Investors vs Inflation


By Shiraz Ahmed, Raymond James Ltd.

Special to the Financial Independence Hub

Until recently young investors were not terribly concerned with inflation. Why should they have been? It was so low for such a long time that we could predict with pretty good accuracy what was around the corner, at least, in terms of the cost of living. But those days are long gone.

Simply speaking, inflation can be defined as the general increase in prices for those staple ingredients of daily life. Food. Gas. Housing. What have you. And as those prices rise the value of a purchasing dollar falls. When these things are rising at 1% a year, or even less, investors can plan and strategize accordingly. But when inflation is rising quickly, and with no end in sight, that is very different and this is where we find ourselves today.

Someone with hundreds of thousands of dollars to invest, but who must wrestle with mortgage payments that suddenly double, is into an entirely new area. It happened back in the early 1980s when mortgage rates went as high as 21%. Many people lost their homes. But even rates like that pale in comparison to historical examples of hyperinflation.

In the 1920s, the decade known as The Roaring Twenties, the stock market rose to heights never seen before and for investors it was seen as a gravy train with no end in sight. But that was not the case in Germany where a fledgling government – the Weimer Republic – was desperately trying to bring the country out of its disastrous defeat in World War I. Inflation in Weimer Germany rose so quickly that the price of your dinner could increase in the time it took to eat it!

Consider that a loaf of bread in Berlin that cost 160 German marks at the end of 1922 cost 200 million marks one year later. By the end of 1923 one U.S. dollar was worth more than four trillion German marks. The end result was that prices spiralled out of control and anyone with savings or fixed incomes lost everything they had. That in no small way paved the way for Adolf Hitler and the Nazis. Let us also not forget that the gravy train of the Roaring Twenties eventually culminated in the stock market crash of 1929 which led to the Great Depression.

Continue Reading…

Questrade Poll find many investors still oblivious on how fund fees hurt performance

MoneySense.ca: Photo created by pressfoto – www.freepik.com

My latest MoneySense Retired Money column looks at a press release slated for release next week from discount brokerage Questrade Inc. You can find the full column by clicking on the highlighted headline: Canadians are still paying too much in investment fees.

According to the RRSP study commissioned by the independent discount brokerage (a copy of which was provided to me in advance) finds 87% of Canadians don’t know or underestimate the difference that a 2% or 1% fee has on their portfolios over the long run (of 20+ years).

While the majority think Canadian mutual fund management expense ratios (MERs) are too high compared to the rest of the world, given the increased regulatory climate of greater disclosure, I was surprised by the finding that almost half of mutual fund investors still don’t even know what they’re paying for mutual funds.

There are also disturbing generational differences. According to Questrade, 28% of Canadians agree that paying more for an investment will give them better returns. That’s in contrast to the operative principle behind the surge in indexing and ETFs that “Costs matter,” and the lower the costs the better. Yet Millennials seem ripe for the picking here: 42% of investors aged 18 to 34 believe paying more for investments will give them better returns (vs  just 18% of the 55+ cohort).

Or as the teaser under the main headline at MoneySense puts it: Millennials and Gen Z missed the memo on how much management fees erode returns over the long term, according to a new Questrade survey.

Questrade estimates a 1% decrease in fees over a typical 30-year investing horizon could result in 27 to 29% more money in one’s retirement kitty, assuming a 7 to 8% return in a tax-sheltered account and a portfolio between $1,000 and $50,000. But try telling that to the group of investors Questrade polled: 87% either didn’t know or underestimated the difference a 2% fee makes versus a 1% fee’s impact on the value of their portfolio over the long run. 41% think a 1% cut in fees adds 20% or less to the long-run value of their portfolios. And only 43% of RRSP investors believe cutting fees from 2 to 1% will have a big impact on returns over 30 years.

Questrade notes that on average we still are paying 2% or more in fees, which “are some of the highest fees in the world.” It cites this research from Morningstar.com, which looks at fees in 26 countries worldwide.

47% of mutual fund investors still don’t know what fees they’re paying

I find it shocking that a whopping 47% who invest in mutual funds still don’t know what fees they’re paying. A majority (52%) think Canadian mutual fund fees are too high but a third don’t know if a 2% fee for a mutual fund should be considered high. Continue Reading…

Prairies and Eastern Canada most affordable for single home buyers, study says

By Penelope Graham, Zoocasa

Special to the Financial Independence Hub

Despite recent reports that home prices in Canada’s tightest markets are starting to cool, skyrocketing values over the last five years mean purchasing real estate is still financially unfeasible for many prospective buyers – especially those trying to do so on their own.

However, while this certainly is the case in the Vancouver and Toronto markets – where average home prices rose 35 and 58% between 2014 – 2019, respectively – a new study from Zoocasa reveals homeownership isn’t out of the cards for buyers willing to expand their search.

Where can single purchasers afford a home?

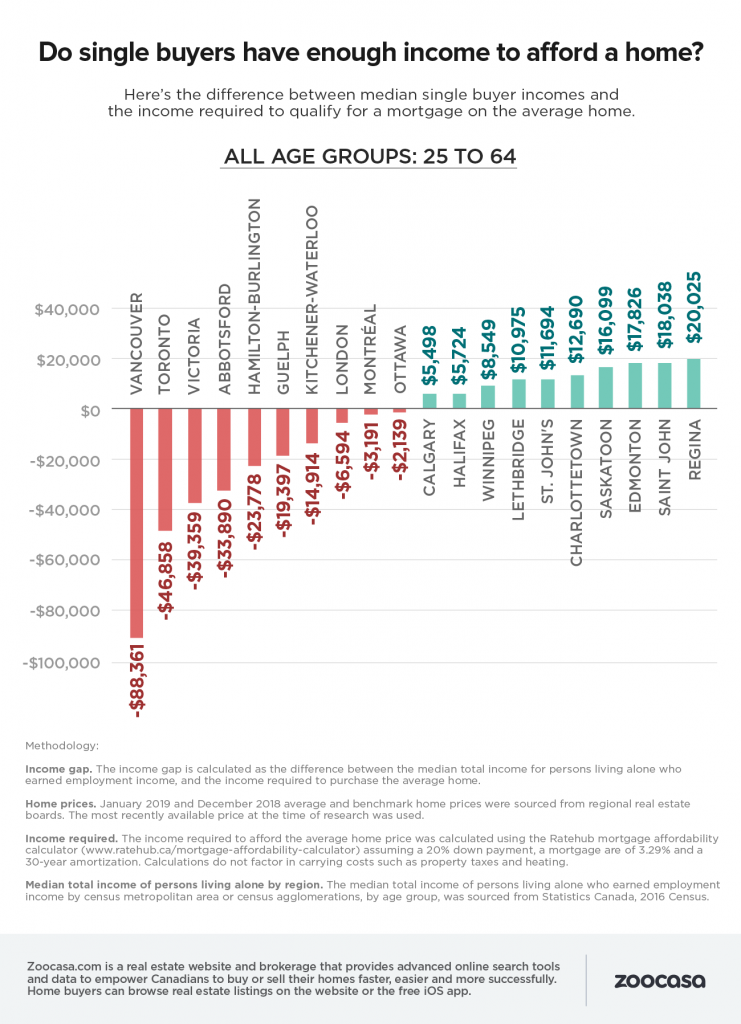
To find which markets can be considered affordable on a solo budget, the study sourced average home prices for 20 cities across the nation. It then calculated, assuming a 20% down payment, mortgage rate of 3.29%, and a 30-year amortization, the minimum income required to purchase the average home in each market. That amount was then compared to actual median income data of “persons living alone who earned employment income” as reported by Statistics Canada.

The numbers reveal that for single purchasers earning the median income, 10 markets can still be considered affordable: and all are located within the Prairie and Eastern Canadian provinces.

Regina takes the top spot for single buyer affordability; there, an earner bringing in$58,823 would qualify to purchase a home at the average price of $284,424, and have an “income surplus” of $20,025. This surplus indicates the buyer is not purchasing at the top of their affordability, an important consideration when interest rates are on the rise.

The other most affordable cities include Saint John, where the average home priced at $181,576 could be purchased on an income of $42,888 with $18,038 left over, and homes on the Edmonton MLS, where earning $64,036 would net a $17,826 surplus on the average home price of $338,760. Calgary, Lethbridge, Winnipeg, and Halifax can also be considered to be affordable markets based on the study’s criteria.

Vancouver, Toronto, still well out of financial range for solo buyers

On the least affordable end of the scale is Vancouver, where the average home costs $1,109,600: out of the range of the local median single income of $50,721 to the tune of $88,361.

Affordability also remains steep for single buyers in the Toronto market, despite overall higher earnings and lower average home price: there, an income of $55,221 would fall $46,858 on the average home price of $748,328. Victoria rounds out the top three with an average home price of $633,386, $39,359 below what the median income of $86,400 can afford. Continue Reading…