Tag Archives: inflation

Q&A on the new Harvest global bond ETF


By Bradley Komenda

(Sponsor Content)

Harvest Portfolios Group launched a global bond ETF in January 2020 to complement its equity ETF offerings.

The  Harvest US Investment Grade Bond Plus ETF (HUIB:TSX) is managed by Boston-based Amundi Pioneer Asset Management, a subsidiary of Amundi Asset Management, a leading global manager based in France. In a Q&A, Bradley Komenda, the ETF’s portfolio manager, discusses how Amundi’s value investing approach helps guide its strategy. Mr. Komenda joined Amundi Pioneer in 2008 and is also Senior Vice President and Deputy Director of Investment Grade Corporates at the firm.

Financial Independence Hub: What is the demand for these bonds for the Canadian investor?

Bradley Komenda:  Canadian bond market opportunities are pretty narrow and heavily weighted towards energy and financials. Because there is a lot of demand for these bonds, yields are less attractive than in the US.

This bond ETF gives you breadth. It is Canadian dollar hedged, but with access to top quality US, European and Global issuers.  Expectations of further fiscal stimulus will all be supportive of the corporate bond market, so we think that this is where we want to be.

Q: What is Amundi Pioneer’s approach?

A: We are value investors. We invest in credits that we think over a one to three-year time horizon are going to generate a superior return. By value investing, I don’t mean buying the cheapest securities. It means trying to identify the securities that have the best risk adjusted return potential.

Q: How do you assess risk?

A: We look at risk in three ways. We look at nominal risk, which is how much we have invested in a single issuer. Then we look at the maturity of the bonds. We know that if we buy a one-year bond, it is a lot less risky than buying a 30-year. And then we look at duration times spread, (DTS) which is a way to measure the credit volatility of a bond.

Q: Where is the Harvest US Investment Grade Bond Plus ETF on the risk spectrum?

A: From an overall portfolio perspective, this bond ETF is rated low risk, and within the fixed income universe, I’d say it’s medium.

If you want lower risk, you can do a couple things. You can buy government bonds, but after inflation your purchasing power will be eroded even with longer duration bonds.

If you go for a short-term ETF, or cash, you’re going to struggle to get a yield similar to inflation. So, this ETF is for someone with patience, a one to three-year time horizon and a willingness to accept short-term volatility but with the expectation of attractive returns relative to risk-free or very short bonds.

Q: What about bond quality?

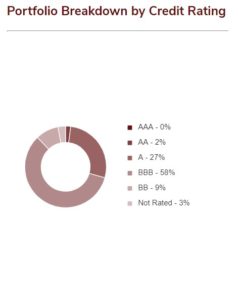
A: HUIB is concentrated in the Triple B space (BBB) or higher. The breakdown is roughly 60% BBB, 30% A or higher and 10% Non-rated.

Q: Who is the core investor for this bond ETF?

A: Anybody who wants exposure to fixed income. That’s because it has a negative correlation to stocks which means they move in different directions.  If you buy a high yield fund, you’re going to get more yield, but you’re going to have a positive correlation to stock market movements.


Q: Investors worry about liquidity. How easy is this ETF to sell?

A: It’s highly liquid. We had a liquidity crisis in the corporate bond market in March of this year. The Fed stepped in and now is backstopping things by purchasing bonds as needed. It means the draw down we saw in March and early April is unlikely to occur again.

Q: What is the relative advantage of this ETF?  

A: This ETF is part of our investment grade corporate bond strategy. Continue Reading…

Playing with the Box: Re-reading Nick Murray

I was on a cross country flight recently and I re-read a book called “Simple Wealth, Inevitable Wealth” by Nick Murray, a former rock star speaker who was beloved by the financial advice industry – mostly because he constantly told his advisor audiences that they are great, do important work and are worth every penny they make.  The book was written 20 years ago and, unlike the other books by Murray, was written expressly for investors.  Reading it again provided both a nostalgic stroll down memory lane and an enlightening insight into how much the financial services industry has changed in the past generation.  Some parts of the book have held up well.  Others… not so much.

The risk of outgrowing your capital

I’ll begin with the positive.  The good news is that I still find it refreshing to read Murray’s perspective on the perverse way the media defines risk.  He simply, compellingly and eloquently walks readers through the very real risk of outliving your capital as a result of a reliance on the quaint notion that bonds are “safe”.  Safety, according to Murray, is having a pool of capital that you cannot outlive – and putting a significant portion of your life’s savings can significantly impede that outcome becoming a reality.  I was also heartened by his acknowledgement that there are false dichotomies and that the real decision in the ongoing ‘debate’ between active and passive approaches is really a choice between the more relevant considerations of product cost.  Murray also writes persuasively about the need for specific, measurable, time-bound goals that help to focus the mind and guide in principled decision-making.  Best of all, Murray names and blames what I believe to be the biggest culprit in most peoples’ failure to meet their financial goals: themselves.  More specifically, their own behaviour.

There are also a few things that cause me to shake my head in disbelief, however.  The most obvious of these are the return assumptions that he puts forward as being reasonable.  Granted, the numbers he uses are based on historical data, but he does relatively little to explain that real returns are fairly constant and that a portion of all nominal returns is inflation.  While he doesn’t expressly tell people what inflation rate to expect, he does note that there is historically about a 5% premium for stocks over bonds.  He uses 11% as a proxy for expected stock returns and 6% for bond returns.  To put that in perspective, I currently assume inflation to be 2% with a 5% real return for equities (7% nominal) and a 0% real return (2% nominal) for income.  How times have changed, now that everyone has re-calibrated their expectations toward a low-growth, low-inflation environment for the foreseeable future.

Sustainable withdrawal rates

Then there’s the related question of a sustainable retirement withdrawal rate.  Murray uses 6%.  Many years ago, I remember people talking about the real rate being 5%.  For the past number of years, I’ve been using 4%.  Note that my current withdrawal rates are actually more aggressive/ less forgiving than Murray’s.  You’re much more likely to not run out of money withdrawing 6% from something that’s earning 11% than to withdraw 4% from something earning 7%.  Financial planning is easy when your assumptions are based on a rose-coloured past rather than a murky future.

The thing that struck me the most, however, was his admonition to readers (remember, Murray is writing to ordinary investors here) to focus on first principles.  Everyone knows the old ‘life’s like that’ story about getting a young child an expensive present for Christmas or a birthday only to have that child spend more time playing with the box that the gift came in than with the gift itself.  Continue Reading…

How fast will your portfolio shrink in Retirement?

By Michael J. Wiener

Special to the Financial Independence Hub


Once you’re halfway through retirement, you’d expect about half your savings to be gone, right? This turns out this is very wrong when we don’t adjust for inflation. The return your portfolio generates causes your savings to hold steady for a while and then fall off a cliff.

I read the following quote in the second edition of Victory Lap Retirement:

“A recent Employee Benefit Research Institute study found that people in the U.S. who retired with more than  $500,000 in savings still had, on average, 88 percent of it left eighteen years after retirement.”

Frederick Vettese provided further detail. This 88% figure is the median rather than the average.

This statistic was used as proof that retirees aren’t spending enough. After all, if you planned on a 35-year retirement, half the money should be gone after 18 years, right? Not even close. Below is a chart of portfolio size based on the following assumptions.

– annual portfolio return of 2% above inflation
– annual withdrawals of 4% of the starting portfolio size, rising with inflation each year
– inflation of 2.12% (the average U.S. inflation from 2001 to 2018)


So, to be on track for a 35-year retirement, your remaining portfolio 18 years into retirement should be 83% of your starting portfolio size. This is a far cry from an intuitive guess that about half the money should be left.

Still, the earlier quote said the average retiree who started with at least half a million dollars had 88% of their money left 18 years into retirement. Further, thanks to a reader named Dave who found the original EBRI study online, we know that the 88% figure is inflation-adjusted. Continue Reading…

How Canadians are impacted by rising home prices: National Survey


By Penelope Graham, Zoocasa

Special to the Financial Independence Hub

Election season may have come and gone, but the need for affordable housing remains a top-of-mind issue for Canadians, regardless of governing political party. According to a recent national survey conducted by Zoocasa, a whopping 84% say they feel the ability to afford a home is a major issue that’s negatively impacted the population: and 78% feel the government needs to make it a priority focus.

As well, the survey findings reveal that anxiety around affordability extends beyond those who wish to get onto the property ladder; while renters express particularly strong feelings of uncertainty (93%), current homeowners are also feeling the squeeze from spiralling home values, with 80% in agreement.

Let’s take a look at the top concerns indicated by Canadians.

Incomes can’t keep pace with Real Estate prices 

It’s no secret that prices for houses for sale in markets across Canada have seen enormous growth over the last five years. According to the Canadian Real Estate Association, the national average home price now exceeds half a million dollars, at $515,500 (though it should be noted that removing Vancouver and Toronto houses and condos from the equation would trim that total to $397,000).

This has left the majority of Canadians – 91% – feeling as though home prices have outstripped wages in their city or town, while another 92% say they feel rising home prices have reduced the ability of middle-class Canadians’ abilities to purchase a home.

As a result, in order to seek out greater affordability, more than half of first-time buyers said they’d leave their current location and move to a market with lower home prices, contributing to what’s referred to in real estate circles as “driving until you qualify.”

Other homeownership hurdles

But rising home prices only tell a portion of the story: while 70% of respondents agree they’re the largest obstacle to getting on the property ladder, the inability to save enough for a down payment also ranks highly on the list of challenges. Continue Reading…

How Real Return Bonds compare with regular Bonds, protecting against unexpected rises in Inflation

Real Return Bonds (RRBs) pay you a rate of return that’s adjusted for inflation, but that’s not always as promising as it seems.

When a real-return bond is issued, the level of the consumer price index (CPI) on that date is applied to the bond. After that, both the principal and interest payments are typically adjusted every six months, upwards or downwards from that base level, to compensate for a rise or fall in the CPI.

In general, Government of Canada real-return bonds pay interest semi-annually, on June 1 and December 1.

How a real-return bond works: A theoretical example

The Bank of Canada issues $400 million of 30-year bonds maturing on December 1, 2049. The bonds have a coupon, or interest rate, of 2%.

If after six months from the date of issue, the new CPI level is, say, 1% above the level of the CPI on the issue date, then each $1,000 of bond principal is adjusted to $1,010 of bond principal ($1,000 x 1.01). The semi-annual interest payment is then $10.10 ($1,010 x 2% / 2).

If after 12 months, the level is 2% higher, then the bond principal is adjusted to $1,020 ($1,000 x 1.02), and the interest payment rises to $10.20 ($1,020 x 2% / 2).

Three important considerations to recognize with real-return bonds

1.) The price you pay for real-return bonds reflects the anticipated rate of inflation. In other words, if investors feel that inflation will rise 2% over the long term, the price of the bond will reflect that future inflation increase and its effect on the bond’s principal and interest payments. So, when you buy a real-return bond, you are only protecting yourself against unanticipated rises in inflation.

2.) When the inflation rate falls over a six-month period, the principal and interest payments of a real-return bond fall. In times of deflation, the inflation rate turns negative. In a prolonged period of deflation, the principal of a real-return bond could fall below the purchase price. Interest payments would fall, as well.

3.) As with regular bonds, holders of real-return bonds must pay tax on interest payments at the same rate as ordinary income. That income gets taxed at the investor’s marginal rate. In addition, holders of real-return bonds must also report the amount by which the inflation-adjusted principal rises each year, as interest income, even though you won’t receive that amount until the bond matures. That amount is added to the bond’s adjusted cost base.

If the CPI level falls, that reduces the inflation-adjusted principal. You deduct the amount of that reduction from your taxable interest income that year, and also subtract it from the adjusted cost base.

Real-return bonds in comparison to regular bonds

In simple terms, a bond is a form of lending whereby you lend money to a corporation or government. In return, a bond pays a fixed rate of interest during its life. Eventually, a bond matures, and holders get the bond’s face value—but nothing more. Receiving the fixed interest and face value at maturity is the best that can happen. Note, though, that in some cases, corporate bonds can go into default. As well, inflation can devastate the purchasing power of bonds and other fixed-return investments. Continue Reading…