Tag Archives: stocks

How to navigate a coming Worldwide recession

Source: myownadvisor and https://www.thecanadianencyclopedia.ca/en/article/recession

By Mark Seed, myownadvisor

Special to Financial Independence Hub

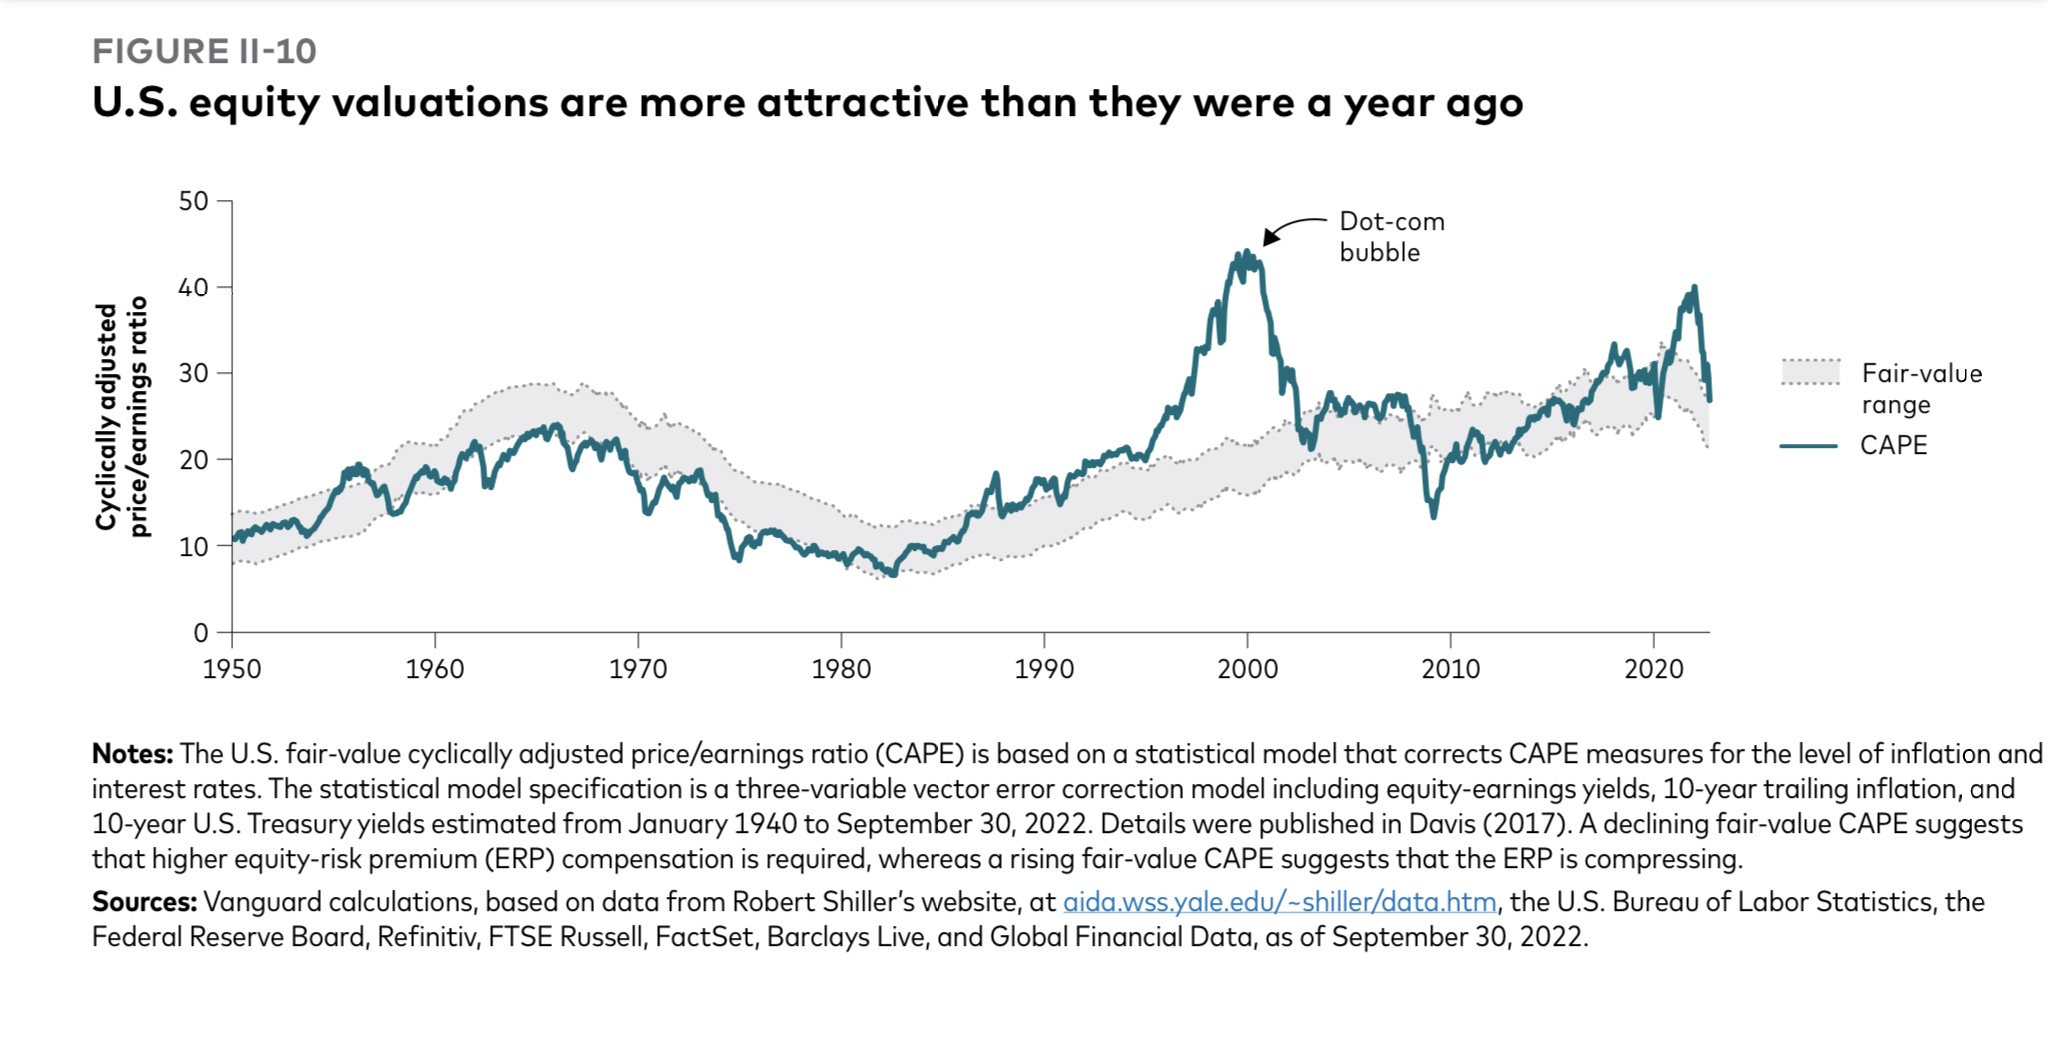
According to the largest asset manager firm in the world (BlackRock), policymakers will no longer be able to support markets as much as they did during past recessions – so we have been warned – a team of BlackRock strategists led by vice chairman Philipp Hildebrand wrote in a report titled 2023 Global Outlook.

“Recession is foretold as central banks race to try to tame inflation. It’s the opposite of past recessions,” they said. “Central bankers won’t ride to the rescue when growth slows in this new regime, contrary to what investors have come to expect. Equity valuations don’t yet reflect the damage ahead.”

The report went on to say “The old playbook of simply ‘buying the dip’ doesn’t apply in this regime of sharper trade-offs and greater macro volatility. We don’t see a return to conditions that will sustain a joint bull market in stocks and bonds of the kind we experienced in the prior decade.”

I reflected on this report recently. How is an investor to cope?

Well, I think the “old playbook” is actually something I’ve already started to think about for the “new playbook” and maybe you have as well …

  1. Directionally, i.e., longer-term than one year or so, stay with equities. Lots of them. In fact, to be specific, consider infrastructure stocks in particular. BlackRock: “We see some opportunities in infrastructure. From roads to airports and energy infrastructure, these assets are essential to industry and households alike. Infrastructure has the potential to benefit from increased demand for capital over the long term, powered by structural trends such as the energy crunch and digitalization.”
  2. Tactically, i.e., within the next year, if you need that money balance, consider bonds. Yes, consider fixed income again. According to BlackRock: “In fixed income, the return of income and carry has boosted the allure of certain bonds, especially short term. We don’t think leaning into broad indexes or asset allocation blocks is the correct approach. We stay underweight long-term nominal bonds as we see term premium returning due to persistent inflation, high debt loads and thinning market liquidity.” Meaning, if you are going to own some bonds, stay short and own short-duration bonds.

I come back to Ben Carlson’s thesis (that I agree with) after reading this recent BlackRock global outlook report when it comes to bonds. There are absolutely good reasons to own bonds, but it’s more for the near-term variety:

  1. Bonds can help your investing behaviour – helping you ride out stock market volatility – including being strategic to buy more stocks soon.
  2. Bonds can be used to rebalance your portfolio – helping you keep your portfolio aligned to your investing risk tolerance and therefore asset allocation (mix of stocks and bonds).
  3. Bonds can be used for spending purposes – where some fixed income is “king” for major, upcoming, near-term spending.

The main reason I would keep any bonds (and I still don’t have any right now) is if I was saving for a major purchase in a few years (e.g., secondary residence?). Then, I would like rely on some form of fixed income between now and then to help secure that purchase. Otherwise, an interest savings account in the short-term will do that and/or some 1 or 2-year GICs are a great consideration as well as part of any bucket strategy.

Personally, I believe the main role of fixed income in your portfolio is essentially safety – not the investment returns and not the cash flow needs. In other words, if all else fails per se, if/when stocks crash, then bonds should historically speaking offer a flight to safety for preserving principal.

So, they are there for diversification purposes.

As Andrew Hallam, Millionaire Teacher has so kindly put it over the years: when stocks fall hard, bonds act like parachutes for your portfolio. Bonds might not always rise when the equity markets drop. But broad bond market indexes don’t crash like stocks do.

Is that enough to own bonds in your portfolio? Maybe.

For now, I’m going to continue living with stocks: a mix of dividend-paying stocks (including infrastructure stocks that BlackRock likes for the year or so ahead) AND owning low-cost equity ETFs for growth.

I will also grow my cash wedge to my desired safety net by the end of 2023 too. That’s one year’s worth of spending/expenses held in cash that will form Bucket 1 below. That first bucket is an insulator from my dividend and growth equities.

Your mileage may vary. Continue Reading…

Preparing your Portfolio for Retirement? Income Is so Yesterday


By Billy and Akaisha Kaderli, RetireEarlyLifestyle.com

Special to the Financial Independence Hub 

When preparing for retirement, designing your portfolio for income is over-rated. Oh, it feels good bragging about how much money you make each year, but then you also quiver about the taxes you owe each April.

What’s the point?

To make it – then give it back – makes no sense.

In today’s interest rate environment people are being forced to adjust their thinking.

Our approach 3 decades ago

When we retired over 32 years ago, having annual income was not on our minds. Knowing we had decades of life-sans-job ahead of us, we wanted to grow our nest egg to outpace inflation and our spending habits as they changed too. Therefore, we invested fully in the S&P 500 Index.

500 solid, well-managed companies

The S&P Index are 500 of the best-managed companies in the United States.

Our financial plan was based on the idea that these solid companies would survive calamities of all sorts and their values would be expressed in higher future stock prices outpacing inflation. After all, these companies are not going to sell their products at losses. Instead they would raise their prices as needed to cover the expenses of both rising resources and wages, thereby producing profits for their shareholders.

How long has Coca-Cola been around? Well over 100 years and the company went public in 1919 when a bottle of Coke cost five cents.

Inflation cannot take credit for all of their stock price growth as they created markets globally and expanded their product line.

This is just one example of the creativity involved in building the American Dream. The people running Coke had a vision and have executed it through the years. Yes, “New Coke” was a flop as well as others, but the point is that they didn’t stop trying to grow because of a setback.

Coca-Cola is just one illustration of thousands of companies adapting to current trends and expanding with a forward vision.

Look at Elon Musk. He has dreams larger than most of us can imagine.

Sell as needed

Another benefit we have in designing our portfolio in this manner, is that when we sell shares for “income,” they are taxed at a more favorable rate as a long-term capital gain. Dividend output is low, our tax liability is minimal, yet our net worth has grown.

We are in control of our income stream.

Our suggestion is not to base your retirement income on income-producing investments but rather to go for growth. You can always sell a few shares to cover your living expenses.

Money Never Sleeps

Just because you retire, your money doesn’t have to.

In the words of Gordon Gecko from the 1987 movie Wall Street, “money never sleeps.” And your money definitely won’t once you leave your job.

Reading financial articles about what if retirees run out of money, we get the impression that the authors do not understand that once retired, your money can – and should – continue to work for you.

Working smart not hard

Once you walk out of the 9-5 for the last time, that doesn’t mean your investments are frozen at that point. The stock market is still functioning and now your “job” is to become your own personal financial manager. Actually, you should have been doing this all along, but if not, start now.

You need to get control of your expenses by tracking your spending daily, as well as annually. This is so easy – only taking minutes a day – and this will open your eyes as to where your money is going. Not only that, but it will give you great confidence to manage your financial future. Every business tracks expenses and you need to do the same. You are the Chief Financial Officer of your retirement.

The day we retired the S&P 500 index closed at 312.49. This equates to a better than 10% annual return including dividends. We know that we have stated this before, but it’s important.

Chart of S&P Market Returns January, 1991 to September 2022

That’s pretty good for sitting on the beach working on my tan.

Making 10% on our portfolio annually while spending less than 4% of our net worth has allowed our finances to grow, while we continue to run around the globe searching for unique and unusual places.

But what if you’re fifty?

You need to take stock of your assets and determine what your net worth is, with and without the equity in your home. Selling the house and downsizing may be a windfall for you, again utilizing the tax code to your benefit. Continue Reading…

Price, Value & the CAPE’d Crusade

Image via Outcome/The Blue Diamond Gallery

By Noah Solomon

Special to the Financial Independence Hub

According to Warren Buffett, “Price is what you pay. Value is what you get.”

The cyclically adjusted price-to-earnings ratio, commonly known as CAPE, is a valuation measure invented by Nobel Prize recipient Robert Shiller. It is calculated by taking the price of an index and dividing it by its average earnings over the past 10 years, adjusted for inflation. The ratio’s use of average earnings over the last decade helps to smooth out the impact of business cycles and other events and thus provides a better picture of a market’s sustainable earnings power.

The CAPE ratio is commonly used to gauge future returns over medium to long-term horizons. In theory, higher than average CAPE levels imply lower than average future returns, while their lower counterparts suggest that future returns will be relatively high.

In the following piece, I analyze historical data to determine if the CAPE ratio has been a useful predictor of future real (i.e., after inflation) returns. In my view, including real rather than nominal returns is appropriate given the recent resurgence of inflation. Investors must be mindful of inflation’s potential to erode a substantial portion of their portfolios’ purchasing power. Lastly, I comment on what investors can expect going forward given the current CAPE level.

The following table presents average real future returns following various CAPE ranges.

S&P 500 Index: Average Real Returns Sorted by CAPE Ratio (Jan. 1970 – Nov. 2022)

There has been an inverse relationship between CAPE ratios and future returns. When the CAPE ratio has been near the high end of its historical range, future returns have tended to be relatively low. Conversely, low CAPE ratios have tended to foreshadow higher returns. Whereas this relationship has not been statistically significant over shorter holding periods, it has been strong over the medium to long-term.

When CAPE ratios have been below their historical average of 21, annualized real returns over the subsequent five years have averaged 8.3%, as compared to only 3.3% when CAPE ratios have stood above this level. The corresponding numbers for 10 year holding periods have been 8.8% vs. 4.2%.

The difference in average returns cannot be understated. On a $10 million investment over 5 years, the difference in return equates to a real value of $14,922,900 vs. $11,754,768. Adding in the average inflation rate since 1970 of 4.04%, the corresponding nominal values have averaged $17,920,804 vs. $14,240,696.

Over ten-year holding periods, the average real values of a $10 million investment made when CAPE levels were below vs. above average were $23,290,712 and $15,137,096, respectively. After adding back the post-1970 average inflation levels of 4.04%, these figures rise to $33,533,809 and $22,140,747.

These differences, although significant, represent the divergence in average returns during times when CAPE ratios have been merely above or below average. As the table above demonstrates, the difference in returns following investments made in very low vs. very high CAPE environments has been far greater.

Explaining the Anomalous “Bump”: Where Behavior Confounds Theory

Although low CAPE levels have been associated with higher future returns, and vice versa, the relationship is far from perfect across different CAPE ranges. Specifically, there is an anomalous “bump” whereby future returns for the 20-25 CAPE range have been nearly as high or higher than those that have followed any other CAPE level.

My best guess is that this peculiarity relates to human psychology and behavior. Historically, when stocks have risen for an extended period following a bear market, investors have been increasingly willing to believe that “it’s different this time” and that the good times will continue indefinitely. At these times, FOMO (fear of missing out), greed, and momentum have taken center stage until valuations reached levels which all but guaranteed a catastrophe.

Greed, Fear, & Where we Stand Today

The above relationships are a powerful representation of investor psychology. Historically, when the crowd’s greed manifests in lofty stock valuations, future returns have tended to be anemic. On the other hand, when widespread skepticism and despondency have caused earnings to go on sale, above average returns have tended to ensue. Alternately stated, investors would be well-served to follow Buffett’s advice to be “fearful when others are greedy, and greedy when others are fearful.”

Recent market malaise notwithstanding, stocks remain overvalued by historical standards. Taking the most recent data available, the CAPE ratio currently stands at 27.42, which is 30% higher than its historical average since 1970. This CAPE level implies real annualized returns over the next five years of 3.6%, which is approximately 50% lower than the 6.9% average that has prevailed since 1970. Over the next ten years, the implied real rate of return is 4.3% as compared to a historical average of 6.6%.

When the Going Gets Tough, the Tough get Tactical and Seek Dividends

Over five decades spanning January 1970 to December 2019, the two worst periods for the S&P 500 Index were the 1970s and the 2000s. Continue Reading…

Vanguard says Balanced portfolios still offer best chance of success as Inflation gets beaten back

While the traditional 60/40 balanced portfolio has suffered its worst year in decades, and Recession is likely in 2023, the Vanguard Group is optimistic that balanced portfolios will thrive beyond 2023 and over the rest of the decade.

A balanced portfolio still offers the best chance of success,” is one of the top conclusions that will be unveiled Monday:  Vanguard Canada is hosting its Economic and Market Outlook for 2023, with a global virtual press conference scheduled at 11 AM [Dec. 12].  It includes Vanguard economists such as Global Chief Economist Joe Davis.

Below, received last week under embargo, are highlights of a report titled Vanguard Economic and Market Outlook for 2023: Beating back inflation. It runs about 60 pages, including numerous charts.

The text below consists mostly of excerpts from the Vanguard report, with the use of an ellipsis to indicate excisions, so there are no passages in quotation marks. Subheads are also taken from the original document. Apart from a handful of charts reproduced below, references to numerous other charts or graphs have been removed in the excerpts selected below.

Base case for 2023 is Disinflation

Our base case for 2023 is one of disinflation, but at a cost of a global recession. Inflation has likely already peaked in most markets, but reducing price pressures tied to labor markets and wage growth will take longer. As such, central banks may reasonably achieve their 2% inflation targets only in 2024 or 2025.

Consistent with our investment outlook for 2022, which focused on the need for higher short-term interest rates, central banks will continue their aggressive tightening cycle into early 2023 before pausing as inflation falls. As such, our base case has government bond yields generally peaking in 2023. Although rising interest rates have created near-term pain for investors, higher starting rates have raised our return expectations for U.S. and international bonds. We now expect U.S. and international bonds to return 4%–5% over the next decade.

Equity markets have yet to drop materially below their fair-value range, which they have historically done during recessions. Longer term, however, our global equity outlook is improving because of lower valuations and higher interest rates. Our return expectations are 2.25 percentage points higher than last year. From a U.S. dollar investor’s perspective, our Vanguard Capital Markets Model projects higher 10-year annualized returns for non-U.S. developed markets (7.2%–9.2%) and emerging markets (7%–9%) than for U.S. markets (4.7%–6.7%).

Global inflation: Persistently surprising

Our base case is a global recession in 2023 brought about by the efforts to return inflation to target … growth is likely to end 2023 flat or slightly negative in most major economies outside of China. Unemployment is likely to rise over the year but nowhere near as high as during the 2008 and 2020 downturns. Through job losses and slowing consumer demand, a downtrend in inflation is likely to persist through 2023. We don’t believe that central banks will achieve their targets of 2% inflation in 2023, but they will maintain those targets and look to achieve them through 2024 and into 2025 — or reassess them when the time is right. That time isn’t now.

Global fixed income: Brighter days ahead

The market, which was initially slow to price higher interest rates to fight elevated and persistent inflation, now believes that most central banks will have to go well past their neutral policy rates — the rate at which policy would be considered neither accommodative nor restrictive — to quell inflation.

Rising interest rates and higher interest rate expectations have lowered bond returns in 2022, creating near-term pain for investors. However the bright side of higher rates is higher interest payments. These have led our return expectations for U.S. and international bonds to increase by more than twofold. We now expect U.S. bonds to return 4.1%–5.1% per year over the next decade, compared with the 1.4%–2.4% annual returns we forecast a year ago. For international bonds, we expect returns of 4%–5% per year over the next decade, compared with our year-ago forecast of 1.3%–2.3% per year.

Global equities: Resetting expectations

The silver lining is that this year’s bear market has improved our outlook for global equities, though our Vanguard Capital Markets Model (VCMM) projections suggest there are greater opportunities outside the United States.

Stretched valuations in the U.S. equity market in 2021 were unsustainable, and our fair-value framework suggests they still don’t reflect current economic realities.

Although U.S. equities have continued to outperform their international peers, the primary driver of that outperformance has shifted from earnings to currency over the last year. The 30% decline in emerging markets over the past 12 months has made valuations in those regions more attractive. We now expect similar returns to those of non-U.S. developed markets and view emerging markets as an important diversifier in equity portfolios.

Within the U.S. market, value stocks are fairly valued relative to growth, and small-capitalization stocks are attractive despite our expectations for weaker near-term growth. Our outlook for the global equity risk premium is still positive at 1 to 3 percentage points, but lower than last year because of a faster increase in expected bond returns

Continue Reading…

Wrapping our Heads around Income

Image: Franklin Templeton/iStock

By Franklin Templeton

(Sponsor Content)

For those who depend on investments to provide a portion of their yearly income, 2022 has been a tough slog, to say the least; but take heart: it’s almost over.

Of course, no one can say with certainty that 2023 will be better. Persistently high inflation, ongoing central bank monetary tightening and the increasing likelihood of a recession have made for volatile markets, and this uncertainty could continue well into next year.

Under the circumstances, it’s not surprising that weary investors have poured money into GICs (guaranteed investment certificates) and other cash equivalents. Even with today’s higher interest rates, however, returns remain well below the inflation rate, and unless held in registered accounts, they are fully taxable. Liquidity can also be problematic as most GICs require a locked-in period, with penalties for redeeming before maturity. If you need flexibility, you’ll pay for it with lower returns.

Reliable income requires diversification

Without doubt, GICs have their place: but the proverbial advice about placing all your eggs in one basket still applies. Diversification is as important for income portfolios as it is for equities, and the sources of income should be as uncorrelated to each other as possible. One way to easily bump up the level of income diversification is through a managed program (sometimes referred to as a wrap account) which bundles together different investment vehicles, strategies, styles and portfolio managers in one or more “umbrella” portfolios directed by a governing team of portfolio managers.

20 years of income generation

One of the earliest programs managed in Canada was Franklin Templeton’s Quotential program; in fact, this year marks the program’s 20th anniversary. Of its five globally diversified, actively managed portfolios, the aptly named Quotential Diversified Income Portfolio (QDIP) is designed to generate high, consistent income from multiple uncorrelated sources. Canadian and international fixed income assets form the core of the portfolio, but for added flexibility and performance enhancement, about one-quarter of the portfolio is invested in blue-chip Canadian and international equities selected for their income-generating  dividend yields and long-term growth potential.

T” is for Tax Efficient

Reliability solves much of the income puzzle, but an important missing piece is the tax burden. Taxes can eat away at the income generated from investments, especially if you are still earning a salary or receiving significant income from other sources. All Quotential portfolios are available in Series T, which offers a predictable stream of cash flow through monthly return of capital (ROC) distributions. From a tax perspective, ROC is treated more favourably than interest or dividend income. The tax efficiency also extends to the tax deferral of capital gains that can help you better plan for when you pay tax. For snowbirds and others who spend extended periods south of the border, distributions from Series T are available in U.S. dollars for a number of funds, including Quotential Diversified Income.

It’s important to stress that with Series T, capital gains taxes are deferred, not eliminated. Continue Reading…