
Special to the Financial Independence Hub
Most Canadians approaching retirement have two questions:
1.) How much can I take out of my investment portfolio each year if I want to be guaranteed not to outlive my money?
2.) Once I know the answer to my first question, can I live on that much money, plus whatever government benefits or private pension plan I might get.
The truth is that there are a TON of variables that go into answering these two questions for each person. BUT the best that we’ve come up with so far is the “4% rule of thumb”.
That said, our 4% number (much more discussion on what this actually means below) depends on you optimizing your portfolio and withdrawal strategy. If you’re embracing early retirement, and are looking at a retirement horizon of 30, 40, or even 50+ years, the 4% rule of thumb can still working surprisingly well for you!
Before we get to a discussion on the details of this handy tool and how it might apply to you, I should note that after talking to several financial experts in Canada, we all agree on one general observation about Canadian retirees:
It was really hard to get people who had been determined savers to spend their money!
Turns out that flipping the switch from a safe & investment mindset to an “enjoy life and spend nest egg” mindset is not as easy as one might initially think.
You’ve been reading MDJ for years, have used your Questrade DIY discount brokerage portfolio to accumulate a solid nest egg that includes your TFSA, RRSP, and perhaps even a non-registered account. Now comes the time to start your retirement drawdown or withdrawal strategy. Surprisingly, when it comes to discussing Canadian safe retirement withdrawal rates, and and talking to folks who have retired at all ages, spending their retirement savings represented a massive mental strain for them. I guess (as someone who has never retired or sold investments to pay for retirement) that I always thought that saving for retirement would be the hard part. Isn’t spending supposed to be more fun than squirreling away?
It turns out that once you get into that savings mindset, it can be hard to flip the switch back to enjoying spending the fruits of your labour. This is especially true for folks who are looking at an early retirement withdrawal rate or strategy, because they are much more likely to have been super-aggressive savers during their time in the workforce.
Since this will be my first post for MDJ, I wanted to make it a real beauty. I didn’t go into it expecting the topic to be so deep and full of variables! Afterall, the concept seems simple enough right?
How much can I take out of my investment portfolio each year, if I need that nest egg to last for 30, 35, 40, or even 50 years?
Personally, much like Frugal Trader, I’m hoping to retire sooner rather than later, so this question had particular relevance for me. After diving into the math on this topic, it turns out that there are many things to consider when looking at how long your retirement savings will last, and it’s actually much more difficult to get a 100% mastery of, than the math involved with building an investment portfolio. Use the table of contents links below to navigate the article if you’re short on time, or are only interested in one aspect of the extended article.
The 4% Retirement Withdrawal Rule
What the 4% Rule Means for Your Magic Retirement Portfolio Number
Potential Problems of the 4% Rule
How Has the 4% Rule Done In the Past
If I Want to Retire Early or do this whole “FIRE” Thing – Does the 4% Work for Me?
What Could Force My Retirement Into a Worst-Case Scenario?
Fees Suck – Get Rid of Them to Up Your Chances
Will The Returns of My Portfolio Look Like the Last 100 Years?
PWL Capital & Vanguard & the Shiller CAPE ratio
If Lower Returns Are the New Normal – How Does This Affect Me?
Avoiding the Worst-Case Scenario: Handling the First Ten Years to Reduce Your Risk
How Does OAS and CPP Factor into Safe Withdrawal Rates?
The 4% Retirement Withdrawal Rule
Ok, so let’s maybe start with the rule of thumb that advisors have used when looking at retirement drawdown plans for a while now.
Back in 1994 a financial advisor named William Bengen looked at the last 80 or so years of markets and retirement, did a bunch of math, and arrived at a concept we now call “The 4% rule”.
The basic idea of the 4% retirement withdrawal plan is that someone could safely withdraw 4% of their investment/savings portfolio each year and – assuming a 60/40 or 50/50 split of bonds/stocks in their portfolio – they would never run out of money. This idea of withdrawing a certain percentage of your portfolio to fund your retirement is called the Safe Withdrawal Rate (SWR). The math behind this magic 4% figure means that if you have the nice round $1 Million investment portfolio that we all dream of, you could safely pull out $40,000 the first year, and then adjust for inflation and withdraw 4% plus inflation after that. (So if there was 2% inflation between year one and year two, you could now withdraw $40,800.)
Bengen, and another highly influential study took their rule and retroactively applied it to retirees from every single year from 1926 to 1994. They found that nearly 100% of the time (depending on what was in the investment portfolio) people could retire, and withdraw 4% of their portfolio for 30 years of retirement – and not run out of money. In fact, a large percentage of the time, if retirees followed the 4% rule, they not only didn’t run out of money, they finished life with more money than when they started retirement!
Keep in mind, these authors didn’t worry about OAS or CPP, or a workplace pension, or even the tax implications of different types of withdrawals. They were simply trying to come up with a useful rule of thumb for how much a person could safely withdraw from their retirement portfolio.
What the 4% Rule Means for Your Magic Retirement Portfolio Number
If you can safely withdraw 4% of your portfolio to fund your retirement, then the simple math tells us that if you can accumulate 25x your annual retirement budget, you no longer have to work.
Here’s the breakdown:
- Jane looks at her budget and realizes that once she retires she will have a lot less spending demands. She carefully weighs the numbers and believes she’ll need $40,000 per year to quit her 9-to-5.
- Consequently, Jane needs the magical “4% of her portfolio” to equal $40,000 per year.
- For a 4% withdrawal to equal $40,000, Jane will need a $1,000,000 portfolio.
- If Jane reassess and realizes she needs $60,000 per year in retirement, Jane would need 25 times $60,000 (because 4% goes into 100% twenty-five times) which is $1.5 Million.
- Jane might not need anywhere close to $1.5M if she intends to do a little part-time work in retirement, and is willing to use some math + research strategies to help herself out a bit when it comes to managing her nest egg! But more on that later…
Potential Problems of the 4% Rule
The 4% rule of thumb was a BIG deal when it came to financial planning. It provided the best answer yet to the millions of retirees who desperately wanted an answer to the question:
“How much money can I take out of this portfolio each year without going broke and eating cat food as an 80-year-old?!!!”
Up until the 4% rule became a thing, when financial advisors were asked about safe withdrawal rates, the only thing they could really say is, “it depends”. Followed by a whole lot of graphs, math, and other boring stuff that no one really understood, but didn’t want to admit to not understanding.
Before we get into discussing the nitty gritty of safe withdrawal rates today, we must understand the limitations of the 4% rule. Here are the major rules that I came across after reading for roughly a hundred hours. The research I read was mostly done by people who have dedicated a major part of their life’s work to studying retirement and spending patterns across the globe. As far as I can tell, they are our best hope for trying to define just what the range of outcomes will be for various types of retirement spending + investing plans. The two major experts that I relied on most were Wade D. Pfauand Michael Kitces, with major assists to the writers behind Early Retirement Now, The Mad Fientist, and Millennial Revolution.
1) There is no way to know the future returns for any asset class. We’ll get into this more later on in the show, but basically, the vast majority of the math that these folks are basing their withdrawal rates on is underpinned by a US stock market that has done incredibly well over the last 100+ years. A few other stock markets of developed countries have done as well (Yay Canada!), but the majority of stock markets DO NOT return 10%+ over the long haul.
It turns out that when you don’t know how much money your nest egg will be generating, solving for how much money to take out becomes kind of hard to answer!
2) These withdrawal plans were mostly created with a 30-year retirement time horizon in mind. When most people were retiring at 60 or 65, and living to 75-80, a 30-year window looked like a pretty safe horizon for most people. If this still describes your plan, a 30-year horizon is probably still a pretty safe rule of thumb. If you’re looking at leaving your job at 40-50 years of age (or even earlier) and living well into your 90s, you could easily be looking at a retirement that lasts 50+ years! (Which is pretty cool to think about, really!)
3) The 4% rule doesn’t reflect how many Canadians actually invest and pay for investment advice. In a perfect world, we would all handle our own withdrawal plan and DIY our portfolio allocations and withdrawals. But many of us aren’t interested in diving into the deep end of handling our own assets. Consequently, we have to take those pesky investment-related fees into account when looking at our safe withdrawal plans. If you’re paying 2% of your returns to a mutual fund salesperson each year, you will need a lot more than $1 Million to safely withdraw 4% each year.
4) The 4% rule doesn’t take into account adjustment in behaviour. For example, Jane might take on a little part-time work to make $10,000 per year if she sees her account balance going down too fast. Or she may decide to move somewhere that has much lower living costs. A blanket rule that tries to predict 30 years into the future can’t possibly allow for all of these variables.
5) There is no OAS and/or CPP taken into consideration when looking at the 4% rule. It’s also likely that Jane might not have considered how taxes might affect how much she needs to withdraw each year.
6) The 4% rule tries to address what us finance geeks call Sequence of Return Risk – but it gets really hard to do so after you go beyond the 30-year mark of retirement. More on this below.
So, now that we know what the rules of thumb are for safe withdrawal rates that the professors of all things money have come up with, as well as some of the limitations of those rules of thumb, let’s take a look at what this might mean when applied to your retirement!
How Has the 4% Rule Done In the Past
Given all of these variables that the 4% rule doesn’t account for, you might be wondering just why it is so widely used. The truth is that I put all that naysayer stuff first because folks love to poke holes in financial theories. (For good reason, we’re talking about people’s life plans here.) Let’s look at just why the 4% rule has become the rule of thumb. Once again, as always when discussing financial planning and financial projects, one must understand that while looking at past results in the stock and bond markets is one of the best tools we have, it does not guarantee future results!
Drawing on what I’ve read from Bengen, the Trinity Study, and recent authors such as Pfau and Kitces, here’s some summary notes on just how the 4% rule would have worked in the past in the USA market. (The Canadian market has actually done slightly better most of the time, so the conclusions would be quite similar when looking at past Canadian returns.)
1) When you apply the original 4% withdrawal philosophy, not only does your money never run out over any 30-year period over the last 100 years – But 95% of the time the retiree would have finished with MORE THAN THEY STARTED WITH!
I know this sounds crazy, but companies have made a lot of money the last 100 years. If you owned a piece of them, you’ve done pretty well!
2) More than half of the time, the retiree who stuck to the 4% rule would have DOUBLED THEIR MONEY at the end of the 30-year time frame.
What this means, is that in the past, it is far more likely that retirees could have spent substantially more than that 4% withdrawal safety number, than it was that they would ever run out of money.
3) Rather than use Bengen’s 60/40 portfolio, you can actually increase your chances of favourable outcomes by skewing your portfolio to take on more stocks. Of course, your portfolio will also be likely to cause a bit more heartburn as you watch stocks gyrate up and down over the years.
4) Even folks who retired during the rough decade of the 2000s are doing just fine.
If I Want to Retire Early or do this whole “FIRE” Thing – Does the 4% Work for Me?
The short answer is: Probably Not
When you start to take rules that were created for a 30-year safe withdrawal period, and stretch them out over 50+ years, it makes sense that the rules of thumb don’t really work anymore.
Taking money out of your nest egg for that long means that you’re more likely to encounter a long-term period of rough markets, and have your money run out.
The website Early Retirement Now (created by folks who are fluent in high-level economics math and Monte Carlo simulations) have created the following chart and conclusions when it comes to safe withdrawal rates and long retirement periods. I’ve checked their assumptions with a ton of really smart people that I trust, as well as doing the math myself, and if you assume the same returns that we’ve had the past 100 years or so in North America, I can’t find anything to argue with!
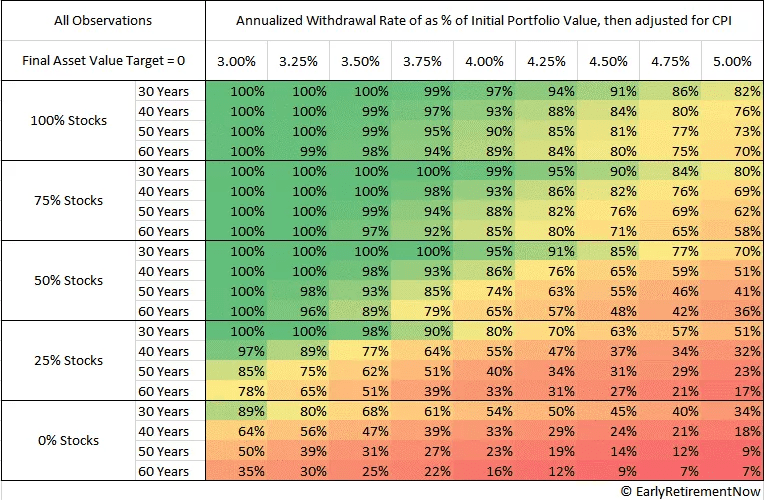
1) The 30-year 4% rule still works pretty well and a 5% withdrawal rate is only fit for the very adventurous or flexible-minded out there!
2) Tilting your portfolio towards stocks over bonds increases your chances of the best outcomes – assuming that you don’t panic when markets go down and sell at the worst times.
3) At high stock allocations, the 4% rule still worked pretty darn well for a 50- or 60-year retirement! (With past returns that is.)
4) If you want to be a truly Cautious Calibrator, scaling back to 3.5% makes it nearly impossible to run out of money with a high stock allocation – again, if you assume returns will mirror those of the last hundred years.
5) If you want to go with a more traditional 50/50 stock/bond portfolio over the long term, you might have to lower your safe withdrawal standards to 3.25%.
What Could Force My Retirement Into a Worst-Case Scenario?
The above projections are pretty rock solid for what they try to measure.
BUT
The following risks can derail those projections and are impossible to plot into the graph.
1) You could fail to pay attention to fees when it comes to managing your money and investing.
2) Future stock and bond markets won’t look like the excellent Canadian and American markets of the last 100 years.
3) You could get a few really bad years in a row at the start of your retirement, and have that start a negative downward momentum in your portfolio. Finance geeks call this a sequence of returns risk.
4) Tax changes or unforeseen emergencies could cause you to have to withdraw more of your portfolio than you anticipated.
We’ll look at each of these risks in a bit more depth, as well as how to reduce them as much as possible using some nifty strategies that I’m blatantly stealing from other people.
It’s worth noting though, that even in worst-case scenarios, the above chart from ERN still shows that you only have to make some small adjustments to keep yourself on the right track.
Fees Suck – Get Rid of Them to Up Your Chances
The 4% rule and neat little chart from ERN completely ignores the money that would be siphoned out of your account each year due to investing-related fees.
This is especially important in a Canadian context since the fees associated with many of our investing approaches are the highest in the world.
Long story short, if you’re paying 2% per year in mutual fund fees, your nest egg is going to have to be MUCH bigger before you can safely retire. That 2% is going to nibble away in good years and gobble up valuable portfolio in bad years. Your 4% rule can quickly become a “2% rule” if you’re not careful and cognisant of reducing fees to their absolute minimum. If you want to safely withdraw $40,000 per year using our new mutual fund-friendly 2% rule, you will need $2 Million! I don’t know about you – but that sounds like way less fun than the 4% rule.
The good news is that unlike returns in the stock market, you can 100% control the amount of fees that you pay!
Of course, this allergic reaction to fees is probably what allowed you to build a portfolio and retire in the first place! In all likelihood, if you clicked on this article and have read this far, you’re already aware of the corrosive effect MER fees and other types of financial advice fees can have on your portfolio. If you’re not, please check out our Questrade review and ETF/Dividend Investing articles for advice on how to build a portfolio for almost $0.
If you use a discount brokerage such Questrade, and an index ETF strategy, you won’t affect your withdrawal by more than .05% or so.
———————–
Will The Returns of My Portfolio Look Like the Last 100 Years?
Arguing about where the stock market is headed is basically the business model for 10+ TV stations, hundreds of podcasts, and thousands of websites.
There is little academic evidence to show that most people will ever be able to predict the stock market with any degree of accuracy over any time period.
That said, it’s obviously tempting when trying to figure out if you should quit your job, to try and predict to the best of your ability what the choppy waters of the stock market will do to your life-raft of a nest egg!
After reading dozens of books, dozens more academic studies, and hundreds of articles, then talking to dozens more financial experts over the years…
The only thing I’m sure about when it comes to portfolio returns is… that I’m not sure.
I’m sorry!
I wish I had a better answer.
I’m ready to tell you how to cut fees, and we’ll eventually discuss some ways to minimize risk that I’m quite confident in. But when it comes to portfolio returns, I’m not ready to put my flag in the ground. I would be very very skeptical of anyone who claims they can tell you where the stock market is going over the next five years – never mind the next 30+!
At gunpoint, here’s what I still default back to: The stock market in North America over the last 100 years has returned 9%+ annually. That market has included World Wars, epidemics, the Cold War, dozens of revolutions around the world, really dumb people running things at times (also a few smart people), thousands of costly natural disasters, and countless day-to-day events that caused a lot of people to scream “This Time Is DIFFERENT!!!”
Then it wasn’t different.
The markets (which is really a fancy way of saying “the value of the medium and large companies in North America”) went through all of that chaos, and came out the other side unscathed.
If you do a lot of reading on this topic, you’ll hear people talk about how valuations are too high, Brexit will be the domino that topples everything else, China is about to crush everyone, or that American government is so incompetent that they will destroy all life as we know it. The most compelling risk that gets a lot of attention is that climate change might not only kill a lot of us, it might also be kind of bad for our investing accounts too.
Then you can do some more reading and hear smart people say that humans working alongside AI is going to skyrocket productivity, the Green movement is going to cut living costs substantially, our major economies are so intertwined that major powers don’t go to war anymore, that lower taxes make high valuations more reasonable, and that we’ve figured out how to manage large scale country monetary policies in a less terrible way than in the past. You might also read that automation, scientific advances in agriculture and other industries, as well as lowered trade barriers amongst most countries, are unlocking growth in places we never thought of before.
After all that reading, if you’re like me, you’ll try to weigh it all out, and realize that it’s really damn hard to predict where the stock market is headed – and then you’ll default back to: “This time probably isn’t so different.”
Here’s a few of the most compelling arguments as to why forecasting using the last 100 years of the American stock market is not the best idea. Before you read below though, remember what we just discussed about people who say they know where the stock market is going.
PWL Capital & Vanguard & the Shiller CAPE ratio
From everything that I’ve read of theirs over the years, the folks at PWL Capital are some of the brightest Canadian investing writers in the business. So it caught my eye when one of their employees (Ben Felix) wrote this article on why he wouldn’t use the 4% rule at all when looking at early retirement. Basically, Ben believes that taxes, fees, and the number of years that you’re looking at living off of your portfolio in early retirement, combine together to make the 4% withdrawal rate quite risky. I think he might be overestimating the risk that taxes play because TFSAs, RRSPs and dividend tax advantages were not considered. I can make a pretty strong argument that most retirees in Canada will be able to withdraw $45,000+ in Canada each year without paying taxes at all. I’ve already addressed fees and longevity to some degree up top.
The factor that Ben cites that has the most drastic effect on our 4% rule is the expected returns. Therein lies the crux of the debate.
Ben cites the returns predicted by PWL in their Great Expectations document published in 2018. It’s written by Raymond Kerzerho and Dan Bortolotti. While I am not familiar with Mr. Kerzerho, Mr. Bortolotti (better known as the Canadian Couch Potato) has been doing excellent work in Canadian personal finance for years. I trust his judgement and research capabilities. They conclude that their recommendations to their clients will be based on the following long-term assumed overall (non-inflation adjusted) returns:
Canadian Bonds 3.2%
Canadian Equities 6.5%
US Equities 5.9%
International Developed Equities 6.8%
Emerging Market Equities 8.6%
You’ll notice that those returns are really far away from the returns of the past 100 years – and consequently the numbers that the 4% rule is based on!
In a nutshell, here’s how Dan & Co. got to those numbers.
They looked at the body of research on predicting portfolio returns and decided to draw chiefly from the influential paper that DIY-investor-favourite Vanguard put together down in the USA back in 2012, as well as their own equilibrium cost of capital (ECOC) projections. The main conclusions are:
- There is no metric that is very good (or even sort of good) at predicting stock market returns at any interval of time! This includes every common metric that most people use.
- The best (or most predictive) metric was the Shiller CAPE ratio (cyclically adjusted price-to-earnings) when judged against a 10-year time horizon.
- The USA and Canadian stock markets of the last 100 years are very unique. Most developed countries did not see similar results. (This might be related to the whole two world wars plus communism thing.)
- Both ECOC and the 10-year Shiller CAPE ratio predict substantially lower returns on a well-diversified stock market portfolio, than the returns the Canadian or American stock markets have seen over the last 100 years.
If Lower Returns Are the New Normal – How Does This Affect Me?
If the Canadian Couch Potato, his PWL colleagues, and the folks at Vanguard are correct, then the returns over the next 50 years are going to look substantially different than the last 100,(and again, I feel compelled to point out that as much respect as I have for these people, it is REALLY important to remember that no metric is very good at predicting stock market results, that “this time will be different” is a dangerous phrase, and that as responsible financial advisors, PWL must be cautious in their predictions) it obviously means that one will likely need to save more going into retirement, than they would have before in order to get the same safe withdrawal dollars per year when they are no longer working.
There are many good arguments out there that despite this predicted lower rate of returns, the 4% rule can still be very close to accurate if you tilt your portfolio more heavily toward stocks than the traditional 60/40 model. HOWEVER, it’s important to understand that if you go down that road, you absolutely need to thoroughly comprehend the math involved, the overall strategy, and have a strong enough stomach to endure watching nearly half of your nest egg disappear during a potentially really bad 2- to 5-year stretch for stocks. That could happen, and if you are tilted toward stocks, you need to be able to dispassionately look at the result and have faith in your overall strategy.
It’s also worth noting that folks such as Michael Kitces have published some excellent work on just how unlikely sustained periods of “poor returns” in the stock market are. Basically, taking all of this together, it’s quite possible that if returns are substantially lower than they have been for the past 100 years, a 3.5% rule of thumb might be more accurate for a 40+ year retirement time horizon if one wants to err on the side of caution.
That said, a traditional 30-year retirement is still pretty darn safe using the 4% rule – especially if one tilts their portfolio towards stocks.
To keep things in perspective, there is still a pretty good chance (60% or so) that even if returns average what the more pessimistic folks are predicting, a hypothetical retiree that is 100% in stocks would be just fine withdrawing 4% for 50+ years in retirement!
It’s just important to understand that a “pretty good chance” (say 60-70%) is not the same as a guarantee. The 4% rule (which Kitces later changed to the 4.5% rule when looking at 30-year retirements) is based on a virtual guarantee that a person would have never ran out of money if they had retired in the last 100 years.
All of this work is built upon probabilities, and it’s important to understand that the chance that you have of running out of money – before you run out… period – isn’t primarily determined by the average return of your portfolio over a 30, 40, or 50+ year retirement.
It’s all about WHEN those specific years happen. Your 100% stock portfolio could average a 8% return per year, but if you get a bunch of good years on the front end of your retirement, and most of the bad years on the back end, you will be swimming in money throughout your entire life by sticking to the 4% rule. On the other hand, if those bad years happen up front, that’s when you start to fall into that small group who could see their portfolio drained before they see their 80th birthday.
Sequence of Return Risk
By far the biggest risk to you withdrawing part of your investment portfolio each year to fund your retirement is that the stock market (and bond market to a lesser degree) hit a really rough patch for a prolonged period of time, right after you retire.
The basic idea is this:
- When times are good in the world of investing, the more assets that you own (“assets” are usually stocks and bonds) the more money you will make.
- When you’re building your nest egg, bad times in the world of investing are actually good for you. All of those assets that you want to accumulate are now cheaper to buy.
- When you’re selling your portfolio (and withdrawing dividends) to replace your job income, low prices on those assets are really bad. See, now you have to sell more assets to get that same $40,000 that you need to pay for all of your day-to-day expenses.
- Now, when the stock and bond markets go back up again (as they always have), you own way fewer assets that can gain value because you had to sell them to pay for life. Consequently, you can quickly get into a spiral where you have to sell more and more of the assets in your nest egg, and there are fewer and fewer assets left to take advantage of when the good times roll again.
- The flip side of this worst-case scenario, is that when the markets go up right after you retire, your measly little $40,000 withdrawals barely make a dint in your super-strong portfolio. The bad times can come later, and you still have a pretty big nest egg on which to rely.
Let’s take a look at how the sequence in which your portfolio has yearly returns, could lead to drastically different results. I’m going to ignore inflation for the time being just to keep this simple.
We’re going to look at Carl Cash’s retirement journey. His portfolio will average an 8% return for this journey – but he does not have a smooth ride where his portfolio generates a steady 8% returns each year, because as we all know, the stock market does not move in neat, linear patterns. Instead, Mr. Cash will have to weather the storm as his investments grow by $50,000+ some years, and crash to the tune of a $330,000 loss other years.
If the bad times happen too early in the ball game, and there isn’t enough capital there to take advantage of the good swings, then Carl will run out of money, and it could happen rather quickly. Here’s a look at a worst case scenario. (And here’s another look at SORR from Frugal Trader)
| Year of Retirement | Beginning Balance Minus $40,000 Withdrawal | Overall Portfolio Performance | Ending Balance |
| 1 | 960,000 | -32% | 652,000 |
| 2 | 612,000 | -10% | 550,800 |
| 3 | 510,800 | 9% | 561,800 |
| 4 | 521,800 | -10% | 469,620 |
| 5 | 429,620 | 6% | 455,397 |
| 6 | 415,397 | 8% | 382,165 |
| 7 | 342,165 | 14% | 390,058 |
| 8 | 350,058 | -16% | 290,049 |
| 9 | 250,049 | 15% | 287,556 |
| 10 | 247,556 | 12% | 277,263 |
| 11 | 237,263 | 10% | 260,989 |
| 12 | 220,989 | -2% | 216,569 |
| 13 | 176,569 | -3% | 171,272 |
| 14 | 131,272 | 12% | 147,024 |
| 15 | 107,024 | 16% | 124,148 |
| 16 | 84,148 | 9% | 91,721 |
| 17 | 51,721 | -3% | 50,169 |
| 18 | 10,169 | -24% | 7,728 |
| 19 | Mr. Cash meets Mr. Broke! | 14% | |
| 20 | 18% | ||
| 21 | 6% | ||
| 22 | 12% | ||
| 23 | -6% | ||
| 24 | -3% | ||
| 25 | 13% | ||
| 26 | 17% | ||
| 27 | 35% | ||
| 28 | 27% | ||
| 29 | -3% | ||
| 30 | 18% | ||
| 31 | 22% | ||
| 32 | 5% | ||
| 33 | 13% | ||
| 34 | 24% | ||
| 35 | 12% | ||
| 36 | 28% | ||
| 37 | 8% | ||
| 38 | 7% | ||
| 39 | 22% | ||
| 40 | 20% | ||
A few notes on this data set:
- This 40-year time period averages an 8% return – Mr. Cash’s portfolio just couldn’t hang on and survive until the good times came.
- I completely made up their hypothetical returns, and admit that I arbitrarily created a first twenty years that would be the worst ever stretch on the Canadian or American stock exchange.
- I didn’t let Mr. Cash help himself at all by using glide paths, buffer assets, or earning any extra income at all. We’ll get to those considerations later.
Now… let’s see what happens when Cash hits the retirement portfolio jackpot – even though it still only averages the same 8% over 40 years (but in this scenario the good times come first).
| Year of Retirement | Beginning Balance Minus $40,000 Withdrawal | Overall Portfolio Performance (% of returns that year) | Ending Balance |
| 1 | 960,000 | 20 | 1,152,000 |
| 2 | 1,112,000 | 22 | 1,356,640 |
| 3 | 1,316,640 | 7 | 1,408,805 |
| 4 | 1,368,805 | 8 | 1,478,309 |
| 5 | 1,438,309 | 28 | 1,841,036 |
| 6 | 1,801,036 | 12 | 2,017,160 |
| 7 | 1,977,160 | 24 | 2,451,678 |
| 8 | 2,411,678 | 13 | 2,725,197 |
| 9 | 2,685,197 | 5 | 2,819,456 |
| 10 | 2,779,456 | 22 | 3,390,937 |
| 11 | 3,350,937 | 18 | 3,954,106 |
| 12 | 3,914,106 | -3 | 3,796,682 |
| 13 | 3,756,682 | 27 | 4,770,987 |
| 14 | 4,730,987 | 35 | 6,386,832 |
| 15 | 6,346,832 | 17 | 7,425,793 |
| 16 | 7,385,793 | 13 | 8,345,947 |
| 17 | 8,305,947 | -3 | 8,056,768 |
| 18 | 8,016,768 | -6 | 7,535,762 |
| 19 | 7,495,762 | 12 | 8,395,254 |
| 20 | 8,355,254 | 6 | 8,856,569 |
| 21 | 8,816,569 | 18 | 10,403,551 |
| 22 | 10,363,551 | 14 | 11,814,448 |
| 23 | 11,774,448 | -24 | 8,948,581 |
| 24 | 8,908,581 | -3 | 8,641,323 |
| 25 | 8,601,323 | 9 | 9,375,442 |
| 26 | 8,335,442 | 16 | 10,829,113 |
| 27 | 10,789,113 | 12 | 12,083,807 |
| 28 | 12,043,807 | -3 | 11,682,493 |
| 29 | 11,642,493 | -2 | 11,409,643 |
| 30 | 11,369,643 | 10 | 12,506,607 |
| 31 | 12,466,607 | 12 | 13,962,600 |
| 32 | 13,922,600 | 15 | 16,010,990 |
| 33 | 15,970,990 | -16 | 13,415,631 |
| 34 | 13,375,631 | 14 | 15,248,220 |
| 35 | 15,208,220 | 8 | 16,424,877 |
| 36 | 16,384,877 | 6 | 17,367,970 |
| 37 | 17,327,970 | -10 | 15,595,173 |
| 38 | 15,555,173 | 9 | 16,955,139 |
| 39 | 16,915,139 | -10 | 15,223,625 |
| 40 | 15,183,625 | -32 | 10,324,865 |
So there you have it!
Figuring how much to withdraw in retirement (after having built up a million dollar portfolio) is easy as pie.
If you take out $40K per year, you could end up broke less than 20 years in, or you could end up with $10M after 40 years of worry-free living!
Now, the chances of you hitting that sort of stock market bonanza in the immediate years that you retire are quite low. We’re talking absolute best case scenario here.
One of the underrated problems with these scenarios is that many folks hit their “magic retirement number” of 25x-their-yearly-retirement-spending-needs at the very end of a great time in the stock market. This makes sense, as someone with a million dollar investment portfolio would be pretty likely to have gotten to that point at the end of a string of good years, and only very rarely at the end of a string of poor years in the stock market. (In order to be in the latter group, you’d have to be earning an excellent amount of money with a great savings rate.)
But what these two charts serve to illustrate is just how different “an 8% annual return” can look over a 40-year window.
Avoiding the Worst-Case Scenario: Handling the First Ten Years to Reduce Your Risk
When planning an early retirement, this sequence of poor returns for the 10+ years after you retire is the number one problem that needs to be avoided. Here are the main ways that smart folks have found to address the sequence of returns risk, and avoid the worst-case scenario from crippling your early retirement plans.
1) Earn a little extra in the down years.
You can see in the above worst-case scenario, that if Cash’s portfolio had just held on a little longer, good times were ahead. The problem is that he had to keep withdrawing from his portfolio to fund his day-to-day life, even when that withdrawal was gobbling up a pretty big chunk of his quickly-diminishing returns.
If he could have found some way to bring in even $20,000 per year during those down years, in order to save his portfolio from taking such big hits, he would have been ok. Alternatively, both a Mr. Cash and a Mrs. Cash could have earned $10,000 each. If there was no Mrs. Cash, then perhaps Mr. Cash could earn an extra $10,000 per year by having a roommate?
Anecdotally, I’ve found that most people who have worked hard enough, and remained disciplined enough to get to an early retirement scenario, rarely want to just quit doing anything productive. Sometimes they channel that restlessness into purely altruistic pursuits, but more often it’s channelled into a hobby that produces income, or some part-time work. Retiring from the 9-to-5, day-in-day-out grind, where you are weighed down by the stress of meeting your financial needs and/or savings targets, doesn’t usually mean a complete break with the working world.
If you have a series of great returns, and are only withdrawing “the house’s money” then there will never be a need for you to earn money ever again. On the other hand, a little freelance work or short-term contracts to protect your precious nest egg during the really rough stretches in the stock market can keep your withdrawal plan on track.
2) Buffer Assets & Emergency Buckets
There are other ways to soften the blow of a string of really bad years in the stock market. This is why many retirement planners recommend having “buckets” such as a high-interest savings account where you have 1-2 years of cash parked for the next two years of retirement, and then another bucket for 1-5 years out that is mostly filled with low-risk investments like a GIC/bond ladder, or perhaps a few ultra-safe stocks that have high dividends, and then finally the large main bucket of diversified stocks for the long run.
Personally, the more I look at the math, the more I question the need for the middle bucket at all. I think the drag on your overall portfolio of returns is NOT worth the allocation to lower-risk investments. That said, if it helps you sleep at night, or is part of an overall glide strategy (see below) then go for it.
The other interesting recent contribution to this area of mitigating sequence of returns risk is buffer assets. The previously mentioned Dr. Wade Pfau came up with the term buffer asset when he looked at the insurance industry for a way to manage portfolio risk.
The basic idea is that if a person is fortunate to have a substantial asset outside of their investment portfolio, then they can use the equity locked away in this asset to protect from that string of down years. The two main assets that Pfau mentions (I’m going to exclude some of the more exotic ones for now) are a universal life insurance plan or your house. Considering that I dislike the math behind building up a substantial universal life insurance plan, let’s focus on how using housing equity as a buffer asset might work.
If we apply the idea to Mr. Cash’s hypothetical drawdown above, we see that if he would have taken out a Home Equity Line of Credit (HELOC) or a reverse mortgage during the years his portfolio got beaten up, he would have had a lot more firepower left when the good years arrived. Theoretically, at that point, when his portfolio recovered and skyrocketed, he could have paid back the equity that he took out of his house.
Of course this strategy presents its own issues as far as people feeling deeply uncomfortable about using home equity in that way, as well as the fact that reverse mortgages are often terribly designed. I think that a judiciously-used HELOC (maybe in addition to earning a bit of cash through a side gig) could really help in a 1-5 year situation where your portfolio was taking a beating at the start of your retirement journey. Other than that, I probably wouldn’t bother with it.
3) Glide Paths (Moving Gently From a Balanced Portfolio to 100% Stocks)
You might hear me say several times in this article that the math involved in a particular calculation is somewhat complicated, and that after several hours of reading and checking my own calculations, I came to the following conclusions based on the work of mathematicians who are vastly superior to myself. I’m simply doing this to increase readability. (This article is turning into a short book already!)
Such is the case with glide paths.
This is where we start to get into some really geeky math stuff. Glide paths are the term that brainiacs use to describe a strategy for early retirees that sees someone take a much less risky portfolio in the short-term (right after they retire), and the gradually “glide” into 100% stocks as they get further into retirement, and out of that “danger zone” of the first few years. Without numbing you with dozens of graphs, here’s the general idea and conclusions reached by the experts:
- Glide paths operate contrary to what conventional financial wisdom might dictate. The idea is not to get a larger bond allocation as you get older, but rather to move your portfolio in the opposite direction and have a higher allocation to stocks as you get older and further away from the dangerous waters of the first 10 years in retirement.
- The whole goal of a glide path is to reduce the sequence of returns risk that we just went over above.
- If you want to ignore all of this glide path stuff, it’s probably not the end of the world, as the strategy does not make a drastic difference in most outcomes. We’re talking barely moves the needle on a 30-year retirement, and on a 50-year retirement, it might take your safe withdrawal rate from a 3.5% baseline to a 3.6% or 3.65% baseline.
- That said, there is substantial evidence that starting your retirement with a 60/40 stock/bond split at the start of retirement, and then gradually increasing to 100% stocks, will decrease your chances of running out of money by somewhere in the 5-20% range, depending on how long you plan to be retired for (extremely early retirement vs a conventional 30-year retirement).
- Where glide paths really shine is if someone retires right at the height of the stock market (before a bear market crash). This makes sense when you think about it logically. So if you’re contemplating retirement, and there have been many years of a bull market (*nervously typing in September of 2019*) then paying attention to a glide path makes a lot more sense.
- The opportunity cost for playing things a bit safer early on in your retirement, is that if the stock market takes off soon after retiring, you will obviously miss out on the chance to have a much larger back account, and possibly a substantially more expensive lifestyle. This is the price for more safety.
4) Setting Up a Dynamic “Guardrail” That Keeps Your Withdrawal Rate on Track
Another math-heavy idea to take some of the risk out of longer retirement time frames is to set up a variable withdrawal rate that is not married to the 4% rule. It’s similar to the “earn a little extra in the down years” scenario, where the idea is to set up rules so that when the stock market goes down, you don’t withdraw too much of your portfolio at the worst possible time.
Now, that’s far easier to say than to do. Just because the stock market goes down, your daily cost of living in retirement isn’t likely to have changed. So simply saying, “Just spend a little less when times are tough,” certainly isn’t a cure-all.
That said, if you are fortunate enough to be able to cut back your retirement spending needs at certain times, it might be worth checking out the math behind dynamic withdrawal rates done by Guyton and Klinger. The basic idea is this:
- Use the 4% rule of thumb, adjust for inflation as the 4% rule intends – but only if your portfolio gains value (already this is more work than most retirees want to do btw). If you ever get to a point where you are withdrawing 4.8% of your portfolio (due to the fact that your portfolio has shrunk), then simply drop your withdrawal amount by 10%.
- If the stock market does great, and your portfolio is up so much that your withdrawal rate has you taking out less than 3.2% of your portfolio, then increase the amount you take out by 10%.
Proponents of this dynamic withdrawal strategy point to the fact that you will never “bottom out” and completely spend your nest egg. While this is technically true, once those percentages start being applied to increasingly smaller numbers, the amount of money that you are pulling out each year can quickly become less than half of the goal amount that you originally started with. Dr Pfau examined this strategy in-depth and found that there was a 10% chance that your annual portfolio withdrawal would be cut by 84% after 30 years! That’s a poor worst case scenario, and I don’t even like the tail risk for the 10-20% above that scenario either!
The only useful takeaway of this strategy to my way of thinking is that it provides an interesting “warning trigger”, with the idea of a withdrawal taking more than 5% of your portfolio in the first twenty or so years of your retirement. If that happens, you need to start paying close attention to the math because you could be headed for that 1 in 4, or 1 in 10 scenario where the sequence of return risk is going to put you in an uncomfortable position of a quickly shrinking nest egg.
How Does OAS and CPP Factor into Safe Withdrawal Rates?
This is another factor that the PWL folks left off the table. It’s hard to project some of this stuff so far into the future, but here’s what it looks like at this point.
A little math here when looking at what an “average” early retiree couple in Canada might be faced with if they retired from the 9-to-5 grind at 40 years of age, then resided in Canada until they were 65. There are several factors that go into CPP, but I’ll use my wife and I as examples and take an educated guess at our scenario. We’ll keep everything in today’s dollars for simplicity’s sake (*hoping* that benefits will rise with inflation) and assume we both take CPP at 60 (why we would do that is a long story – but it’s not a bad idea for early retirees given the short amount of years we contribute to CPP).
If we never worked again after 40, I’d have roughly 18 years in the workforce during which I had maxed out my CPP contributions, and my wife would have 16 years in the same boat. We worked through our post-secondary years, but didn’t earn enough to contribute nearly as much to CPP at that time. The CPP math is tricky, but those 18 & 16 years when we were both maximum contributors will help us. We’ll still be below the average CPP rate for folks who retired this year however. (Which we should be considering how many years we’ll pay little-to-nothing into the Canadian Pension Plan.
Our OAS payments won’t really be affected by the early retirement however (as long as we continue to reside in Canada for all, or almost all, of our lives).
My annual CPP: Roughly $4,800
Wife’s annual CPP: Roughly $4,500
My annual OAS: $7,050
Wife’s annual OAS: $7,050
Total annual cash coming from the government when we’re both 65 (in today’s dollars) is: $23,400.
This cash works as a nice little safety net. Obviously the CPP or OAS rules could change (although they’d almost assuredly have to be grandfathered in, and I slightly underestimated on purpose, because going forward my CPP maximums will be higher than the past numbers that I used for my calculations) but I think a lot of the doomsday predictions for those social benefits are far-fetched. The CPP is one of the best-funded pension plans in the world, and the last time the government tried to slightly change the OAS, voters went crazy. I don’t think that any government will be able to make large changes to that benefit very easily. Maybe slight reductions or age delays, but I’d be shocked to see more than a 10% change in a downward direction.
I could explain the math behind trying to factor in these government benefits (and additionally, any other pension income that a person might have if they were fortunate enough to have a work pension plan) and how it would affect your withdrawal rate, but it took me the better part of a day to work my way through it. You can either take my word on the following conclusions, or you can read this post and check the math yourself. (You’ll notice our senior benefits are more substantial than those our American friends enjoy.) Here’s what those government benefits would mean for my wife and I as far as impacting our safe withdrawal rates (and ignoring our workplace pensions that most Canadians won’t be factoring in).
- The government benefits only start popping up in our bank accounts halfway-ish into our retirement, so they don’t really help us much when it comes to the big sequence of return risk in the first ten years.
- If we stick with the round numbers of wanting to spend $40,000 of today’s dollars, and a portfolio of $1,000,000, what this means is that our combined annual benefits would equal roughly 2.3% of our overall portfolio.
- We’d have 20 years until we started getting our CPP and 25 years until we were eligible to get OAS.
- The key result would be that these benefits would help us out to the tune of adding roughly .4% to our safe withdrawal rate. If we wanted to spend a combined $60,000 per year in retirement, and consequently built up a $1,500,000 portfolio to retire on, then the benefits would only represent 1.5% of our portfolio, and consequently would only add roughly .3% to our safe withdrawal rate.
In other words, the combined CPP and OAS for my wife and I, might be close to enough to shore up the dint that decreased returns put into our original 4% rule, and bring us back to the original 4% rule of thumb, even though we’d be retiring early and looking at 45+ years of retirement.
Now… this all changes when we look at a more typical retirement. If you are not quite as early of a retiree, and you work until you are 65, before you get your Canadian benefits, your math becomes a lot easier.
Basically, what you would do is determine how much that your household wanted to spend each year in retirement, then subtract the amount you would get in government benefits from that number. So, hypothetically, if we use Canadian averages for CPP and say each partner in a couple will receive $8,400 when they hit 65, plus your $7,050 OAS, then a couple would only need to drawdown roughly $29,000 per year from their portfolio to get to $60,000 per year.
Because you will have to fund fewer years during your retirement (on average) than an early retiree, the 4% safe withdrawal rate is still pretty solid, and all you would do is multiply 29,000 by 25 to get $725,000 in order to ensure that you’re good until 95. Alternatively, if you could cut your spending back to $40,000 per year, you’d only need a portfolio of $225,000.
If you contributed the maximum amount to CPP for 37+ years, then you’d be looking at higher CPP payout, and obviously the need for less of a drawdown from your portfolio each year, so you can kind of guess accordingly.
Emergencies or Tax Changes
Perhaps the biggest fear of a retiree at any age lies in what happens to a person’s financial well being in case of an emergency. Some common worries are taking care of elderly parents, unexpected child expenses far into adulthood, and increased medical costs despite the generous Canadian healthcare system.
The truth is that there are no magic answers for how to approach these emergencies. Some people sleep better at night if they have $50,000 sitting in a high-interest savings account somewhere that they have no plans to touch throughout their retirement.
Others point out that they dealt with emergencies all through their working years, and there are often ways to “get by” financially. For example, do your parents have home equity that could be used to help ease their burdens as they age? Perhaps to purchase some part-time private care? (I believe this will become a common scenario in Canada.) Can adult children that rely on you for support contribute to household expenses in a way that offsets the increased costs of having another person living at home?
Personally, I don’t want to live in fear of what will happen when I’m 90, when I’m in my 40s, 50s, 60s, and 70s. So when I try to rationally balance out my concern for the future needs of my 90-year-old self, with the immense value of freedom in early retirement, I don’t mind accepting some degree of risk in tilting toward the latter. (No doubt this is helped by the fact that my parents have diligently saved in order to provide for their retirement needs, and my wife and I do not have children.) But it’s important to note, that those calculations won’t be the same for everyone.
There are also tax change concerns that one should address. In theory, the government could decide to start taxing TFSA withdrawals different, or perhaps place limitations on the OAS program, or change the CPP slightly. As I stated above, I think these concerns are far less logical than the more “human” emergencies that we just looked at. Politically speaking, our government would have to be in an incredibly bad financial position before they looked at reducing these benefits in a meaningful way.
Once again, I think that a reasonable person could argue that for someone retiring at 60 or 65 and looking at a traditional retirement horizon, is very justified in almost ignoring these emergency fears and their affect on the 4% rule. There is just too much data to support the sustainability of a portfolio for that time horizon.
For an early or extremely-early retiree, the risks start to get magnified a bit. Your parents have more years left, your children are younger when you stop earning an income, etc. Consequently, the variability gets turned up a bit, and I think the argument to have a “do-not-withdraw-unless-emergency” account becomes a lot stronger. If working one extra year to create this account (which would be in addition to your normal portfolio accounts used to count toward the 4% rule) allows you to sleep at night, and feel a much lower level of stress in retirement, then I’d say it’s worth it. Might be worth stating again though, that if you have faith in your flexibility as far as earning income in the future, withstanding an emergency becomes less of a fear-inducing scenario.
Conclusion
I truly didn’t mean for this article to become such a Herculean task to read or write, but when you’re trying to untie a knot that has so many variable tangles, gathering one string of thought at a time can take a while.
I ultimately came to the conclusion that given our ability to keep fees and taxes low, my willingness to live a middle-class Canadian retirement (and maybe supplement with some geographical arbitrage – another topic for another day), and the generosity of our current retirement social safety net… then even IF returns are significantly lower than they have been in the past: The 4% Rule of Thumb Basically Works!
Consequently, the equivalent rule of 25x your annual spending needs in retirement = “magic retirement number”generally holds up as well.
This is definitely true for traditional 30-year retirement, and still holds up pretty well (85-95% of the time) for a 50-year Canadian retirement as well.
Here’s a few questions that you might want to ask yourself in order to generate a custom retirement plan:
1) What level of risk are you able to stomach? The math consistently says that to fund a retirement of longer than 30 years, a 100% allocation to a diversified stock market portfolio is the way to go – NOT the “less risky” bond/stock split that many investors have recommended for years. But that math won’t hold you at night when you’re having nightmares about what a 40% loss of your nest egg looks like.
2) Do you want to do the math on implementing proven strategies such as a cash barrier, a glide path, and buffer assets? If not, a 3.5% rule of thumb might be a better bet.
3) What has the stock market looked like in the years leading up to you hitting your magic number? The worse they have been, the better it is for you. The more terrible newspaper headlines you read, the better chances you will have at enjoying a stress-free luxurious retirement and being able to withdraw far more than 4% in your later retirement years. If you’re in a position like we are today, and the CAPE ratio is forecasting some storms ahead in the medium-term, then you likely want to be a bit more cautious when planning.
4) Ultimately if you’re asking yourself the classic question of “Should I work for one more year before I retire” what you need to consider in that equation (beyond the above math) is: What will my spending needs look like at, say, 85? Will they be the same as someone in their 40-70s? What sort of lifestyle price am I willing to pay in the future to get the incredible experience of a year away from work in my thirties, forties, or fifties?
Thanks for making it to the end! I promise not all of my articles going forward will be so lengthy. I just felt this article needed the space to do the topic justice.
As a sidenote – it’s an honour to be getting to write for the first ever personal finance website that I started reading back in 2008 when I was just beginning to learn about money stuff, so a big thanks to FT for bringing me on board!
If you would like to read more articles like this, you can sign up for my free weekly money tips newsletter below (we will never spam you).
