

By Hamilton ETFs
(Sponsor Blog)
Utilities have long played an important role in investor portfolios, often valued for their stability and diversification benefits. As providers of essential services such as electricity, natural gas, and infrastructure, these businesses tend to exhibit steady demand across economic cycles. In terms of investing, how investors access the utilities sector can matter just as much as the characteristics of the sector itself.
Many traditional utilities ETFs track market-cap-weighted benchmarks designed to own the entire utilities universe. While this approach provides broad exposure, it can also introduce structural inefficiencies. Market-cap weighting can overweight the largest companies, resulting in portfolios where a small number of names dominate overall exposure (i.e. concentration risk). In addition, market-cap weighting continues to increase allocations to companies as their market values grow, reinforcing exposure to recent top performers rather than maintaining a more even distribution across the sector.
The HAMILTON CHAMPIONS™ Utilities Index ETF (UMVP) follows the Solactive Canadian Utility Services High Dividend Index GTR (“Utilities Index”), which was designed to take a more selective approach. Rather than owning the entire utilities universe, the Utilities Index expands beyond traditional utilities to include pipelines and telecommunications companies, focusing on the largest companies across each sub-sector. These sub-sectors share similar business characteristics, including infrastructure-heavy operations and relatively stable demand. By equally weighting its holdings and rebalancing semi-annually, UMVP aims to provide a more balanced and diversified way to access essential services at a low management fee of 0.19%.
Why Invest in Utilities
Investors often allocate to utilities to help diversify their equity portfolios and moderate overall volatility. Demand for essential services tends to be less sensitive to economic cycles, which can make utilities a stabilizing component within a broader portfolio. Over time, these characteristics have made utilities a popular core allocation for investors seeking reliability alongside growth.
UMVP’s Utilities Index builds on this role by broadening the opportunity set beyond traditional utilities. By including pipelines and telecommunications companies, the Utilities Index captures a wider range of essential service providers while maintaining a focus on businesses with similar operating profiles.
Outperformance through a more Balanced Portfolio
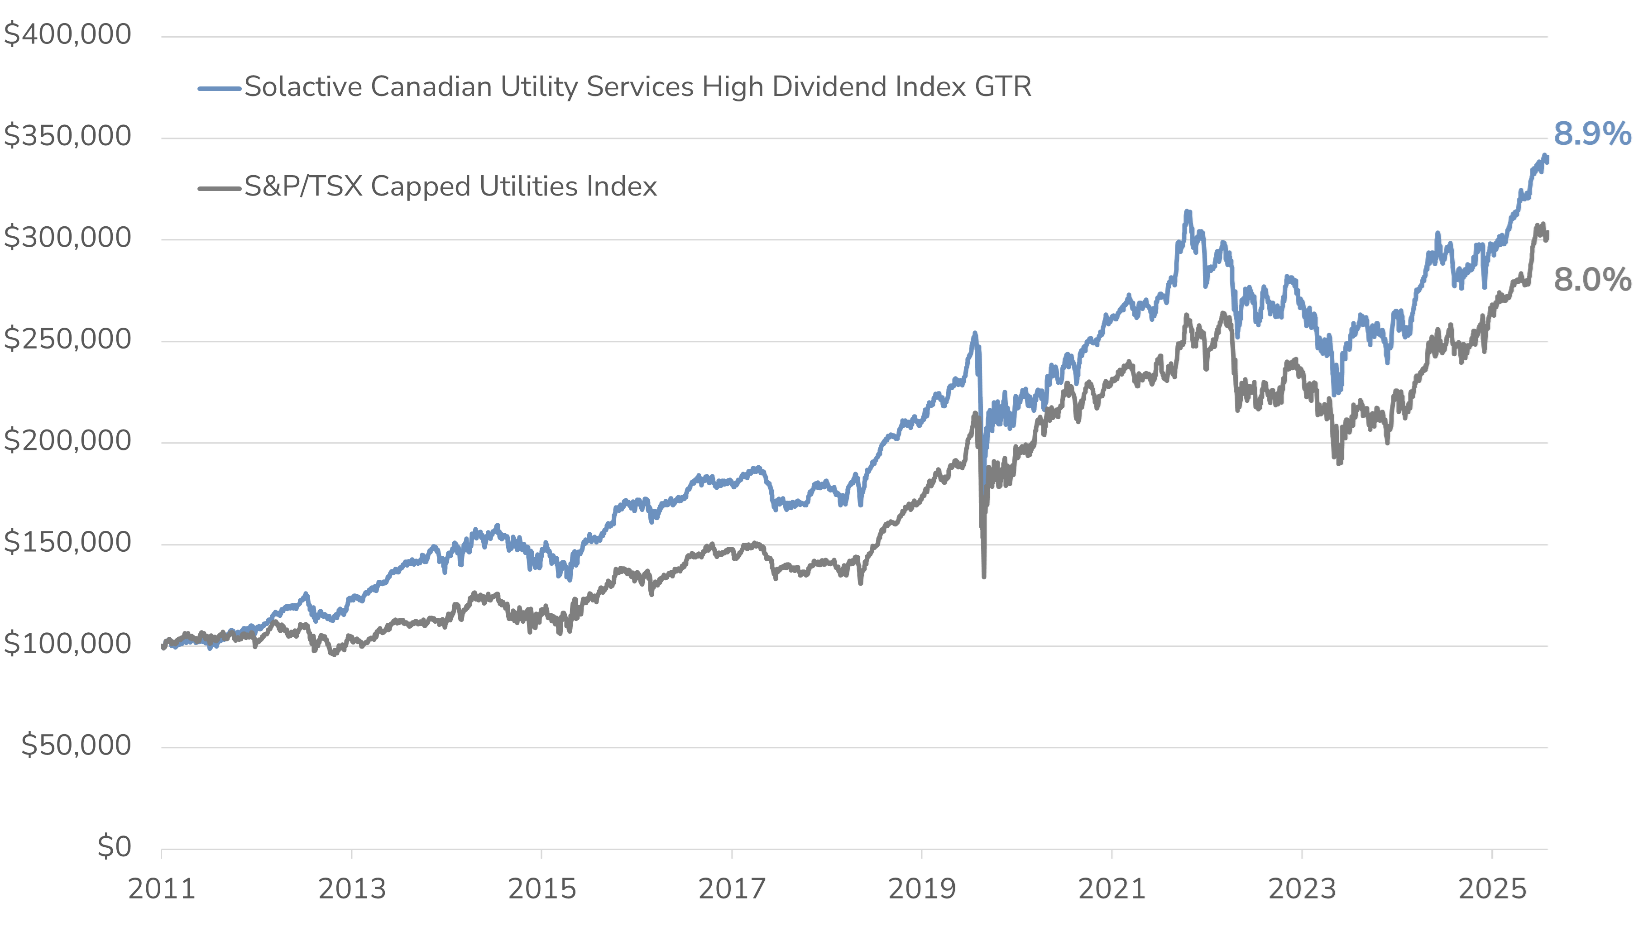
The Solactive Canadian Utility Services High Dividend Index GTR, which UMVP tracks, has historically delivered stronger total returns than the S&P/TSX Capped Utilities Index[1], as illustrated by the growth of $100,000 invested since 2011.
This performance reflects a more balanced approach to essential services investing. By expanding beyond traditional utilities and avoiding the overconcentration that can arise in market-cap-weighted indexes, the index UMVP tracks has benefited from exposure to proven companies across a broader opportunity set for low cost (0.19% management fee).
UMVP — Index Outperformance¹
The Limits of Traditional Utility Indices
Most traditional utility indices are built with two structural features that can limit their effectiveness:
First, market-cap weighting can lead to concentration risk, as the largest companies in the sector receive the largest weights. Over time, this can result in a portfolio where a small number of holdings account for a disproportionate share of total exposure.
Second, market-cap-weighted indexes tend to increase allocations to companies as they grow larger, reinforcing exposure to recent top performers. This structure can limit the opportunity to maintain balanced exposure across the sector, particularly when leadership shifts over time.
UMVP’s Utilities Index addresses both shortcomings with three key differences:
- Expanding the universe beyond traditional utilities to include telecoms and pipelines
- Selecting the largest companies in each sub-sector: utilities (6), telecoms (3), pipelines (3)
- Equally weighting the 12 holdings to minimize overconcentration (rebalanced semi-annually)
Where UMVP Fits in a Portfolio
We believe UMVP can serve as a low-cost core utility holding within a diversified equity portfolio. By focusing on the largest companies across essential service providers, UMVP provides exposure to businesses that tend to exhibit more stable demand while participating in long-term equity growth, all at an annual management fee of 0.19%.
Blue-Chip Canadian Utilities Champions

Investors looking to gain exposure to utilities may also consider:
- For enhanced growth and income potential: Hamilton Enhanced Utilities ETF (HUTS)
- For income-focused investors: Hamilton Utilities YIELD MAXIMIZER™ ETF (UMAX)
[1] Source: S&P Global, Solactive AG, Hamilton ETFs. Data from December 7, 2011 to December 31, 2025.
The graph illustrates the growth of an initial investment of $100,000 in the Solactive Canadian Utility Services High Dividend Index TR (SOLCUHDT) vs. the S&P/TSX Capped Utilities Index with annual compounded total returns. The graph is for illustrative purposes only and intended to demonstrate the historical impact of the indexes compound growth rate. It is not a projection of future index performance, nor does it reflect potential returns on investments in the ETF. Investors cannot directly invest in the index. All performance data assumes reinvestment of distributions and excludes management fees, transaction costs, and other expenses which would have impacted an investor’s returns. SOLCUHDT data prior to March 31, 2022, is hypothetical back-tested data using actual historical market data. Actual performance may have been different had the index been live during that period.
The S&P/TSX Capped Utilities Index (“Index”) and associated data are a product of S&P Dow Jones Indices LLC, its affiliates and/or their licensors and has been licensed for use by Hamilton ETFs © 2025 S&P Dow Jones Indices LLC, its affiliates and/or their licensors. All rights reserved. Redistribution or reproduction in whole or in part are prohibited without written permission of S&P Dow Jones Indices LLC. For more information on any of S&P Dow Jones Indices LLC’s indices please visit www.spdji.com. S&P® is a registered trademark of Standard & Poor’s Financial Services LLC (“SPFS”) and Dow Jones® is a registered trademark of Dow Jones Trademark Holdings LLC (“Dow Jones”). Neither S&P Dow Jones Indices LLC, SPFS, Dow Jones, their affiliates nor their licensors (“S&P DJI”) make any representation or warranty, express or implied, as to the ability of any index to accurately represent the asset class or market sector that it purports to represent and S&P DJI shall have no liability for any errors, omissions, or interruptions of any index or the data included therein.
____
A word on trading liquidity for ETFs …
Hamilton ETFs are highly liquid ETFs that can be purchased and sold easily. ETFs are as liquid as their underlying holdings and the underlying holdings trade millions of shares each day.
How does that work? When ETF investors are buying (or selling) in the market, they may transact with another ETF investor or a market maker for the ETF. At all times, even if daily volume appears low, there is a market maker – typically a large bank-owned investment dealer – willing to fill the other side of the ETF order (at net asset value plus a spread). The market maker then subscribes to create or redeem units in the ETF from the ETF manager (e.g., Hamilton ETFs), who purchases or sells the underlying holdings for the ETF.

Hamilton ETFs is dedicated to helping Canadians get more from their portfolios.
____
Commissions, management fees and expenses all may be associated with investments in exchange traded funds (ETFs) managed by Hamilton ETFs. Please read the prospectus before investing. Indicated rates of return are the historical annual compounded total returns including changes in per unit value and reinvestment of all dividends or distributions and does not take into account sales, redemptions, distribution or optional charges or income taxes payable by any securityholder that would have reduced returns. Only the returns for periods of one year or greater are annualized returns. ETFs are not guaranteed, their values change frequently and past performance may not be repeated.

Certain statements contained in this website may constitute forward-looking information within the meaning of Canadian securities laws. Forward-looking information may relate to a future outlook and anticipated distributions, events or results and may include statements regarding future financial performance. In some cases, forward-looking information can be identified by terms such as “may”, “will”, “should”, “expect”, “anticipate”, “believe”, “intend” or other similar expressions concerning matters that are not historical facts. Actual results may vary from such forward-looking information. Hamilton ETFs undertakes no obligation to update publicly or otherwise revise any forward-looking statement whether as a result of new information, future events or other such factors which affect this information, except as required by law.

Past performance is not indicative of future results. Investors cannot directly invest in the index. All performance data assumes reinvestment of distributions, and excludes management fees, transaction costs, and other expenses which would have impacted an investor’s results. The S&P/TSX 60 Index and the S&P 500 Index (“the indices”) and associated data are a product of S&P Dow Jones Indices LLC, its affiliates and/or their licensors and has been licensed for use by Hamilton ETFs © 2025 S&P Dow Jones Indices LLC, its affiliates and/or their licensors. All rights reserved. Redistribution or reproduction in whole or in part are prohibited without written permission of S&P Dow Jones Indices LLC. For more information on any of S&P Dow Jones Indices LLC’s indices please visit www.spdji.com. S&P® is a registered trademark of Standard & Poor’s Financial Services LLC (“SPFS”) and Dow Jones® is a registered trademark of Dow Jones Trademark Holdings LLC (“Dow Jones”). Neither S&P Dow Jones Indices LLC, SPFS, Dow Jones, their affiliates nor their licensors (“S&P DJI”) make any representation or warranty, express or implied, as to the ability of any index to accurately represent the asset class or market sector that it purports to represent and S&P DJI shall have no liability for any errors, omissions, or interruptions of any index or the data included therein.
