
![]() By Noah Solomon
By Noah Solomon
Special to the Financial Independence Hub
Against a backdrop of sky-high inflation, rising rates, and growing recession concerns, stocks have had a dismal year, with technology and unprofitable growth companies experiencing particularly severe losses.
Given the carnage in global markets, investors are pondering the following three questions:
- How long will the carnage last?
- How much more will equities fall before hitting bottom?
- What might it take for equity fortunes to turn?
In my commentary below, I address these questions from a historical perspective.
The current Bear Market: Fairly Average by Historical Standards
To begin, I analyzed all peak-tough declines of more than 15% in the S&P 500 Index since 1950, which are listed in the following table:
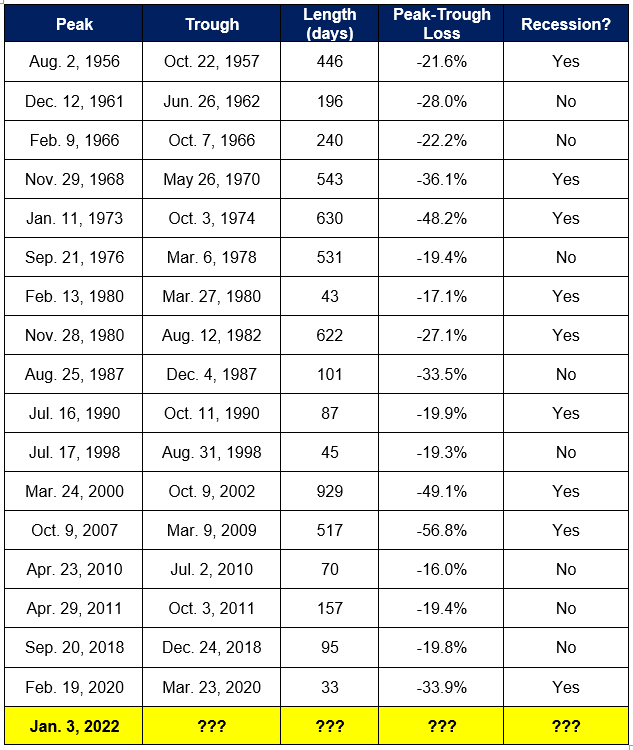
The average length of all 15%+ declines is 310.9 days. Taking the recent peak on January 3, the current bear market clocks in at 270 days as of the end of September. The time is at hand when the current decline will have become average from a historical standpoint. In terms of magnitude, the average decline has been 28.7%. As is the case with duration, we are near the point at which the current decline in prices can be construed as garden variety, with the S&P 500 Index down 24.3% from its early January peak through September 30.
Although historical averages are a useful guidepost for contextualizing where the current decline in stocks stands, they must nonetheless be taken with a large grain of salt. Of the 17 declines in the S&P 500 index since 1950, 14 have been at least 5% less or 5% more severe than the average decline of -28.7%, and five of them have fallen outside of the +/- 10% band of the average. There is no guarantee that markets will continue to decline until they match the historical average. Similarly, it is entirely possible that the current decline will eventually exceed the historical norm (perhaps meaningfully so).
Every bear market is unique in its own way. They may share certain commonalities but none of them are exactly alike. They differ either in terms of their causes, their macroeconomic environments, or the accompanying fiscal and monetary responses. Accordingly, we further scrutinized the data to ascertain whether there are any factors that can be associated with worse than run of the mill bear markets.
One Hell summons another
We found that past bear market patterns can be well-summarized by the Latin expression “abyssus abyssum invocat,” which means “one hell summons another.” Historically, once stocks have already suffered precipitous declines, they have tended to continue falling over the short term. Of the eight losses that have breached the -25% threshold, the average peak-trough loss was 39.1%. Alternately stated, during times when stocks declined by at least 25%, the panic train went into high gear, with stocks declining a further 14.1% on average.
Beware the “R” Word
Bear markets that have been accompanied by recessions have tended to be more vicious than their non-recession counterparts. Of the 17 declines in the S&P 500 Index of at least 15%, nine have been accompanied by recessions. The average length of these nine episodes is 427.8, which clocks in at a full 116 days longer than the average for all 17 observations.
Similarly, the average peak-trough decline in recessions has been 34.4%, a full 5.8% worse than the full-sample average of 28.7% and 10.1% more than the 24.3% decline from the January 3rd peak through the end of September. The historical data is clear: If you think a recession is either highly probable or inevitable you should not be in a hurry to add equity exposure.
Inflation and Growth Matter, but the Fed Rules the Roost (Fed Pivot Needed)
Inflationary peaks by themselves have had a mixed signal as a harbinger of equity market bottoms, suggesting that a peak in headline inflation is more of a necessary than sufficient condition for equities to find a trough.
While some market troughs have occurred at or near inflationary peaks, others have persisted well beyond this point. Inflationary peaks have only coincided with equity market bottoms when such peaks were accompanied by troughs in economic growth. Peaks in inflation that proved to be a good time to own equities (December 1974, March 1980, and October 1990) occurred near economic troughs. In contrast, during two of the three times when it would have been a mistake to buy equities at the peak of inflation (December 1969, January 2001, and July 2008), it was because the economy was in or about to enter a recession.
The recent correction has clearly been driven by the Fed and other central banks, which have been raising rates at the fastest clip since the 1980s to bring inflation under control. Historically, this type of monetary policy-induced decline in stocks has ended once the Fed shifted towards easier policy. In monetary tightening-induced bear markets, the Fed has historically held the trump card. In such times, equities have almost always bottomed when the Fed has begun cutting rates, regardless of whether activity has troughed.
A clear signal that tightening risks are merely receding (rather than a wholesale shift toward easing) may be sufficient to stem and possibly reverse the downward trend in equities. In my view, this possibility depends on the state of growth and employment when central banks take their feet off the monetary brakes. If neither the economy nor employment have declined materially, then a flattening out of rates is likely to coincide with a bottoming in equity markets. On the other hand, should the Fed wait for a more substantial deterioration before pausing, a trough in stock prices is more likely to require outright easing of monetary policy.
From TINA to TARA
TINA (there is no alternative) was a common factor underlying the allure of equities post global financial crisis (GFC) of 2008, and perhaps even more so post Covid-crash of March 2020. With bonds offering historically low yields, many investors felt they had little choice but to increase their allocations to stocks in order to achieve acceptable portfolio returns. Importantly, the recent spike in rates caused investor psychology to shift from TINA to TARA (there are reasonable alternatives) as the yields on cash and high-grade bonds have become increasingly attractive.
Relatedly, stocks are currently expensive relative to bonds. The following graph illustrates that equity valuations have not come down meaningfully once interest rates are considered.
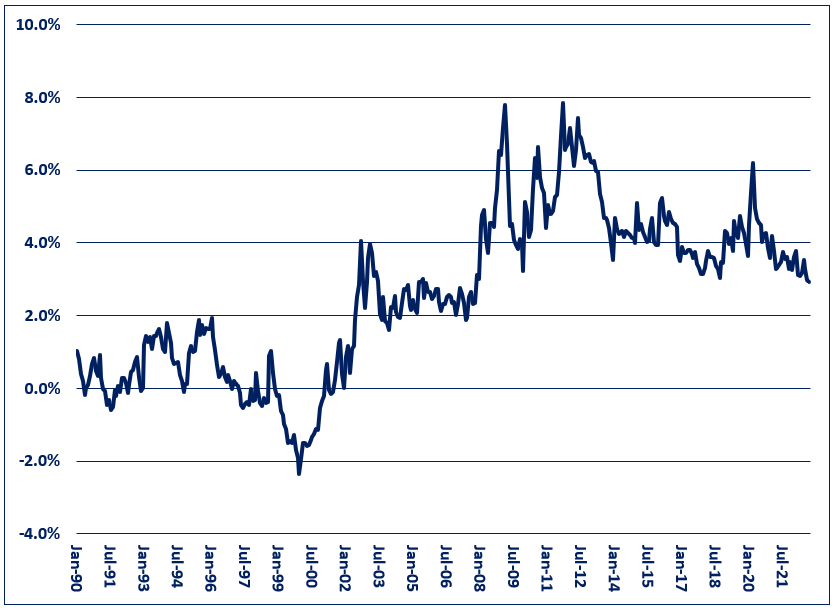
S&P 500 Index: Forward Earnings Yield – 10 Year U.S. Treasury Yield
Despite the carnage in stocks, the gap between the forward earnings yield on equities and bond yields currently stands at one of the lowest levels post GFC.
For stocks to become competitive with bonds from a valuation perspective, either:
- Stock prices need to fall further.
- Earnings growth needs to accelerate.
- Bond yields need to decline.
- Some combination of the preceding three developments is needed.
Importantly, if any of the first three variables move in the opposite direction, then this would require an even sharper adjustment in the other two factors to bring equity valuations in line with bonds.
There’s value in Value Stocks
Growth stocks trounced their value counterparts in the post GFC bull market. From the end of February 2009 through the end of 2021, the S&P 500 Growth Index outperformed its value counterpart by an astounding 424.2%.
As indicated in the following graph, the post GFC underperformance of value vs. growth stocks can be divided into two time periods, which can be respectively construed as rational and irrational.
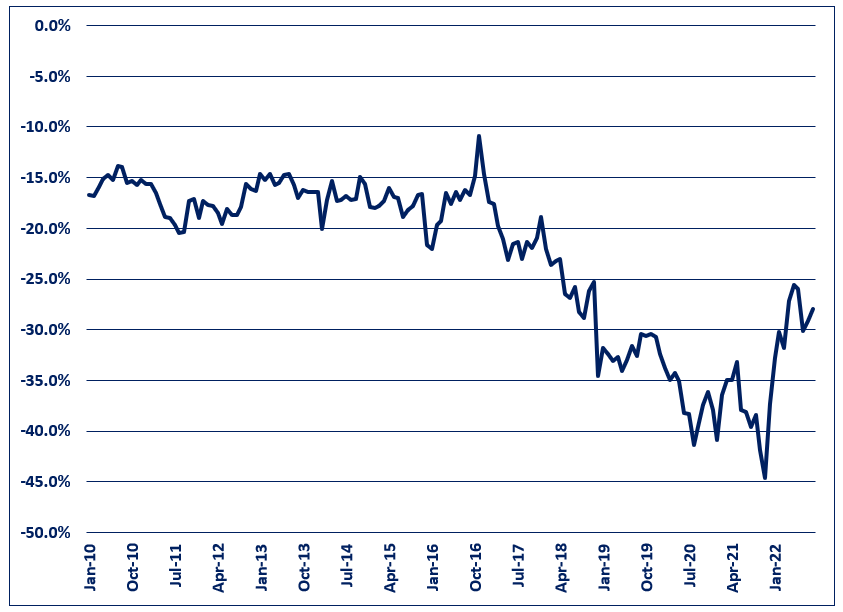
S&P 500 Index: Forward P/E Discount of Value vs. Growth Stocks
From roughly 2010 to 2017, value stocks’ underperformance was fundamentally justified as growth company earnings far outpaced those of value companies. In contrast, growth vs. value outperformance from 2018 to 2020 was driven by multiple expansion that saw growth stock valuations balloon from reasonable to nosebleed levels. This surge in growth stock multiples caused the valuation spread between growth and value stocks to reach levels that exceeded those which prevailed during late 1990s tech-bubble.
While the recent outperformance of value vs. growth stocks has started to close the growth-value valuation gap, it remains near all-time highs. This suggests that value stock outperformance is in the early stages and has plenty of room to run.
The Outcome Global Tactical Asset Allocation (GTAA) strategy, which is a core mandate that is meant to be a substitute for or a compliment to a global balanced portfolio, has successfully navigated this year’s market malaise. Since the end of January, the strategy’s underlying models have warranted a shift away from equities and other risk assets. The portfolio has since remained between 90% and 100% invested in short-term investment grade corporate bonds, which has enabled the strategy to avoid 60.6% of the losses experienced by a global balanced portfolio on a year-to-date basis through the end of September.
On the long-equity side, continued value vs. growth stock outperformance portends well for our value-oriented Canadian Equity income strategy. The fund has delivered best-in-class results, declining only 4.9% and outperforming the TSX Composite Index by 6.2% on year-to-date basis. Since its inception in October 2018, it has returned 40.0% as compared to 29.6% for the TSX Composite Index. Importantly, these results have been achieved while exhibiting lower volatility and shallower losses during challenging periods.
 From 2008 to 2016, Noah was CEO and CIO of GenFund Management Inc. (formerly Genuity Fund Management), where he designed and managed data-driven, statistically-based equity funds. Between 2002 and 2008, Noah was a proprietary trader in the equities division of Goldman Sachs, where he deployed the firm’s capital in several quantitatively-driven investment strategies.
Prior to joining Goldman, Noah worked at Citibank and Lehman Brothers. Noah holds an MBA from the Wharton School of Business at the University of Pennsylvania, where he graduated as a Palmer Scholar (top 5% of graduating class). He also holds a BA from McGill University. (magna cum laude). This article originally appeared in the September 2022 issue of the Outcome newsletter and is republished on the Hub with permission.
