All posts by Jonathan Chevreau

Retired Money: Direct Indexing has drawbacks but a hybrid DIY strategy may have merits

Image courtesy MoneySense.ca/Unsplash: Photo by Ruben Sukatendel

My latest MoneySense Retired Money column looks at a trendy new investing approach known as “Direct Indexing.” You can find the full column by clicking on the highlighted headline: What is direct indexing? Should you build your own index?

Here’s a definition from Investopedia : “Direct indexing is an approach to index investing that involves buying the individual stocks that make up an index, in the same weights as the index.”

When I first read about this, I thought this was some version of the common practice by Do-it-yourself investors who “skim” the major holdings of major indexes or ETFs, thereby avoiding any management fees associated with the ETFs. It is and it isn’t, and we explore this below.

Investopedia notes that in the past, buying all the stocks needed to replicate an index, especially large ones like the S&P 500, required hundreds of transactions: building an index one stock at a time is time-consuming and expensive if you’re paying full pop on trading commissions. However, zero-commission stock trading largely gets around this constraint, democratizing what was once the preserve of wealthy investors.   According to this article that ran in the summer at Charles River [a State Street company], direct indexing has taken off in the US: “ While direct index portfolios have been available for over 20 years, continued advancement of technology and structural industry changes have eliminated barriers to adoption, reduced cost, and created an environment conducive for the broader adoption of these types of strategies.”

These forces also means direct indexing can be attractive in Canada as well, it says. However, an October 2022 article in Canadian trade newspaper Investment Executive suggests “not everyone thinks it will take root in Canada.” It cast direct indexing as an alternative to owning ETFs or mutual funds, noting that players include Boston-based Fidelity Investments Inc, BlackRock Inc., Vanguard Group Inc., Charles Schwab and finance giants Goldman Sachs Inc. and Morgan Stanley.

An article at Morningstar Canada suggested direct indexing is “effectively … the updated version of separately managed accounts (SMA). As with direct indexing, SMAs were modified versions of mutual funds, except the funds were active rather than passive with SMAs.”

My MoneySense column quotes Wealth manager Matthew Ardrey, a vice president with Toronto-based TriDelta Financial, who is skeptical about the benefits of direct indexing: “While I always think it is good for an investor to be able to lower fees and increase flexibility in their portfolio management, I question just who this strategy is right for.” First, Ardrey addresses the fees issue: “Using the S&P500 as an example, an investor must track and trade 500 stocks to replicate this index. Though they could tax-loss-sell and otherwise tilt their allocation as they see fit, the cost of managing 500 stocks is very high: not necessarily in dollars, but in time.” It would be onerous to make 500 trades alone, especially if fractional shares are involved.

Ardrey concludes Direct indexing may be more useful for those trying to allocate to a particular sector of the market (like Canadian financials), where “a person would have to buy a lot less companies and make the trading worthwhile.”

A hybrid strategy used by DIY financial bloggers may be more doable

I would call this professional or advisor-mediated Direct Indexing and agree it seems to have severe drawbacks. However, that doesn’t mean savvy investors can’t implement their own custom approach to incorporate some of these ideas. Classic Direct Indexing seems similar but slightly different than a hybrid strategy many DIY Canadian financial bloggers have been using in recent years. They may target a particular stock index – like the S&P500 or TSX – and buy  most of the underlying stocks in similar proportions. Again, the rise of zero-commission investing and fractional share ownership has made this practical for ordinary retail investors. Continue Reading…

Recession “most probable” scenario for US and Europe in 2023: Infrastructure plays attractive, says ClearBridge


Image: Pexels/Engin Akyurt

’Tis the Season for economic forecasts. Further to the Vanguard 2023 outlook highlighted on the Hub yesterday comes various forecasts from Franklin Templeton Investments and its sub-advisors.

The selections below suggest Recession is the most likely scenario for 2023 — something Vanguard also forecast — and ClearBridge Investments sees Infrastructure assets as more promising than global equities during this period. Clearbridge runs the Franklin Clearbridge Sustainable Global Infrastructure Income Active ETFSee also this blog on Infrastructure investing from BMO ETFs, which ran on the Hub late in August.

As with Monday’s blog, we’ve highlighted relevant paragraphs directly from the horse’s mouth, including the subheadings from the various money managers. Unless otherwise indicated, images are from our image banks.

ClearBridge Investments: U.S. economic outlook by Investment Strategist Jeff Schulze

Recession is the path of least resistance

As we look ahead to 2023, recession has gone from a distantly possible scenario to the most probable one, and the potential pivot by the Fed that many equity investors are hoping for is unlikely to occur.

Our views are grounded in the reading of the ClearBridge Recession Risk Dashboard of 12 economic indicators, which has been flashing red for the past four months, indicating a recession. Eight of the 12 underlying indicators are signaling recession, including traditional recession precursors, like the 10- year/3-month Treasury yield curve, which inverted this fall. This portion of the yield curve has correctly anticipated the last eight recessions dating back to 1970, providing an average of 11 months of warning.

Image: Pexels/Mart Production

A recession is not a done deal, however. The most likely positive path involves what we have dubbed the “immaculate slackening” where the labor market tightens but not too many jobs are lost. Job openings are still more than 3 million above their pre-pandemic level (but down 1.5 million from the peak), while the total number of persons employed is only around 1 million greater than before COVID-19. This suggests room exists to loosen labor demand but not destroy as many jobs, which would help restore balance and ease wage gains. Importantly, this could help ease inflation, particularly in service industries where wages are a larger component of prices.

The most important factor to achieve a soft landing is a substantial reduction in inflation, which would allow the Fed to back off its aggressive actions. With inflation unlikely to return to 2% in 2023, and the labor market proving resilient, the Fed is likely to continue to tighten monetary policy to slow the economy and curb price increases, which will ultimately result in a recession. Monitoring the health of the labor market will be important in the coming year, given its role as a key inflation barometer for the Fed. We will also be looking for signs of weakening consumption outside of the most interest rate sensitive areas as evidence that a slowdown is taking deeper root.

ClearBridge Investments: Global infrastructure outlook by Portfolio Managers Charles Hamieh, Shane Hurst and Nick Langley

Infrastructure earnings more secure than global equities; U.S. expected to focus on renewables

From no growth in 2020 to rapid growth in 2021 to slow growth in 2022, we look at 2023 with a base case of recessions in the U.S., Europe and the U.K.

The impact on infrastructure, though, should be muted, particularly for our regulated assets, where the companies generate their cash flows, earnings and dividends from their underlying asset bases, as we expect those asset bases to increase over the next several years. As a result, infrastructure earnings look better protected compared to global equities.

Infrastructure assets more secure than global equities. Image from Franklin ClearBridge

Most infrastructure companies have a link to inflation in their revenue or returns. Regulated assets, such as utilities, have their regulated allowed returns adjusted for changes in bond yields over time. As real yields rise, utilities look poised to perform well, and we have currently tilted our infrastructure portfolios to reflect this.

As a result, the underlying valuations of infrastructure assets are relatively unaffected by changes in inflation and bond yields. However, we have seen equity market volatility associated with higher bond yields impact the prices of listed infrastructure securities, making them more compelling when compared with unlisted infrastructure valuations in the private markets.

On top of its relative appeal versus equities, infrastructure should benefit from several macro drivers in 2023 — and beyond. First, energy security is driving policy right now, and a significant amount of infrastructure will need to be built to attain energy security. High gas prices and supply constraints brought on by the Russia/Ukraine war have highlighted the importance of energy security and energy investment. This is supportive of energy infrastructure, particularly in Europe, where additional capacity is needed to supplant Russian oil and gas supply, and in the U.S., where new basins are starting up, in part to meet fresh demand from Europe. Continue Reading…

Vanguard says Balanced portfolios still offer best chance of success as Inflation gets beaten back

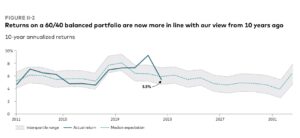
While the traditional 60/40 balanced portfolio has suffered its worst year in decades, and Recession is likely in 2023, the Vanguard Group is optimistic that balanced portfolios will thrive beyond 2023 and over the rest of the decade.

A balanced portfolio still offers the best chance of success,” is one of the top conclusions that will be unveiled Monday:  Vanguard Canada is hosting its Economic and Market Outlook for 2023, with a global virtual press conference scheduled at 11 AM [Dec. 12].  It includes Vanguard economists such as Global Chief Economist Joe Davis.

Below, received last week under embargo, are highlights of a report titled Vanguard Economic and Market Outlook for 2023: Beating back inflation. It runs about 60 pages, including numerous charts.

The text below consists mostly of excerpts from the Vanguard report, with the use of an ellipsis to indicate excisions, so there are no passages in quotation marks. Subheads are also taken from the original document. Apart from a handful of charts reproduced below, references to numerous other charts or graphs have been removed in the excerpts selected below.

Base case for 2023 is Disinflation

Our base case for 2023 is one of disinflation, but at a cost of a global recession. Inflation has likely already peaked in most markets, but reducing price pressures tied to labor markets and wage growth will take longer. As such, central banks may reasonably achieve their 2% inflation targets only in 2024 or 2025.

Consistent with our investment outlook for 2022, which focused on the need for higher short-term interest rates, central banks will continue their aggressive tightening cycle into early 2023 before pausing as inflation falls. As such, our base case has government bond yields generally peaking in 2023. Although rising interest rates have created near-term pain for investors, higher starting rates have raised our return expectations for U.S. and international bonds. We now expect U.S. and international bonds to return 4%–5% over the next decade.

Equity markets have yet to drop materially below their fair-value range, which they have historically done during recessions. Longer term, however, our global equity outlook is improving because of lower valuations and higher interest rates. Our return expectations are 2.25 percentage points higher than last year. From a U.S. dollar investor’s perspective, our Vanguard Capital Markets Model projects higher 10-year annualized returns for non-U.S. developed markets (7.2%–9.2%) and emerging markets (7%–9%) than for U.S. markets (4.7%–6.7%).

Global inflation: Persistently surprising

Our base case is a global recession in 2023 brought about by the efforts to return inflation to target … growth is likely to end 2023 flat or slightly negative in most major economies outside of China. Unemployment is likely to rise over the year but nowhere near as high as during the 2008 and 2020 downturns. Through job losses and slowing consumer demand, a downtrend in inflation is likely to persist through 2023. We don’t believe that central banks will achieve their targets of 2% inflation in 2023, but they will maintain those targets and look to achieve them through 2024 and into 2025 — or reassess them when the time is right. That time isn’t now.

Global fixed income: Brighter days ahead

The market, which was initially slow to price higher interest rates to fight elevated and persistent inflation, now believes that most central banks will have to go well past their neutral policy rates — the rate at which policy would be considered neither accommodative nor restrictive — to quell inflation.

Rising interest rates and higher interest rate expectations have lowered bond returns in 2022, creating near-term pain for investors. However the bright side of higher rates is higher interest payments. These have led our return expectations for U.S. and international bonds to increase by more than twofold. We now expect U.S. bonds to return 4.1%–5.1% per year over the next decade, compared with the 1.4%–2.4% annual returns we forecast a year ago. For international bonds, we expect returns of 4%–5% per year over the next decade, compared with our year-ago forecast of 1.3%–2.3% per year.

Global equities: Resetting expectations

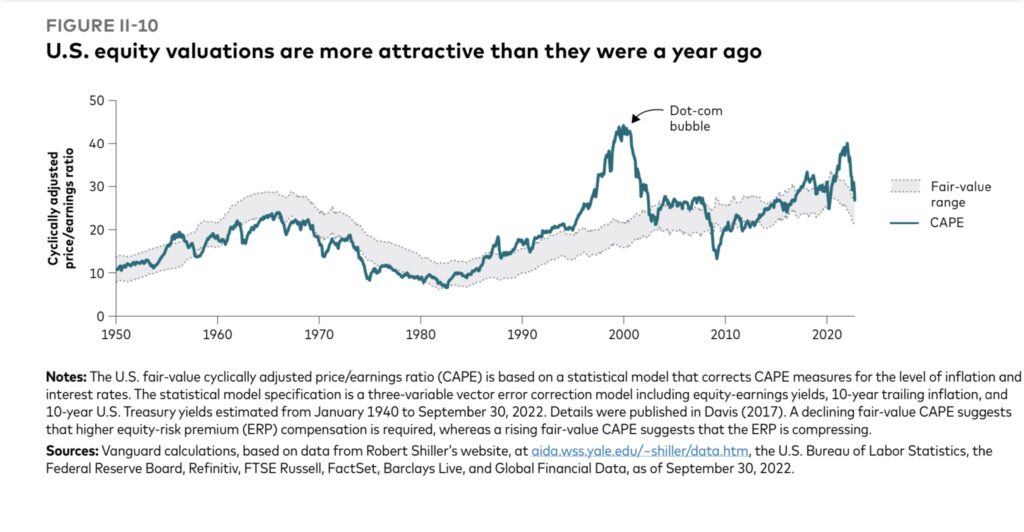
The silver lining is that this year’s bear market has improved our outlook for global equities, though our Vanguard Capital Markets Model (VCMM) projections suggest there are greater opportunities outside the United States.

Stretched valuations in the U.S. equity market in 2021 were unsustainable, and our fair-value framework suggests they still don’t reflect current economic realities.

Although U.S. equities have continued to outperform their international peers, the primary driver of that outperformance has shifted from earnings to currency over the last year. The 30% decline in emerging markets over the past 12 months has made valuations in those regions more attractive. We now expect similar returns to those of non-U.S. developed markets and view emerging markets as an important diversifier in equity portfolios.

Within the U.S. market, value stocks are fairly valued relative to growth, and small-capitalization stocks are attractive despite our expectations for weaker near-term growth. Our outlook for the global equity risk premium is still positive at 1 to 3 percentage points, but lower than last year because of a faster increase in expected bond returns

Continue Reading…

Retired Money: What Asset Class charts can teach about risk and volatility

My latest MoneySense Retired Money column addresses a topic I have regularly revisited over the years: annual charts that help investors visualize the top-performing (and bottom-performing!) asset classes. You can find the full column by clicking on the highlighted headline here: Reading the “Annual Returns of Key Asset Classes”—what it means for Canadian investors. 

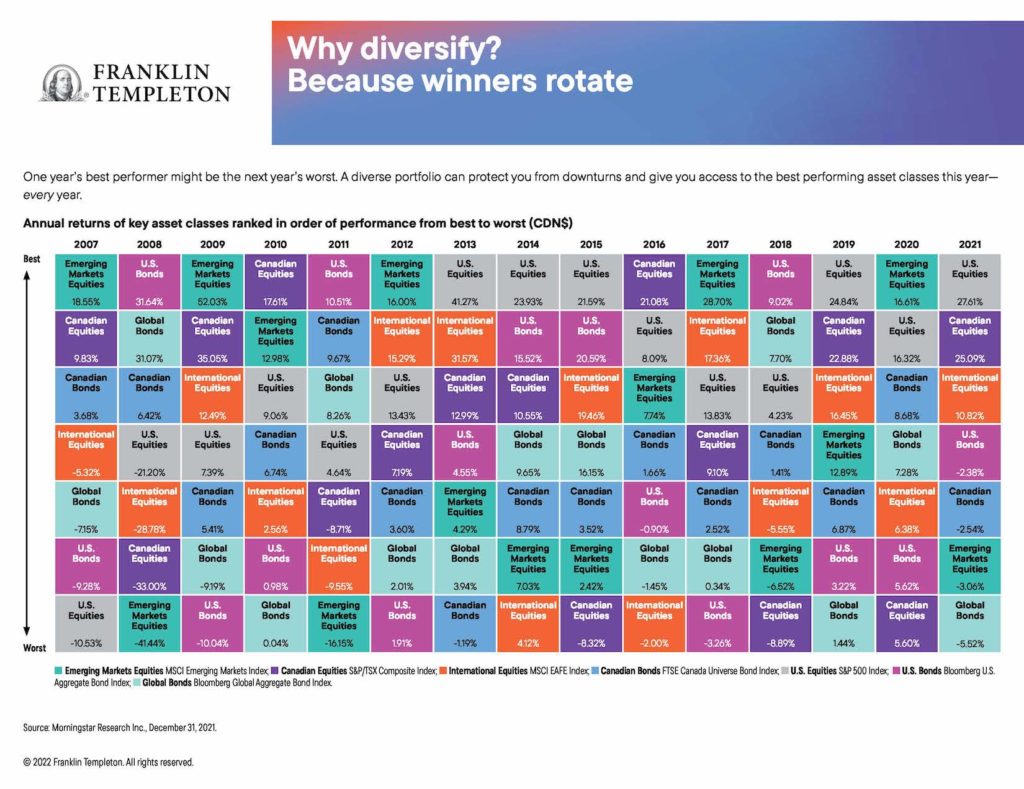
As the column notes, I always enjoyed perusing the annual asset classes rotate chart that investment giant Franklin Templeton used to distribute to financial advisors and media influencers. I still have the 2015 chart on my office wall, even though it’s years out of date.

Curious about the chart’s fate, I asked the company what had become of it, and learned it’s still available but now it’s only in digital format online. As always I find it enormously instructive. It’s still titled Why diversify? Asset classes rotate. As it goes on to explain, “one year’s best performer might be the next year’s worst. A diverse portfolio can protect your from downturns and give you access to the best performing asset classes this year – every year.”

The chart lists annual returns in Canadian dollars, based on various indexes.

Right off the top, you see that U.S. equities [the S&P500 index] are as often as not the top-producing single asset class. It topped the list five of the last nine years: from 2013 to 2015, then again in 2019 and 2021.

On the flip side, bonds tend to be the worst asset class. Over the 15 years between 2007 and 2021, at least one bond fund was at the bottom seven of those years: global bonds [as measured by the Bloomberg Global Aggregate Bond Index] in 2010, 2019 and 2021, US bonds [Bloomberg US. Aggregate Bond Index] in 2019, 2012 and 2017, and Canadian bonds [FTSE Canada Universe Bond index] in 2013. And consider that all those years were considered (in retrospect) a multi-decade bull market for bonds. You can imagine how bonds will look going forward now that interest rates have clearly bottomed and are slowly marching higher.

As you might expect, volatile asset classes like Emerging Markets [measured by the MSCI Emerging Markets index] tend to generate both outsized gains and outsized losses. EM topped the chart in five of the last 15 years (2007, 2009, 2012, 2017 and 2020) but were also at the bottom in 2008 and 2011. EM’s largest gain in that period was 52% in 2009, immediately following the 41% loss in 2008. Therein lies a tale!

The latest Templeton online charts also include a second version titled “Risk is more predictable than returns.” It notes that “Higher returns often come with higher risks. That’s why it’s important to look beyond returns when choosing a potential investment.” It ranks the asset classes from lower risk to higher risk and here the results are remarkably consistent across almost the entire 15-year time span between 2005 and 2021.

The missing alternative asset classes

This is all valuable information but alas, these charts seem to focus almost exclusively on the big two asset classes of stocks and bonds, precisely the two that are the focus of all those popular All-in-one Asset Allocation ETFs pioneered by Vanguard and soon matched by BMO, iShares, Horizons and a few others. Continue Reading…

Life after Twitter: Mastodon & other alternatives

As I posted on Twitter a few days ago, Elon Musk’s ownership is causing a lot of Twitter regulars to rethink their commitment to the platform. Personally, I have invested a lot in the Bird since joining in 2009 and so I am reluctant to storm out of there merely out of sheer petulance. Better, I think, to take a wait-and-see approach and give Elon a chance to salvage it or to burn it to the ground.

But it does behoove regulars to have a contingency plan or Plan B. Once upon a time, I viewed Google Plus as an alternative but it proved to be a virtual ghost town until Google pulled the plug on it. If Twitter keep imploding, perhaps the folks at Google will think of giving it a go again. But in the meantime, there are still LinkedIn and Facebook.

While in Spain this month, I started to experiment with the platform that seems most likely to accumulate disaffected Twitter users: Mastodon. (spelt with the letter o in two places, NOT the letter “a”!

Unlike the centralized Twitter platform, Mastodon is decentralized and that’s the first thing you need to know about it when signing on. First you have to pick a server, which is run by volunteers around the world. I picked one of the few (or only?) Canadian ones: mstdn.ca. It’s also called Mastodon Canada and bills itself as being run by Canadians for Canadians

A new meeting ground for Canadian finance Tweeters and bloggers?


Perhaps it’s too early to say, or that it’s wishful thinking, but it seems possible that a critical mass of disaffected Canadian Twitter users may be building there, including a subset of Canadian financial tweeters; I mean tooters!

For me, Truth Social was never an option, for reasons that should be obvious, given its ownership. If there are other Canadian Mastodon servers and there may be, Google Canadian Mastodon servers.

Mastodon takes some getting used to and the learning curve seems steeper than Twitter was in its heyday. At the same time, it’s fun to give one’s atrophied social media little grey cells a new workout, and it’s a learning experience to see new networks and patterns of networks evolve almost from the ground up.

It was helpful to be fairly early with Twitter and in the same way Mastodon has that pioneering feeling here in November of 2022, the first full month of Elon’s Twitter ownership. Mastodon has been around much longer but there’s little doubt there is now a wave of Twitter users descending on the place. Most of the new arrivals admit they’re looking for a possible alternative, or don’t really know why they are there, and most either need a bit of help or encouragement or are a bit more experienced and willing to offer assistance to the newbies.

In fact, mstdn.ca is so new they are still asking for volunteers to moderate and assist with the technical side for those who have the skills. They’ve also just set up a PayPal account to accept donations to offset the server costs.  Continue Reading…