Once you achieve Financial Independence, you may choose to leave salaried employment but with decades of vibrant life ahead, it’s too soon to do nothing. The new stage of life between traditional employment and Full Retirement we call Victory Lap, or Victory Lap Retirement (also the title of a new book to be published in August 2016. You can pre-order now at VictoryLapRetirement.com). You may choose to start a business, go back to school or launch an Encore Act or Legacy Career. Perhaps you become a free agent, consultant, freelance writer or to change careers and re-enter the corporate world or government.
Today we’ll look at the core Canadian equity ETFs that you might use when you build a global ETF portfolio. The Canadian stock market is dominated by financials and energy. It is not a well-diversified index. It might be a case of pick your poison, a level of ‘undiversification.’
That said, the weakness of the Canadian stock market is quickly picked up by U.S. and International market ETFs. Also, Canadian stocks can add a layer of inflation protection that is missing from the U.S. market. Once again, we’re coming back to the beauty of a global ETF portfolio, on the Sunday Reads.
Off the top, what do we mean by buying the stock market of a country or region? Have a read of … What is index investing?
Building your global ETF portfolio
For an overview of ETF portfolio building, check out the ETF model portfolio page. We’re going to build around the core assets …
You can certainly add more assets such as gold, REITs (real estate) plus U.S. and international bonds, but many Canadians will stop with a simple but effective core ETF portfolio.
The core models are offered at Tangerine Investments where I was an investment advisor and trainer for several years.
Canadian Core Equity ETFs
The most popular index used to capture the Canadian stock market is the TSX Composite. To buy the ETF that tracks the index you could use the ticker XIC-T.
The index holds 300 of the largest publicly traded companies in Canada across many sectors.
We can see that the index is dominated by Financials, Energy and Materials. It is not a well diversified index / stock market. That said, the index plays to Canada’s strengths by design. We have one of the strongest banking and insurance industries in the world, and we have the oil and gas and materials that North America and the world needs. Canadian banks have historically outperformed just about everything over the longer term (even including U.S. stocks, the S&P 500), but that doesn’t mean that you necessarily want to go all in on Canadian financials.
Another popular index for Canada is the TSX 60 ticker XIU-T. The index holds 60 of the largest companies in Canada. Here is the sector breakdown.
XIC is moving to a period of outperformance, says Morningstar due to greater exposure to materials, and less reliance on financials compared to XIU. We can say that XIC is more “diversified.” The materials index includes gold and other mining stocks that are on a tear.
Here’s the materials ETF vs XIC.
Gold and materials are very inflation-friendly. You can see the spike in the COVID period as well when we had a brief inflation scare.
iShares Core S&P/TSX Capped Composite Index ETF XIC
Here’s a look at some of your best retirement investment management options and choices. These include pensions, RRSPs, RRIFs and more.
TSInetwork.ca
Your retirement investment management plan should build in contingencies for long-term medical needs and supplemental health insurance. As well, you should factor in caring for loved ones who are unable to take care of themselves.
When you work out a plan for your retirement, make sure that you aren’t basing your future income on overly-optimistic calculations that will end up leaving you short. Retirement income can come from many different sources, such as personal savings, Canada Pension Plan, Old Age Security, company pensions, RRSPs, RRIFs, and other types of investment accounts.
Learn how your retirement investment management works in a Canada Pension Plan (CPP)
The Canada Pension Plan, or CPP, is the name for the Canadian national social insurance program. The program pays out based on contributions, and it provides income protection for individuals or their survivors in the instance of retirement, disability or death. Since 1999, the CPP has been legally permitted to invest in the stock market.
Nearly all individuals working in Canada contribute to the CPP, unless they live in Quebec, where the Quebec Pension Plan (QPP) exists and provides comparable benefits.
Applicants can apply to receive full CPP benefits at age 65. The CPP can be received as early as age 60 at a reduced rate. It can also be received as late as age 70, at an increased rate.
Here’s a look at some of the pensions or benefits provided by the Canada Pension Plan:
Retirement pension
Post-retirement pension
Death benefit
Child rearing provision
Credit splitting for divorced or separated couples
Survivor benefits
Pension sharing
Disability benefits
Use a Registered Retirement Savings Plan (RRSP) as a starting place when you look into retirement investment management
RRSPs were introduced by the federal government in 1957 to encourage Canadians to save for retirement. Before RRSPs, only individuals who belonged to employer-sponsored registered pension plans could deduct pension contributions from their taxable income.
RRSPs are a form of tax-deferred savings plan. They are a little like other investment accounts, except for their tax treatment. RRSP contributions are tax deductible, and the investments grow tax-free.
You might think of investment gains in an RRSP as a double profit. Instead of paying up to, say, 50% of your profit to the government in taxes and keeping 50% to work for you, you keep 100% of your profit working for you, until you take it out.
Convert an RRSP to a RRIF to create one of the best investments for retirement
Converting your RRSP to a RRIF is clearly one of the best of three alternatives at age 71. That’s because RRIFs offer more flexibility and tax savings than annuities or a lump-sum withdrawal (which in most cases is a poor retirement investing option, since you’ll be taxed on the entire amount in that year as ordinary income). Continue Reading…
By Bipan Rai, Managing Director, BMO Global Asset Management
(Sponsor Blog)
The end of the year is a special time. The slowing modulation of the markets gives many an analyst time to unplug, which inevitably leads to reflection about what the next year will bring. And as ideas begin to take shape, convictions start to form and a general sense of where the market is headed is reached.
It is almost always a humbling exercise.
For instance, just consider a subset of the important macro/market events from 2025:
The repeated rounds of tariffs and counter-tariffs between the U.S. and its largest trading partners (Canada/Mexico/China/EU).
A massive sell-off in the spring that took the S&P 500 into bear market territory.
The U.S. toying with the idea of raising taxes on foreign investors (Section 899).
Inflation remaining above target across many jurisdictions for most of the year.
Israel and Iran exchanging strikes: with the U.S. also getting involved by attacking Iranian nuclear sites.
Repeated attacks by the U.S. president on the sitting Fed chair, with the president openly admitting that he’d like to fire the chair and replace him with someone who is more aligned to his views.
The U.S. president attempting to remove a sitting Fed board member.
The longest U.S. government shutdown in history.
Market concentration remaining high with AI tiptoeing further into ‘bubble’ territory.
If, at the end of 2024, you had given us the above observations for 2025 there is little chance we would have expected U.S. equities to return 15-16% that year. We would have probably gotten the direction on gold right, but almost certainly whiffed on the magnitude of gains (at around 60%).
That is why we are going into this exercise clear-eyed and with a sense of trepidation (and maybe a bit of dread). What we can say is, given the current set-up the below trades are best positioned to serve our readers well as they look to calibrate for 2026. Please note, this is a very different exercise than our portfolio strategy (which will be out later in the new year). Instead of constructing a portfolio tailored for a particular investing approach, we are selecting ETF trades that we feel will outperform given the available information on the macro that we have on hand now.
First, some basic assumptions:
We expect the U.S. economy to grow at trend (1.8-2.0%1) in 2026 with inflation remaining above the 2% target for the year. Additionally, the labour sector should remain under some modest pressure, which leads the Federal Reserve to cut interest rates 1-2 more times in 25 basis-point (bps) increments.
For Canada, growth is likely to slow from this past year and settle at around 1.4-1.5%. That is still slightly below potential, which implies that inflationary pressures should remain contained. The Bank of Canada (BoC) is likely done easing for now and talks of rate hikes in late 2026 still feel premature.
We expect the S&P 500 to rally by about 8-10% in 2026.
We expect a consolidative environment for CAD and U.S. yields to start the year, which should give way to upside as the year progresses.
We see downside risks to USD/CAD2 over the next three months.
With that out of the way, let’s get started.
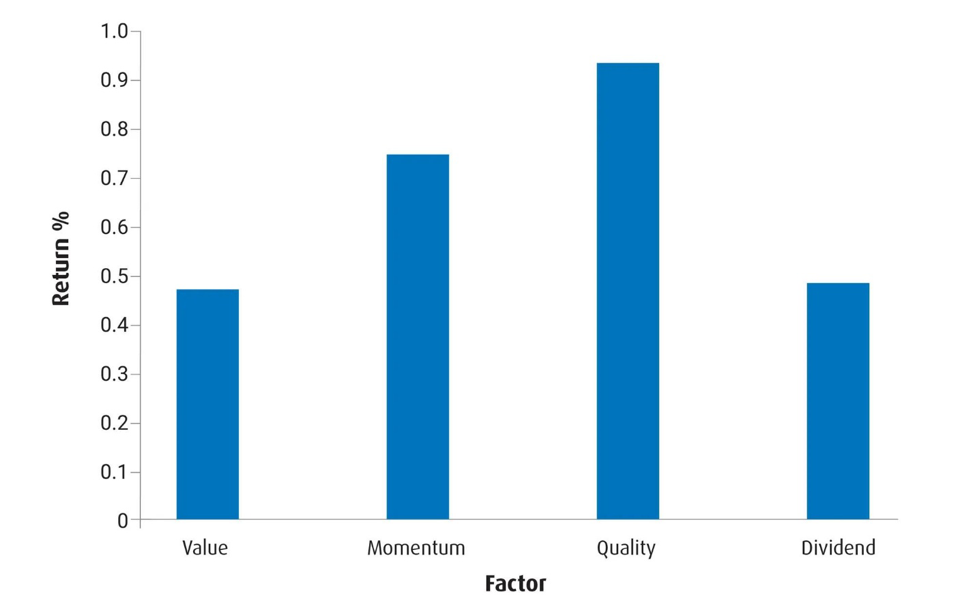
Theme #1: Late-cycle dynamics still favour Quality …
Into 2026, we’d characterize the backdrop for the U.S. economy as one that favours resilience over cyclicality. That is not least given that the current phase of economic expansion feels a bit long in the tooth and the combination of fiscal and monetary measures might lead to an economy that runs hot (i.e., higher prices, moderate growth). In such an environment, we expect investors to prioritize companies with strong balance sheets and stable earnings: important ‘Quality’ characteristics.
Chart 1 – Average monthly returns for months when Core CPI is > 2%3
Source: BMO Global Asset Management / MSCI. For U.S. factors; observations go back by 14 years.
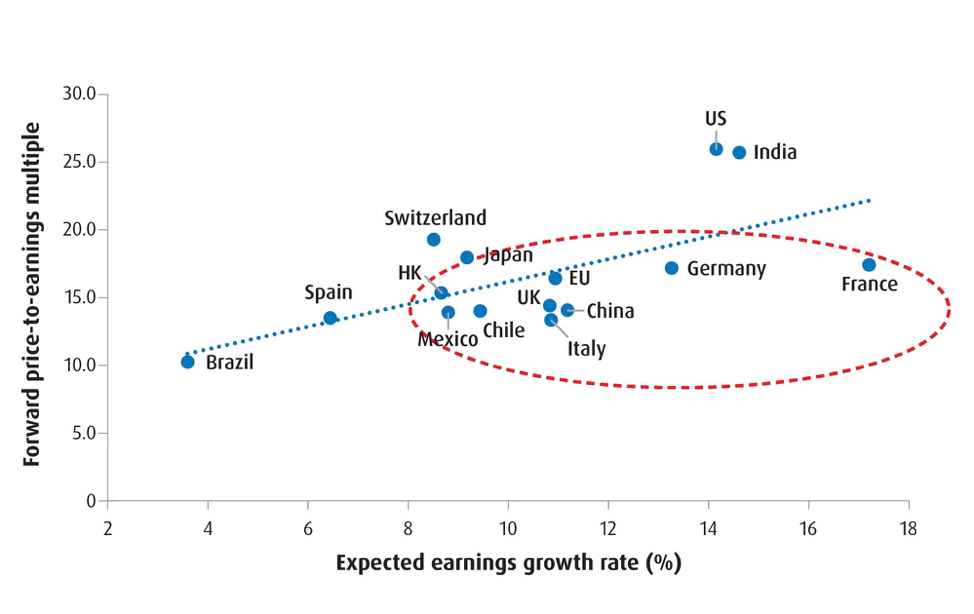
Theme #2: … But with broader leadership …
Much of 2025 was characterized by a migration of flows out of the U.S. and into EAFE and EM markets.4 Given the strength and stability of earnings outside of North America, we expect this theme to continue into 2026.
Aside from valuation (see Chart 2), two other catalysts for this resiliency will be the widespread adoption of new technologies in non-U.S. markets, and fiscal expansion in many countries. Both should work together to improve productivity trends outside of the U.S.
In the emerging world, we see the alignment of different themes working together to attract additional capital to these regions. Indeed, commodity exporters in Latam5 should continue to benefit from rising prices, while an improving backdrop in China should boost activity in smaller Asian markets.
Chart 2 – Several international markets still look cheap relative to the U.S.
Source: BMO Global Asset Management / MSCI. A forward price-to-earnings ratio (Fwd P/E) is a stock valuation metric that compares a company or stock index’s current share value to estimated future earnings over the next 12 months.
Theme #3: … And a rotation away from AI
The delicate rotation away from AI/Tech and into other sectors should continue and will likely engender further uncertainty. However, greater adoption of technology outside of Tech/Communications sectors will likely shift capital over to cheaper segments of the U.S. market.
Within the Tech/Communications sectors, we feel active strategies will be better placed to perform. That is largely because the market will become judicious about picking winners and losers in the AI race as increased reliance on debt financing will mean that existing capital structures are more heavily scrutinized. That should portend a more consolidative environment for broad tech: which supports a product like ZWT, given its generous yield.
Outside of tech, two sectors that we feel are best positioned are U.S. Health Care and Financials. In particular, Health Care has emerged as an effective hedge against AI-related concerns. The sector is still a bit ‘cheap’ as well, which has also worked to support its performance over the past months.
For Financials, we expect demand for loans in the U.S. economy to remain strong: not least as household balance sheets remain in good standing and as valuations remain cheap when compared to other sectors. An additional tailwind comes from regulatory changes that should free up more capital for deployment.
In Canada, we remain constructive on Financials but also acknowledge that the market is likely to be one in which alpha6 can be generated through more active strategies.
Indeed, we continue to like Canadian banks. Strong capital positions and the ability to generate revenues outside of traditional retail-based lending means there are plenty of opportunities for capital deployment in 2026. However, valuation remains a bit of a headwind. As such, we favour a covered call strategy instead of a beta7 one. Continue Reading…
It’s challenging enough to figure out how much you’ll want to spend at the start of retirement. Even more challenging is deciding how your spending will change as you age. These choices make a big difference in how much money you’ll need to retire. They also shape the spending options you’ll have available throughout retirement. Here I explore the good and bad parts of common wisdom on retirement spending to arrive at my own spending plan for retirement.
Spoiler alert: the “go-go, slow-go, no-go” narrative is good marketing, but it has cracks.
Two extremes
Some people focus on the early part of their retirement. They want as much money as possible available early on while they’re still young enough to enjoy it. They seem to think of their older selves as a different person who they care less about than their current selves.
Others focus on their older selves and worry about running out of money at some point. These people usually spend far less than their portfolios allow, and they tend to be resistant to spreadsheet evidence that they’d be fine spending more. Some make frugality part of their value system, and others are genuinely fearful.
A rational retirement spending plan is somewhere between these two extremes. But where?
The default
Before retirement spending research over the past decade or so, the default was to assume that retiree spending would rise with inflation each year. In real (inflation-adjusted) terms, we assumed that retiree consumption would be flat over time.
This doesn’t mean that consumption would be flat in the transition from working to retirement, though. Many expenses go away in the typical retirement. Average retirees pay less income tax, have paid off their mortgages, spend less on children, and no longer have many work-related expenses like commuting and clothing. On the other hand, retirees often spend more on hobbies. Some retirees are exceptions, but retirement experts say typical retirees need 45-70% of their working income to have the same standard of living. But after retirement starts, we used to assume flat consumption over the years.
It’s tempting to think that having retirees’ spending rising with inflation would have them matching the spending increases of their younger neighbours. However, this isn’t true. Human progress causes our consumption to rise faster than inflation over the long term. Compared to a century ago, workers are far more efficient today, and they have a wide array of products and services available that people in the 1920s never dreamed of. Progress will continue, and with each passing decade, more amazing products will become available.
If you want to fully participate in our progressing economy, you would need to plan for annual retirement spending increases of about inflation+1%. It may be rational to decide you won’t need the latest iPhone or whatever amazing new product that will come along, but it’s important to realize that planning for flat consumption is already a compromise. If you were keeping up with your neighbours at the start of retirement, you would be falling behind a decade or so later.
Go-go, slow-go, no-go
Amazon.com
The idea that we should plan to spend less each year through most of retirement has some of the best marketing around. In his book, The Prosperous Retirement, Michael Stein referred to three general phases of retirement:
Go-go years: From 60-65 to 70-75. High activity and spending.
Slow-go years: From 70-75 to 80-85. Activity and spending decline.
No-go years: From 80-85 on. Minimal activity with healthcare and long-term care costs.
This framework is easy to embrace for anyone who is still a long way from the slow-go age. We’ve all seen old-timers who seem unable to do much, and more importantly, they seem very different from us. However, if you ask someone in their early 70s if they’re into their slow-go years, don’t expect a polite response.
Already, most descriptions of the three phases have the go-go years ending at 75 instead of 70-75. With so many baby boomers now in their 70s, it’s not surprising that they don’t like to see themselves as slow-go.
Setting these self-image issues aside, are these older boomers spending less than they did in their 60s? If they are spending less, some will be doing so by choice and some by necessity because they have limited savings. How significant is this group who overspent early? Do you really want to model your own retirement in part on this overspending group?
In the end this vivid narrative paints a compelling picture of someone (but not you!) slowing down and eventually stopping altogether, but it doesn’t prove anything about how you should plan your retirement.
The research
One of the early papers researching retirement spending patterns is David Blanchett’s 2014 paper Exploring the Retirement Consumption Puzzle. This paper along with many subsequent papers have established without a doubt that the average retiree’s inflation-adjusted spending declines in early retirement and increases late in retirement as health care and long-term care costs rise.
That seems to settle it, right? We should follow the research and plan for declining consumption through early retirement, and possibly plan for health spending and long-term care costs late in retirement. But there’s a disconnect. We know what average retirees do, but is this what they should have done?
The average Canadian smokes about two cigarettes per day. Does this mean we should all plan to smoke two cigarettes each day? Of course not. This average is brought up by the minority of Canadians who smoke. If we take the smokers, whose behaviour we don’t want to emulate, out of the data, the average drops to zero. In reality, the best plan is to not smoke at all.
Carrying this thinking over to retirement spending, we need to know how many retirees overspent early in retirement and now regret it. You don’t want to emulate these people. If we could remove these people from the data, the average spending from the remaining retirees might give a better picture of what you should do. In addition, we might want to remove retirees from the data if they badly underspent.
The retirement spending smile
The Blanchett paper refers to a “retirement spending smile” that is widely misunderstood. If we draw a chart of average retiree spending over time, it starts high, falls for a decade or two, and then rises again at the end of life. People refer to this chart shape as a smile. However, in Blanchett’s 2014 paper, the smile actually referred to a chart of changes in retiree spending.
So, Blanchett observed that retiree spending changes little in early retirement, then starts to decline and this decline grows in mid-retirement, then the decline slows or even reverses to spending increases late in life.
Here is a chart of Blanchett’s annual spending change data:
Notice that the points don’t really look much like a smile. The measure of how well a curve fits some data is called R-squared. Blanchett reports that his spending smile curve has about a 33% R-squared match with the data. This is a rather weak match, and is a sign that he didn’t have enough data. Another sign of too little data is the big changes over a short time. There is no obvious reason why the spending drop should be so much more at 80 than it was at 78.
What is important but unclear is how much of this data comes from overspenders and underspenders who you don’t want to emulate. Blanchett considers the question of whether retirees spend less “by choice or by need,” and admits that “it is impossible to entirely disentangle this effect.” To explore this question he divides the retiree spending data into four groups based on whether their spending is high or low and whether their net worth is high or low. He then studied each group separately. Continue Reading…
Markets rewarded Discipline in 2025: Here’s what that Means for 2026
Canva Custom Creation: Lowrie Financial
By Steve Lowrie, CFA
Special to Financial Independence Hub
As we closed out 2025, investors found themselves in the kind of environment we all hope for but rarely experience. Global Equity markets delivered exceptionally strong results. Fixed income did exactly what fixed income is supposed to do: specifically, preserve capital and reduce volatility.
From a long-term planning perspective, this is ideal. Strong returns spread across diversified portfolios create exactly the type of environment disciplined investors are positioned to benefit from.
Periods like this also highlight an important truth about investing. Strong markets reveal whether your philosophy is sound. Weak markets reveal whether you truly believe it.
This is a good time to revisit the principles that carried disciplined investors to a successful 2025.
1. What 2025 Reinforced about Sound Investing
Every year brings events that are impossible to predict. Yet the long-term evidence continues to point in the same direction.
A globally diversified portfolio remains one of the most reliable ways to build and preserve wealth.
Market leadership shifts. This year (2025) both Canadian and International equities outperformed U.S. equities.
Maintaining a rebalancing discipline once again created value by doing the opposite of what you want to do: selling what has recently done really well and buying what has lagged.
None of these outcomes required prediction. All of them required discipline.
Discipline is what keeps investors positioned to benefit when markets move higher, which is exactly what happened in 2025.
2. A Year near All-time Highs: What that means and what it does not mean
At the time of writing, many global stock markets indices are at all-time highs. This often triggers two opposite emotions.
Some investors feel relief that their plan is working. Others feel anxiety that a pullback must be around the corner.
The reality is more straightforward. Markets spend a surprising amount of time at or near all-time highs. That is what you should expect from an asset class with a positive long-term expected return.
New highs do not forecast a crash or pullback. For example, looking back at U.S. stock returns (S&P 500) for the past almost 100 years, the return 3 and 5 years after reaching an all-time was pretty much the same as all other periods. All-time highs simply confirm that staying invested has continued to work.
The right question is not “How long will this last?”
The right question is “Is my portfolio still aligned with my goals?”
If the answer is yes, the appropriate action is usually to stay the course.
3. One Thing that stood out in 2025: The Private Investment Push
Each year, one trend tends to reach a volume that’s hard to ignore. In 2025, that trend was the surge in private investments being marketed to individual investors: private equity, private credit, real estate, liquid alternatives, and farmland structures all positioned as retail-access solutions.
None of this is new. What’s new is the scale and intensity of the sales activity behind it.
This raises a straightforward question: if private investments have historically been most beneficial for large institutions, why the sudden urgency to market them to individual investors?
A few likely factors: individual investors typically accept higher fees than institutions negotiate, private structures need steady capital inflows, and strong historical performance always attracts aggressive sales, or more commonly called “distribution” using industry jargon.
Private investments aren’t inherently problematic. They can serve a purpose for the right investor under the right conditions.
However, the current surge appears driven more by sales momentum than investor need, which is usually a signal to proceed with caution.