Victory Lap

Once you achieve Financial Independence, you may choose to leave salaried employment but with decades of vibrant life ahead, it’s too soon to do nothing. The new stage of life between traditional employment and Full Retirement we call Victory Lap, or Victory Lap Retirement (also the title of a new book to be published in August 2016. You can pre-order now at VictoryLapRetirement.com). You may choose to start a business, go back to school or launch an Encore Act or Legacy Career. Perhaps you become a free agent, consultant, freelance writer or to change careers and re-enter the corporate world or government.

The alternative to the 4% Rule isn’t a different number. It’s a different mechanism.

By Stefano Starkel

Special to Financial Independence Hub

Ask for an alternative to the 4% Rule and most people offer you 3.5%, or 5%, or a dynamic band. Those answer the wrong question. The rule’s most important feature isn’t the number: it’s the assumption buried in its first sentence.

William Bengen’s 1994 study said this: Withdraw about 4% in year one, adjust that dollar amount for inflation, and across the worst U.S. sequences he tested no portfolio was exhausted before 33 years. He has revised it upward since: to roughly 4.7% in his 2025 book. The number was never the fragile part.

Notice how you get the cash. You sell. The 4% Rule is a selling rule, and most Retirement calculators inherit that frame: the portfolio is the only lever, drawing it down the only way to reach it. So “what’s the alternative” is really two questions: a smarter way to size withdrawals, or not drawing the pile down at all?

Why the number isn’t the weak point

The fragile part of a fixed-withdrawal plan is Sequence-of-Returns risk. I run a leveraged, income-oriented book myself, and I’ve watched how brutally the order matters.

Round numbers: A $1,900,000 portfolio. $76,000 withdrawn at the start of each year, held flat, then that year’s return applied. (The real rule inflates the withdrawal; flat isolates the sequence effect, and understates the damage.) Two retirees, same three returns, opposite order.

Same returns, same withdrawals, and B finishes about $80,000 behind: a gap that compounds with every subsequent return. The reason sits in year two: B took that $76,000 from a portfolio already down to $1.28M, a 6.0% bite against A’s 3.5%. Selling a fixed amount into weakness turns a paper dip into spent-and-gone principal. Over a full retirement, that early-sequence damage is what empties portfolios: not the headline rate.

Changing the mechanism, and what it costs

One family keeps selling, but flexibly: guardrails soften Sequence Risk at the cost of variable income. Still decumulation.

The other changes the mechanism: borrow against the portfolio rather than sell it, so the assets stay invested and nothing is forced to be realised in a downturn. This is what people mean when they say the wealthy never sell. It is not a free lunch : and for a Canadian reader, considerably less free than the American version.

The loan is callable. FINRA’s mandated margin disclosure is blunt: the firm can sell your securities without contacting you, you don’t choose which ones, and you aren’t entitled to extra time. Canada is no gentler: TD Direct Investing tells clients it may sell holdings “potentially without any prior notice,” and decide which. That is the bottom-of-the-market sale the strategy exists to avoid, arriving on the broker’s schedule. Continue Reading…

Vanguard Canada launches its first actively managed domestic Fixed Income ETF

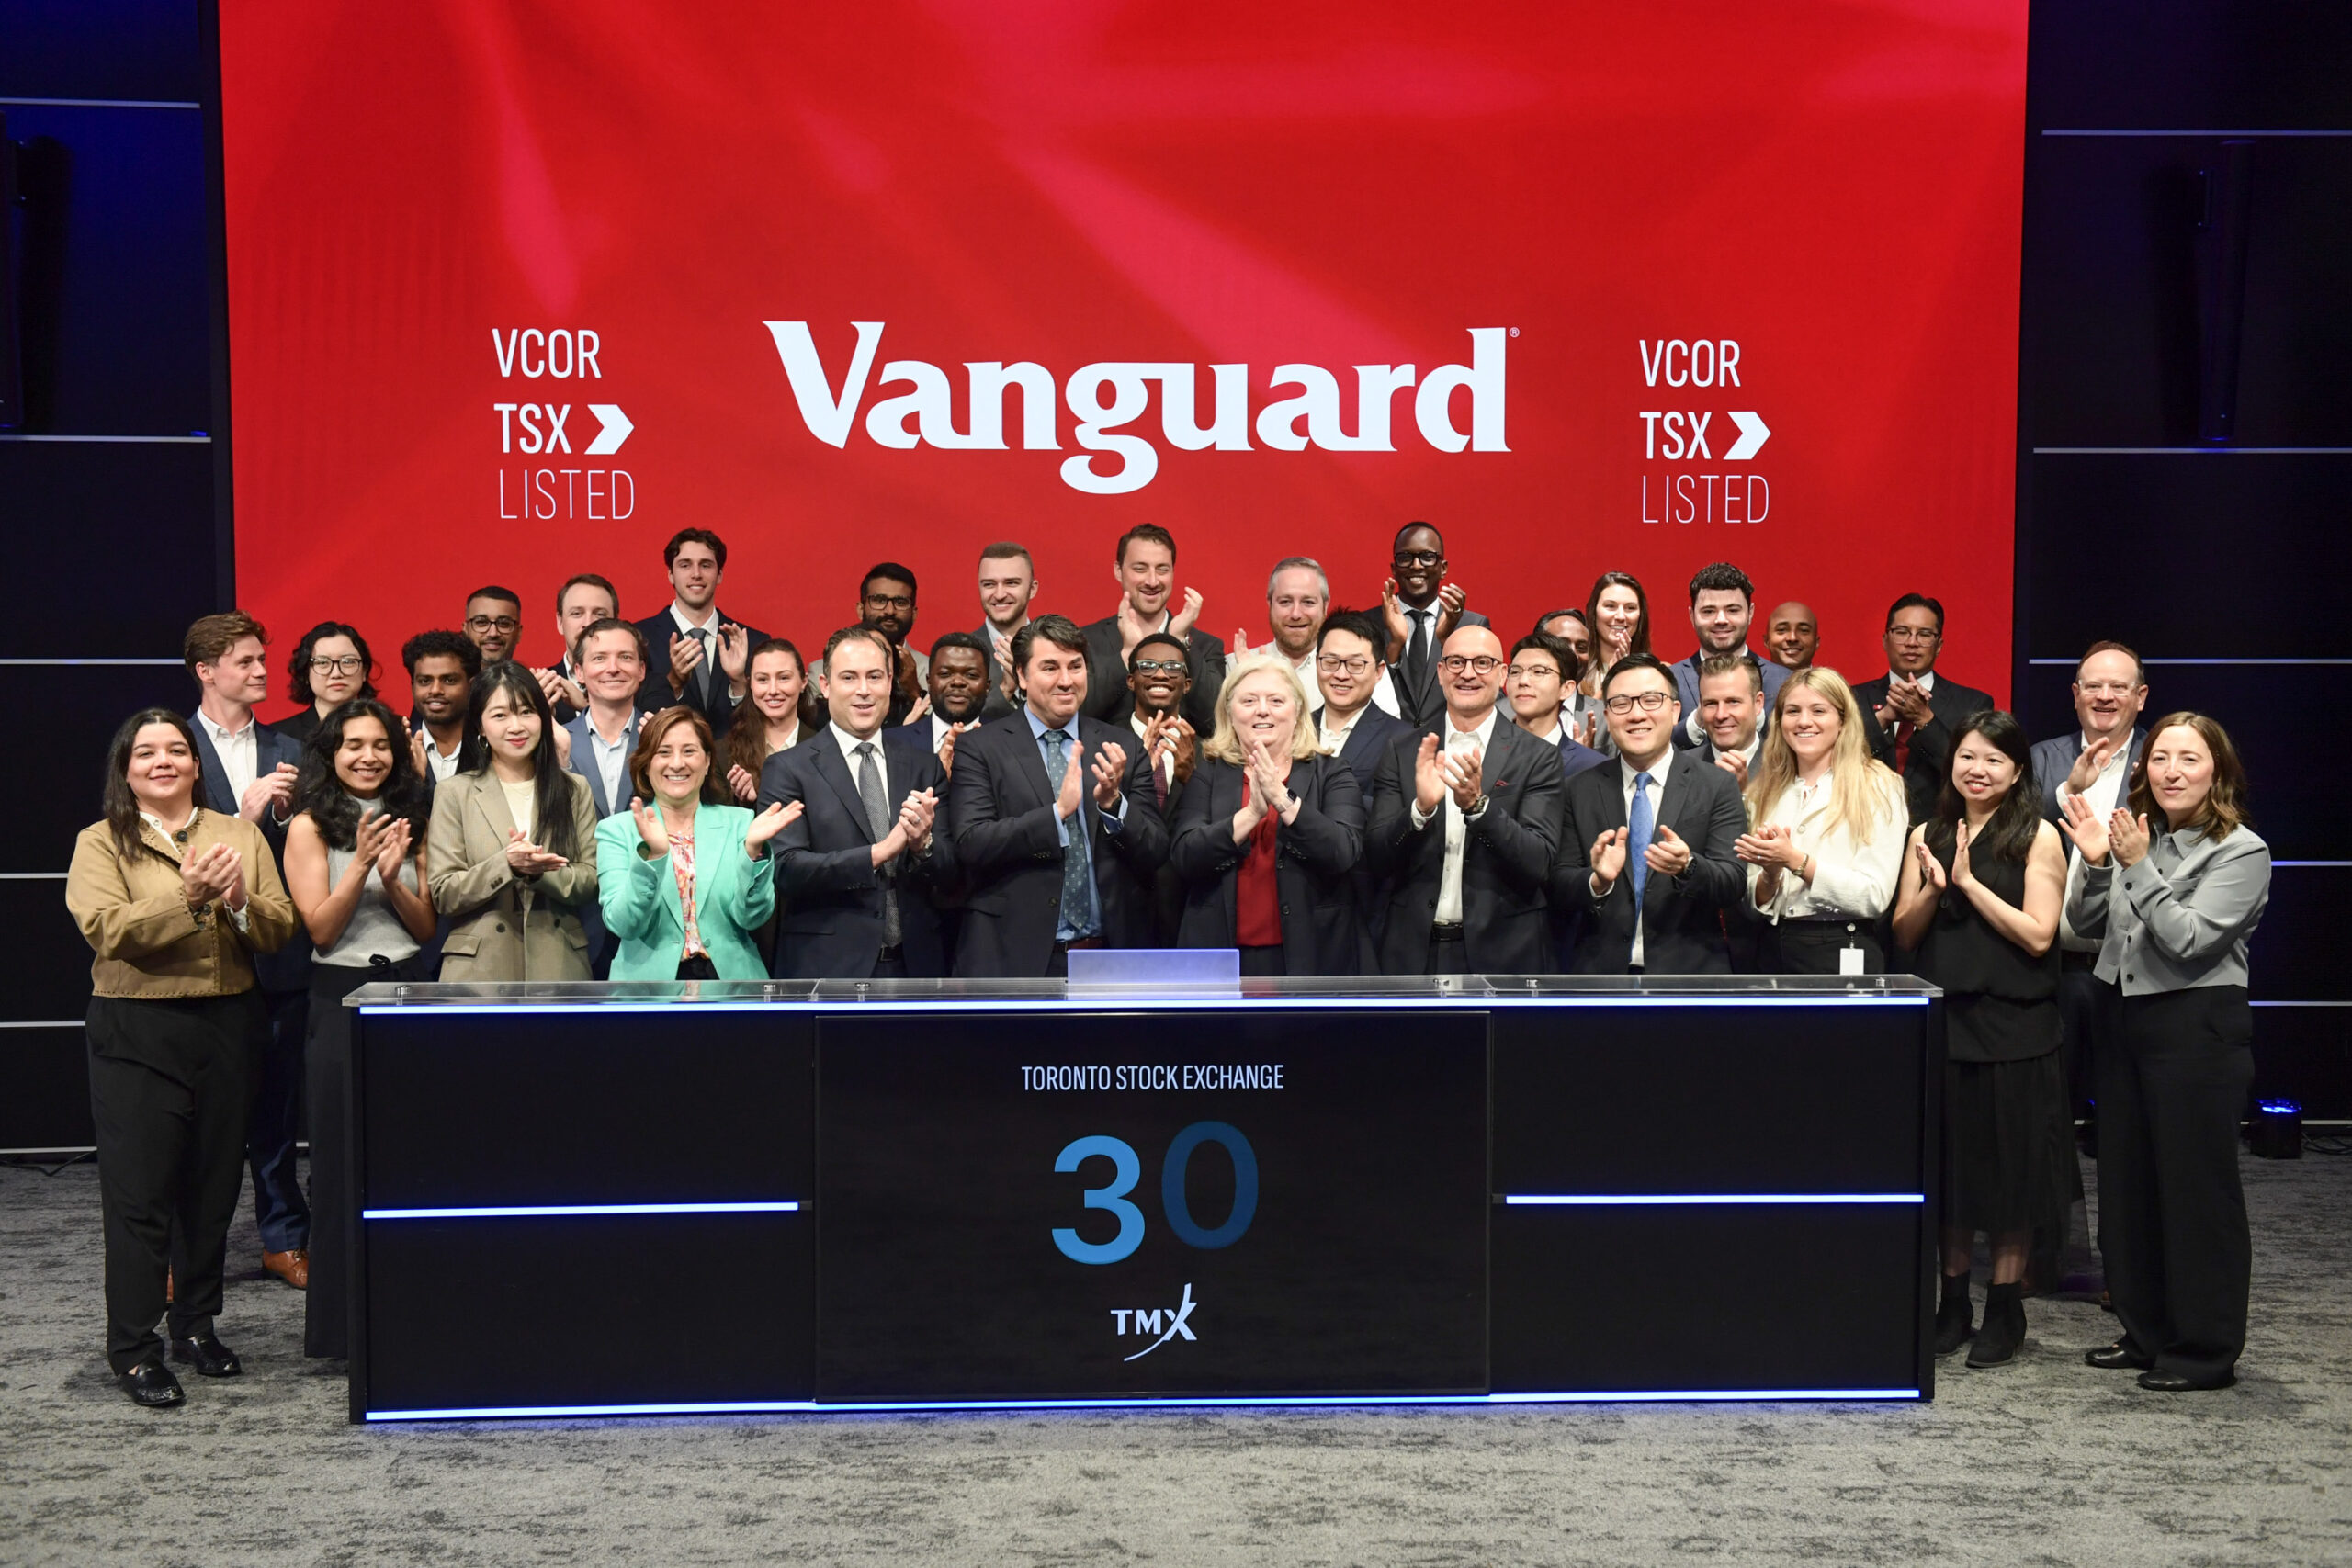
Vanguard Canada opens Toronto Stock Exchange on Sept. 9, 2026. Photo courtesy TMX Group.

Yesterday, Vanguard Investments Canada Inc. announced the launch of what it says is its first actively managed fixed-income ETF: the Vanguard Global Core-Plus Bond ETF (TSX: VCOR). VCOR began trading on the Toronto Stock Exchange on Wednesday (Sept.9, 2026), where Vanguard opened trading for the day (as shown on left.)

The new ETF was a major focus of one of two major presentations at Vanguard Canada’s annual Global Insights Forum, held in Toronto at the Royal York Hotel. The other was billed as Megatrends, AI and Market Implications.

In a press release, Vanguard Capital Management CIO and Global Head of Vanguard Fixed Income Group Sara Devereux described VCOR as being part of the firm’s push to make Vanguard’s specialized fixed-income capabilities accessible to more investors. She said it “combines the resources of our global investment platform, a disciplined active process, and broad diversification across fixed-income markets in a single ETF.”

It aims to provide investors and their financial advisors with an “actively managed, single-ticket fixed-income solution at a low management fee of 0.25%.” While the “core” allocation is to investment-grade bonds, it also invests in global rates, credit, and securitized markets,  along with a “plus” component that allocates to higher-yielding bonds.  Depending on markets, investors can expect allocations of between 20% and 50% for investment-grade credit; 0 to 20% U.S. treasuries/agency; 10 to 35% mortgages; 5 to 20% Emerging Markets debt and 0 to 20% high-yield corporates. The fund seeks to hedge its U.S.-dollar currency exposure back to the Canadian dollar and plans to pay monthly distributions.

Sal D’Angelo, Head of Vanguard Canada, said active ETFs have experienced significant growth in Canada and now account for roughly a third of Canadian ETF assets: “We continue to see strong advisor and investor demand for active global fixed-income solutions that offer broader diversification and access to a wider opportunity set.”

Bonds becoming more important for financial advisors as well as their clients

Dan Shaykevich/Linkedin

At the Forum on Wednesday, the new ETF was the focus of a presentation by Vanguard principal and senior portfolio manager Dan Shaykevich (pictured on right). Fixed income is once again playing a central role in investor portfolios, he said. As Canadian financial advisors prepare for CRM3 (Client Relationship Model Phase 3), it will also play a more important role for advisors too. The fund taps one of the world’s largest Fixed-Income money managers: Vanguard’s global fixed income team manages US4.2 trillion in assets under management, including C$30 billion in Canadian Bonds.  It’s supported by more than 20 portfolio managers, 35 traders, 50 credit researchers and at least eight quantitative analysts.

Generally speaking, financial advisors tend to spend more time with clients on equities than on Fixed Income, Shaykevich said, “even though Fixed Income may be 20 to 40%” of advisors’ money under management.

Marketing materials distributed at the event included an insert on Fixed Income Investing reminding investors that bonds can complement the growth potential of equities by providing stability, generating income and supporing diversification.

The insert lists several already existing Canadian Index-based Fixed Income ETFs. They include: Continue Reading…

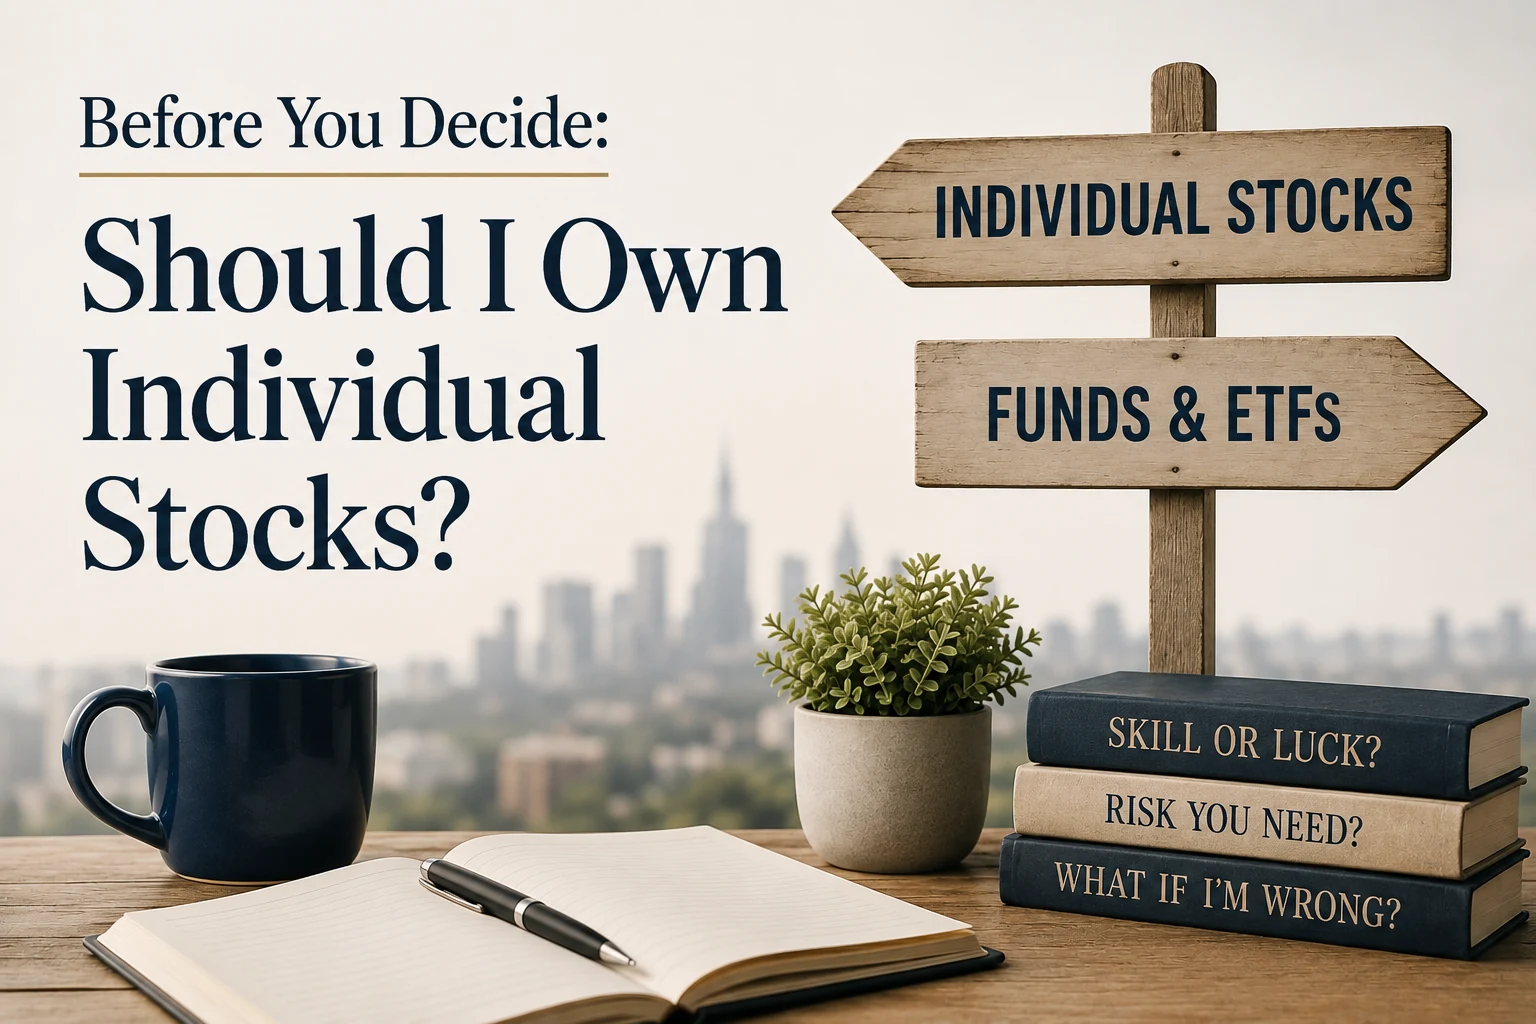
Before you Decide: Should I own Individual Stocks?

Image created with ChatGPT by Lowrie Financial


By Steve Lowrie, CFA

Special to Financial Independence Hub

The first investment I ever made was an individual stock. At that time, there were no apps or online accounts available to make this purchase. Instead, I walked into a local brokerage office, opened an account in person, sat across a desk from a stockbroker and asked him to place the trade. By the time I received the confirmation slip in the mail, roughly half of my money was gone.

What stays with me is not the loss. It is that nobody asked me anything. Nobody asked why I believed that company would do well, what would happen to my plans if I were wrong, or how much of my savings I was prepared to put behind a single idea. The order was placed, the confirmation arrived in the mail, and that was the whole of the advice. I am not certain I would have welcomed those questions at the time, since I was young and overconfident, but I have thought about them for more than thirty years and I have asked many people those same questions.

The reason they still matter is that the conversation itself has never changed. It is hard to get through a dinner or a business event without someone describing a stock they bought years ago that has gone up substantially, and what we rarely hear about is all the other stocks they bought that went nowhere. That is not because anyone is being dishonest. It is simply how memory works. We keep our winners close, we enjoy talking about them, and the disappointments quietly fall out of the story.

The stock name changes. The story never does.

There are good reasons to own stocks. Over long periods they have been one of the most effective ways to grow wealth and protect purchasing power from inflation. So the more interesting question is not whether to own stocks, but how to own them. Should you try to identify a handful of winning companies, or own a broadly diversified pool of them through mutual funds or ETFs? After more than three decades of watching Canadian families succeed and fail at this, my answer is direct: for almost every investor, there is no financial planning reason to own individual stocks. I am not saying you should never own an individual stock. I am saying the decision deserves a good reason. In my experience, most investors have never been asked to supply one.

Why is Picking Winning Individual Stocks so Difficult?

The challenge is not recognizing great companies after they have succeeded. It is identifying them beforehand, when their future is still uncertain and their share price already reflects everything millions of other investors know and expect.

Research by Arizona State University professor Hendrik Bessembinder shows just how difficult that is. In Do Stocks Outperform Treasury Bills? published in the Journal of Financial Economics, he examined the lifetime returns of every U.S. common stock since 1926 and found that the best-performing 4 per cent of listed companies accounted for the entire net wealth creation of the U.S. market above one-month Treasury bills. Slightly more than four out of every seven individual stocks did not even match the return of a Treasury bill over their lifetimes. That deserves a second read, because it means most individual stocks are not merely disappointing. Most individual stocks did worse than holding cash. Nor is this only an American phenomenon. Bessembinder and his co-authors extended the work to more than 64,000 companies worldwide and found the same pattern outside the United States.

The point is not that the stock market is a bad place to be. Over the long run it has rewarded investors generously. The point is that the reward has been concentrated in remarkably few places, which changes what you are actually attempting when you buy a handful of companies. You are not making a modest bet with slightly unfavourable odds. You are trying to locate a very small number of names inside a very large field, in advance, with a share price that already reflects everyone else’s best guess. Bessembinder tested exactly that by simulating single-stock selection repeatedly, and the single-stock strategy underperformed the broad market in 96 per cent of those simulations.

So why does anyone keep doing it? Because nothing ever tells them to stop.

You do not have to lose money for stock picking to fail. You only have to earn less than you would have earned by owning the broad market. An investor can make money every single year, comfortably ahead of any fixed-income alternative, and still be quietly falling behind the entire time. The statements look fine. There is no line item for the return you did not earn, no alert when the gap widens, and nothing that ever prompts a review. It is the most expensive kind of loss precisely because it never announces itself.

A broadly diversified portfolio removes the guessing. You will own plenty of disappointing companies along the way, but you will also own the small number of extraordinary ones, because you own all of them.

If an Individual Stock I bought went up, does that mean it was a Good Decision?

Not on its own, and this is where the first article in this series does the most work. There I made the case that a good decision can produce a bad outcome and a bad decision can produce a good one, and I offered a test for telling skill from luck: could you lose on purpose? In a game of skill you can deliberately play badly and reliably lose. In a game of chance you cannot.

Apply that test to stock picking. If you set out tomorrow to deliberately choose the worst-performing stocks in the market, could you reliably do it? Almost nobody can, and that tells you a great deal about how much skill is actually available in the activity. The answer is the same whether your last pick went up or down. So if you put a significant portion of your portfolio into one company and watched it appreciate, you may well have seen something other investors missed, or you may equally have taken a risk you did not need to take and been lucky enough to have it work out. The return by itself cannot tell you which one happened.

This matters because success changes behaviour. A winning stock reinforces our belief that we have some ability to spot winners, and once we believe that, there is no reason to change what appears to be working. I have watched that sequence more times than I can count, and it almost always runs in the same direction. The winner is rarely the last decision. It is the decision that funds the next, bigger one.

Am I taking a Risk I do not need to take?

Concentrating wealth in a few companies introduces company-specific risk, which we call uncompensated risk in investment jargon. In plain English, it is a risk that can largely be diversified away, so there is no reliable reason to expect a higher return simply for bearing it.

Concentrated portfolios can certainly outperform diversified ones, sometimes by a great deal, and that has never been in dispute. The question I would ask is a different one: do you need to take that chance to get where you are going? If a diversified portfolio already gives you a reasonable probability of accomplishing your goals, then any additional risk that could jeopardize them should clear a very high bar. In my experience, very few of them do.

Is a Canadian Portfolio as Diversified as it looks?

There is a second concentration problem that most Canadian investors never notice, and it sits underneath the first one. The Canadian market is not a balanced market. It is dominated by financial services, meaning the large banks and insurers, and by resources. Rocks and trees, as it is often described. Entire sectors that make up a large share of global markets, including technology, health care and consumer businesses, are only lightly represented here. So a portfolio invested entirely in a Canadian index is already a concentrated bet, even though it holds hundreds of companies and carries the word diversified on the label. Continue Reading…


How to tell what a Stock is actually Worth: A Beginner’s Value Checklist

Run this checklist automatically on any stock at travisvaluation.ca

By Curtis Travis

Special to the Financial Independence Hub

Nearly a century ago, Benjamin Graham — the man who taught Warren Buffett — put the whole game in one sentence: “Price is what you pay; value is what you get.”

The trouble is that your brokerage app shows you the price in giant letters and says nothing at all about the value. So, most of us end up buying the number that’s flashing, not the business behind it.

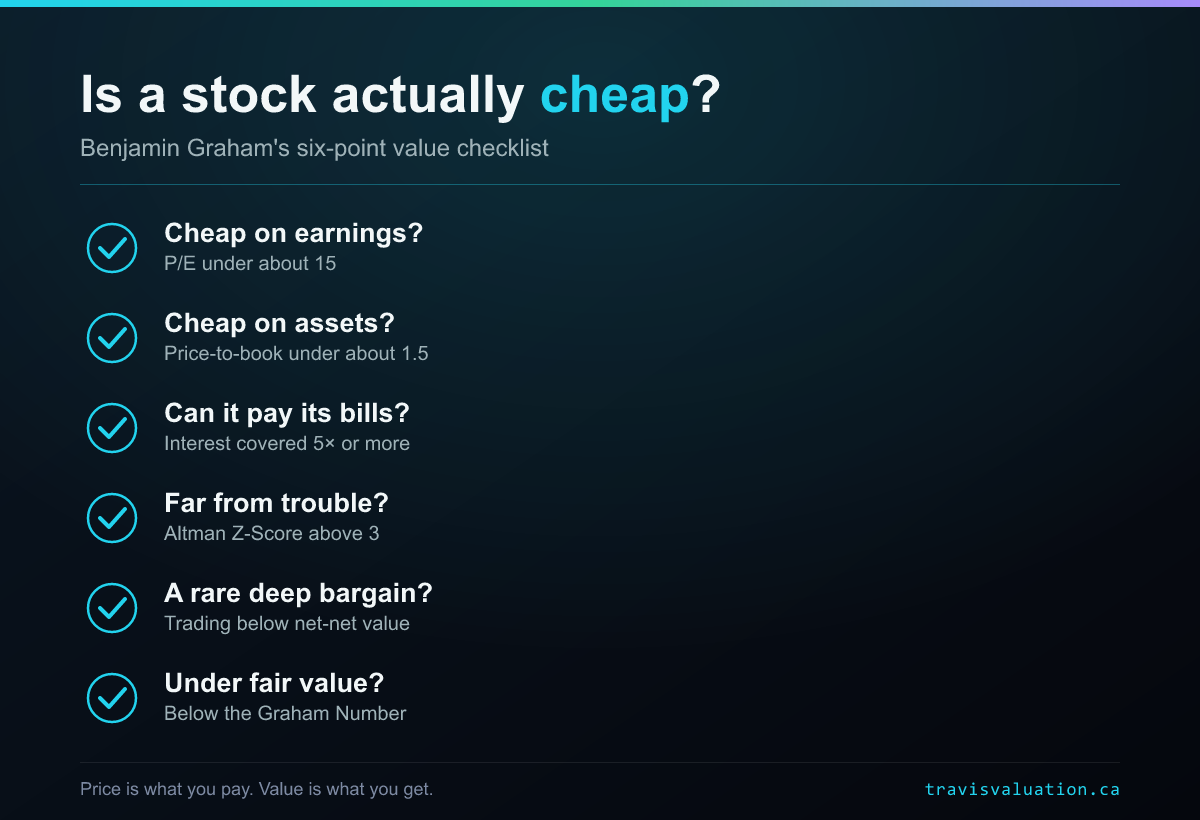
The good news is that estimating what a business is worth doesn’t require a finance degree, a Bloomberg terminal, or a spreadsheet the size of a bedsheet. Graham built his reputation on a handful of simple, repeatable checks that any patient investor can run. What follows is a beginner’s version of that checklist: six questions to ask before you buy. To keep the math clean I’ll use one example company with rounded figures: a fictional-but-typical Canadian retailer trading at $60 a share. (Real numbers move daily, so when you do this for keeps, pull the current figures first.)

Price is what you pay; value is what you’re hunting for

Before the checks, one mindset shift. A $500 stock isn’t “expensive,” and a $5 stock isn’t “cheap.” Cheap and expensive only mean something relative to what you get: the earnings, the assets, and the safety behind the share. Every check below is really the same question asked five different ways: am I paying less than this business is worth?

Check 1: Is it cheap relative to its earnings? (the P/E)

The price-to-earnings ratio is the first thing to look at. Take the share price and divide by earnings per share (EPS). Our retailer earns $5 a share, so at $60 its P/E is 12.

Graham liked to see a P/E under 15. A P/E of 12 means you’re paying $12 for every $1 of annual profit: or, flipped around, an “earnings yield” of about 8%. That’s a reasonable starting point. Anything north of 25–30 means the market is pricing in a lot of future growth, and you’re paying today for profits that may or may not show up.

Check 2: Is it cheap relative to what it owns? (the P/B)

Earnings can be lumpy, so Graham cross-checked price against the company’s book value:  roughly, what would be left for shareholders if the company sold its assets and paid off its debts. Divide price by book value per share. Our company’s book value is $40 a share, so its price-to-book is 1.5.

Graham considered 1.5 a sensible ceiling for a defensive investor. Below 1 means you’re buying the assets for less than their stated worth: rare, and worth a closer look. Well above 3 means little of what you’re paying is backed by tangible assets; you’re buying expectations.

Check 3: Can it actually pay its bills? (interest coverage)

A cheap stock that can’t service its debt isn’t a bargain:  it’s a trap. Interest coverage tells you how comfortably a company covers its loan payments: take operating earnings (EBIT) and divide by annual interest expense. Our retailer covers its interest 8 times over.

As a rule of thumb, above 5x is comfortable, and below 2x is a flashing yellow light: a bad year could put the company in a squeeze. This one check quietly eliminates a lot of “value traps” that look cheap only because they’re fragile.

Check 4: How close is it to trouble? (the Altman Z-Score)

In the 1960s, professor Edward Altman combined five financial ratios into a single distress-predictor called the Z-Score. You don’t need to compute it by hand, but you should know how to read it:

Above 3.0 — financially healthy. 1.8 to 3.0 — a grey zone; tread carefully. Below 1.8 : elevated risk of serious financial distress.

Our example lands around 3.2: solid. The Z-Score is a wonderful “sniff test” precisely because it’s hard to fool: a company can dress up one ratio, but rarely all five at once.

Check 5: The rare, deep bargain (net-net / net current asset value)

This is Graham’s most famous trick, and his most demanding. Add up only a company’s current assets — cash, receivables, inventory — then subtract all its liabilities. Divide by shares outstanding. If the stock trades below that “net current asset value,” you’re theoretically buying the ongoing business for less than nothing. Continue Reading…

Covered Call ETFs: Why Total Return matters

High yield doesn’t equal better returns: Learn how covered call ETFs really work and why Total Return matters before you invest.

Getty Images, courtesy BMO

By Jimmy Xu, BMO Global Asset Management

(Sponsor Blog)

Covered call ETFs have become a popular solution for investors seeking cash flow, particularly in today’s uncertain market environment. With distribution yields that are often meaningfully higher than traditional equity ETFs, they can appear attractive at first glance.

But focusing on yield alone can be misleading.

To properly evaluate covered call ETFs, investors need to look beyond the potential yield and focus on Total Return: and understand how different strategies are implemented.

What are Covered Call ETFs?

Covered call ETFs generate returns by holding a portfolio of equities and selling call options1 on some or all of those holdings.

This strategy produces three sources of return:

  • Dividends
  • Net stock price appreciation from the equities held
  • Option premiums2 from the calls sold

In exchange for that additional return generated from the option premiums, investors give up some upside potential if markets rise strongly: because the ETF may cap some upside participation at predetermined prices.

The result is typically higher cash flow with lower volatility, but more muted upside in strong markets.

The problem with Focusing only on Yield

One of the biggest misconceptions about covered call ETFs is equating high yield with strong performance.

In reality, yield is only one component of return. What ultimately matters is Total Return: the combination of dividends, premiums and equity price appreciation.

A strategy that pays a 10% yield but delivers little or no equity capital growth may lag a lower-yielding strategy over time; investors may also experience the net asset value (NAV) decline over time as distributions erode the initial investment. Conversely, a covered call ETF that balances premium generation with participation in market upside can potentially deliver stronger total outcomes.

That’s why evaluating these ETFs requires a broader lens asking questions such as: how much upside is being sacrificed? How sustainable are the distributions? What is the long-term return profile?

BMO’s Covered Call Approach: A more active Framework

Not all covered call strategies are built the same. BMO’s approach differs in two key ways:

  1. Active Option Management

Rather than mechanically selling calls on a fixed percentage of the portfolio, BMO takes a more active approach: adjusting the following based on timing and market conditions:

  • The percentage of the portfolio covered
  • Strike price selection (how far “out of the money” calls are written)

This allows the strategy to balance cash flow generation with participation in equity upside, particularly during stronger markets.

  1. Partial Coverage vs. Fully Covered

Some covered call ETFs write options on nearly the entire portfolio, maximizing distributions but limiting growth potential.

BMO strategies uses a range of partial coverage, meaning a portion of the portfolio remains uncovered which preserves the ability to participate in rising markets while still generating cash flow.

Our June 2025 Enhancement

In June 2025, BMO refined its covered call approach to further emphasize potential total return outcomes.

While the specifics vary by ETF, the changes broadly reflected:

  • A more flexible coverage range, rather than static coverage targets
  • Greater emphasis on out-of-the-money3 call writing, allowing for more upside participation
  • A continued shift toward actively managing the trade-off between cash flow and potential growth

The goal was clear: move away from maximizing yield alone and toward delivering a more balanced cash flow & growth profile over time.

What Investors should Look for

When evaluating covered call ETFs, a few key considerations stand out: Continue Reading…