Family Formation & Housing

For young couples starting families, buying their first home and/or other real estate. Covers mortgages, credit cards, interest rates, children’s education savings plans, joint accounts for couples and the like.

Tricks about residential home construction you wish you knew about before starting

By Daniel Quindemil

Special to the Financial Independence Hub

Designing a home is often one of the best (or worse) experiences for most people.

Building in general is a relatively difficult task, but building your own house can sometimes be nerve racking!

As a construction company, we understand the importance of planning the project beforehand, designing a solid design, getting pricing and the labor and material take offs done early so you can accurately create a budget.

That’s why we wrote this simple guide packed with tricks so you don’t fall into pitfalls some owners and investors fall into.

First, let’s look at the different types of residential projects.

What is Residential Construction?

Residential construction is building or remodeling a structure designed for everyday living.  Residential consists of Single Family, Duplexes, Triplexes, Townhouses, even Apartment and Condo buildings.

Each has its own challenges.

Single Family

Single family construction is typically designed for one family, hence the name single.  They typically are one or two stories, although some places like New York often go more vertical due to availability of space.

Duplexes, Triplexes, and Quadplexes, Twin Homes, Townhomes

These are single structures designed for multiple units.  A duplex will have two units within the structure, triplexes have three, quadplexes four.  A twin home is similar to a Duplex but has two owners.  Duplexes are owned by one party.  Townhomes are a group of units within a structure.  They are usually two or more stories.

Apartments and Condominiums

Apartments and Condos can be single story, but more often multi-story. Apartments are designed for rentals while Condominiums are for purchase, although they look very similar.

How long does it take to design and build?

The short answer: it depends. Every project is going to have its unique budget, schedule, sequencing, and craftsmanship.  All of these will come into play when planning your schedule.

When planning the overall project, you have to take into account four important timelines:

Design time

Timeframe for architects will vary quite a bit depending on size, details, and complexities involved with the project.  Often when an interior designer is involved, the timeline doubles or even triples because of the level of detail required.

Typically a single family and duplex home can be designed in 1-3 months.

Townhouses can take longer depending on the number of units.  Designing a townhouse building is very similar to a duplex and often the units are repeated or “flipped,” which speeds up the design process. Continue Reading…

Comparative saving for Financial Independence: Is the world financially stacked against women?


By Billy and Akaisha Kaderli, RetireEarlyLifestyle.com

Special to the Financial Independence Hub

Why do women lag in retirement savings as compared to men?

Are women at a disadvantage for reasons too numerous to list? Is it sexism? Are females not good savers? Big spenders? Is it really true that women get paid less for the same work performed? Is the world financially stacked up against women?

I read lots of articles noting all the reasons that “women have it harder” than men when it comes to saving for retirement. Regularly listed are the following:

  • The difference in men’s and women’s wages, also affecting their Social Security amounts later: but the articles don’t give honest insight into why the wages vary. This leads the reader to conclude that it’s sexism that determines pay.
  • Women often live longer than their spouses, “forcing” them to live on one SS check instead of two:  however, by women living longer, this gives more time for their investments to compound.
  • Women take off work to raise children or to become a caregiver to a family member, thus affecting their career path earnings. See the tools offered below which – if used – both stay-at-home-moms and caregivers can become financially independent.

Think outside the box

I don’t enjoy reading articles that tell me “statistically,” I’ll be settling for less and that I don’t have options. Or that “according to the numbers” – somehow – I am doomed to a mediocre savings rate and career path. Or because I am a woman, I’m going to have it tougher in life: all across the board.

So, let’s think outside the box for a moment.

First things first: education and career choice

It’s called OPEH.

OPEH is an anacronym for Occupation, Position, Education and How many hours worked a week. These four things affect a person’s income far more than one’s gender.

And we, as women, have choices in all of these categories.

Occupation

Georgetown University composed a list of the best paying college majors and the percent of men and women majoring in those fields.

The highest paying majors were Engineering, Math and Science. Men dominated these job choices, so their career path was set to earn a good, solid wage with upward mobility.

The lowest paying majors were those in Psychology, education, and social services. Women dominated these fields, so their career path was set to earn less than the above-mentioned choices that males made. These different career choices limited their upward mobility within their jobs.

We women have a choice as to what field we want to excel in, and we need to choose wisely.

Position

Teaching young girls the value of STEM courses (Science, Technology, Engineering and Math) will place them in careers where they will earn more. Upward mobility in STEM careers is greater and this will translate to better earnings on their future bottom line.

Education

Within those STEM fields, males tended to gravitate towards a specialty or training that paid better. In other words, males once again made different choices for their focus. Nothing is stopping us from making these same choices. Our brains are every bit as good, wouldn’t you agree?

Hours worked per week

Even within the same job categories – and this is important here – one of the things that differentiated male workers from female workers was the willingness of male workers to put in more hours per week on the job. Males were more inclined to be on call or be at the office any time the firm might call them. Continue Reading…

A Look into Tax Debt in the United States

By Mike Brown

Special to the Financial Independence Hub

Despite the financial harm it causes to many, tax debt, or the difference between taxes owed and paid, is an issue that does not receive much coverage compared to other forms of consumer debt like student loan, mortgage, or credit card debt. 

At the end of fiscal year 2018, the Internal Revenue Service (IRS) reported that there were 13.1 million delinquent taxpayer accounts. The combined tax debt in the United States is an estimated US$527 billion, with US$381 billion of that coming from federal taxes and the rest from state-based taxes. 

If a tax debt case goes unresolved, the consequences can be severe, including things like wage garnishment, asset seizure, or an international travel ban. 

Even with its considerable size and consequences, tax debt goes under-reported, but hopefully a new report published by LendEDU and Solvable will help raise awareness. Analyzing over 75,000 unique cases of tax debt, LendEDU’s report broke down tax debt by state, in addition to the most common reasons for tax debt in each state.

New Mexico posts lowest average Tax Debt, Vermont the highest

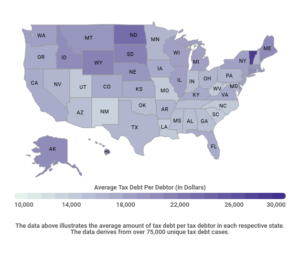
The national average tax debt was US$16,489, and 16 states had a figure below the average, while 29 states and Washington D.C. had higher-than-average tax debt.

New Mexico’s average tax debt of US$13,878 was the lowest in the country; following closely behind New Mexico was West Virginia ($14,325), North Carolina ($14,657), and Louisiana ($14,731). 

On the other end of the spectrum, Vermont’s average tax debt of US$28,862 was the highest and was in the same neighborhood as North Dakota ($23,671), Wyoming ($21,095), and South Dakota ($21,071). 

Regionally, states in the Northeast, Midwest, and West generally had very high tax debt, while states in the South had average tax debt figures on the lower end. 

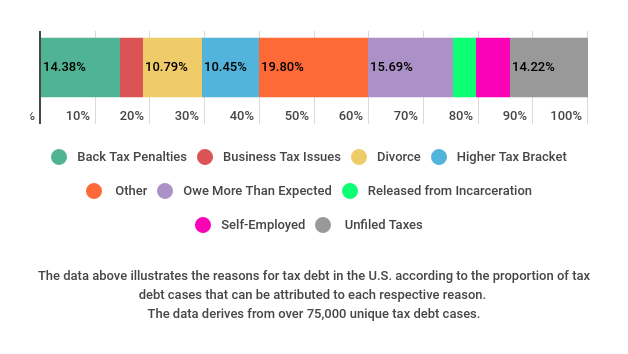
Main Reasons for Tax Debt include Back Tax Penalties and Divorce

A consumer can fall into tax debt for a variety of reasons, like underestimating how much in taxes he or she owes or not accounting for income made as a freelancer. Continue Reading…

Bank of Canada ends 2019 with a Rate Hold. What does this Mean for borrowers in 2020?

Bank of Canada

By Penelope Graham, Zoocasa

Special to the Financial Independence Hub

The final rate announcement from Canada’s central bank has come and gone: and it appears that the cost of mortgages and other forms of variable-rate borrowing are to remain stable well into next year.

The Bank of Canada (BoC) opted to leave its trend-setting Overnight Lending Rate (which consumer lenders use to set the pricing of their variable mortgages and lines of credit) at 1.75% on December 4th.  The rate has held status quo since October 2018, and makes the BoC somewhat of an outlier when it comes to monetary policy; many central banks around the world, including the U.S. Federal Reserve, cut interest rates this year to counter growing U.S.-China trade tensions, as well as the growing threat of recession.

A positive take on the Canadian economy

However, the BoC has maintained all year that while global economic instability remains a key risk, it feels confident enough in both the international and domestic economies to avoid adding stimulus. Of course, tweaking interest rates is a key tool the BoC has at its disposal in times of economic need; by keeping the cost of borrowing lower, it encourages continued consumer spending and helps avoid a credit crunch.

While a number of economists and analysts anticipated at least one downward rate cut in 2019, that never materialized. In its December announcement, the central bank stated, “There is nascent evidence that the global economy is stabilizing, with growth still expected to edge higher over the next couple of years.” It also adds that while the risk remains, a potential recession has become less likely, and that there is reason for optimism as Canada’s economy is stabilizing.

The December report outlines that end-of-year growth has progressed largely in line with what was forecasted in October, with consumer spending rising 1.3%, as well as upticks in business investment and wage growth. As well, the BoC’s most important metric, core inflation, stayed near its 2% target, and is expected to remain in that range over the next two years. As long as that remains the case, it’s unlikely the BoC will be prompted to cut or hike rates in the near future.

Lower rates to spur Housing demand in the New Year

With little chance of rate movement in the short term, what does that spell for Canada’s housing market? In what is somewhat of a self-fulfilling prophecy, the BoC included strengthening real estate activity as one of the main contributors to economic growth, further supporting its platform to keep rates at their current historical lows. Lenders have been able to keep their variable-rate offerings deeply discounted, while fixed mortgage rates have been kept down by especially low yields in the bond market.

That’s led to a boom in cheaper credit and mortgages over the course of 2019, which has fueled growing home-buyer demand; while the federal mortgage stress test did help tamp down some borrowing activity by requiring applicants to qualify for higher rates, the shock impact of the measure has largely been absorbed.

Housing Agency calls for home sales and prices to rise through 2021

That’s a trend that will continue over the next 12 to 24 months, according to several analysts. For example, Capital Economics has forecasted national house price growth will rise at least 6% in 2020 due to low mortgage rates, as well as a growing gap between housing supply and demand. Continue Reading…

Canadians have an Income problem, not a Debt problem

BoomerandEcho.com

It’s not hard to find a report about the growing Canadian debt problem. Canadians owe $1.77 for every $1 they make. The average consumer owes $31,400 in installment and auto loans, while borrowing for credit cards and lines of credit average $18,500 per consumer. Finally, there are reports that nearly half of Canadians won’t be able to cover basic living expenses without taking on new debt.

Half of Canadians say they have less than $200 left over at the end of the month, after household bills and debt payments. Canadians’ household savings rate is an abysmal 1.7 per cent.

Canadians have a major debt problem! All the warning signs are there. We’re overextended, borrowing to maintain our cost of living, and at risk of insolvency if a recession hits. It’s a crisis!

Our affordability problem

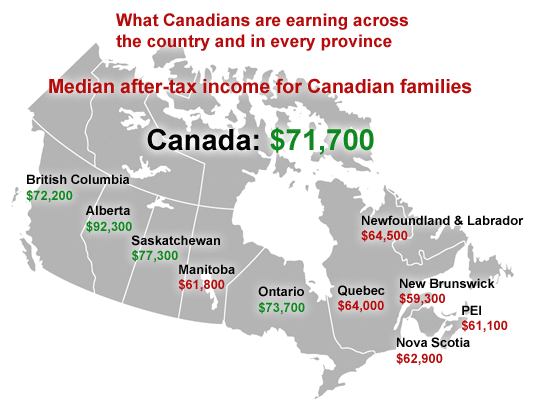
Not so fast. It looks to me like Canadians have an income problem, not a debt problem. Or, put a different way, Canadians have an affordability problem. The median after-tax income for Canadian families is $71,700. Meanwhile, the average house price in Canada is $512,501. That’s an incredible 7x income! For reference, the typical rule of thumb for housing affordability is 2.5x income. That means Canadians should be buying homes worth $179,250.

The discrepancy is even more staggering in B.C. and Ontario:

Avg. house price Median income Affordability
British Columbia $696,115 $72,200 9.64x
Ontario $618,165 $73,700 8.39x

It’s not just housing. Child care costs have risen faster than inflation in nearly two-thirds of cities since 2017. It’s often the single largest household expense after rent or a mortgage. The median cost of child care in Canada’s largest cities hovers around $1,000 per month, with parents in Toronto paying $1,675 per month. The exception is in Quebec, where a universal child care program has been in place for more than two decades (families pay $175 per month for child care in Montreal).

Transportation is the next largest expense for Canadians. On average, we owe $20,000 on our vehicles. The average price of a new vehicle has risen to $37,577. Today, it’s common to see auto loans stretched out over seven or eight years. That helps lower monthly payments slightly, but families are easily paying $500 per month or more on each vehicle (with many two-car families).

Beyond frivolous Debt

All this to say, it’s no wonder Canadians are struggling to get by from month-to-month. We’re accessing cheap credit, in a lot of cases, to fund basic living expenses or cover emergencies. It’s not like we’re out there buying diamonds and furs.

Furthermore, Scott Terrio, insolvency expert at Hoyes Michalos, says it can be misleading to suggest Canadians are so close to insolvency. He says there is a lot of runway between when someone is in financial trouble and when they file a legal insolvency.

“One can be technically insolvent for months, even years, before they need to consider an actual filing. We regularly have clients tell us that they should have come in to see us 12-24 months earlier than they did. That’s because there are all sorts of ways to stave off a legal insolvency.”

Indeed, there are only about 55,000 bankruptcies and 75,000 consumer proposals filed by Canadians every year.

“And there are 37 million Canadians, so you do the math,” says Terrio.

It’s an Income problem

No, we have an income problem that is crippling our ability to save. I’ve seen it firsthand. As a young homeowner, who admittedly got in over his head as a first time buyer, I struggled to pay my mortgage, buy groceries, and service my student loan debt (another issue altogether for young Canadians). Continue Reading…