
Inflation

Inflation

Searching for a Safe Withdrawal Rate: the Effect of Sampling Block Size

Image by Mohamed Hassan from Pixabay

By Michael J. Wiener

Special to the Financial Independence Hub

How much can we spend from a portfolio each year in retirement?  An early answer to this question came from William Bengen and became known as the 4% rule.  Recently, Ben Felix reported on research showing that it’s more sensible to use a 2.7% rule.

Here, I examine how a seemingly minor detail, the size of the sampling blocks of stock and bond returns, affects the final conclusion of the safe withdrawal percentage.  It turns out to make a significant difference.  In my usual style, I will try to make my explanations understandable to non-specialists.

The research

Bengen’s original 4% rule was based on U.S. stock and bond returns for Americans retiring between 1926 and 1976.  He determined that if these hypothetical retirees invested 50-75% in stocks and the rest in bonds, they could spend 4% of their portfolios in their first year of retirement and increase this dollar amount with inflation each year, and they wouldn’t run out of money within 30 years.

Researchers Anarkulova, Cederburg, O’Doherty, and Sias observed that U.S. markets were unusually good in the 20th century, and that foreign markets didn’t fare as well.  Further, there is no reason to believe that U.S. markets will continue to perform as well in the future.  They also observed that people often live longer in retirement than 30 years.

Anarkulova et al. collected worldwide market data as well as mortality data, and found that the safe withdrawal rate (5% chance of running out of money) for 65-year olds who invest within their own countries is only 2.26%!  In follow-up communications with Felix, Cederburg reported that this increases to 2.7% for retirees who diversify their investments internationally.

Sampling block size

One of the challenges of creating a pattern of plausible future market returns is that we don’t have very much historical data.  A century may be a long time, but 100 data points of annual returns is a very small sample.

Bengen used actual market data to see how 51 hypothetical retirees would have fared.  Anarkulova et al. used a method called bootstrapping.  They ran many simulations to generate possible market returns by choosing blocks of years randomly and stitching them together to fill a complete retirement.

They chose the block sizes randomly (with a geometric distribution) with an average length of 10 years.  If the block sizes were exactly 10 years long, this means that the simulator would go to random places in the history of market returns and grab enough 10-year blocks to last a full retirement.  Then the simulator would test whether a retiree experiencing this fictitious return history would have run out of money at a given withdrawal rate.

In reality, the block sizes varied with the average being 10 years.  This average block size might seem like an insignificant detail, but it makes an important difference.  After going through the results of my own experiments, I’ll give an intuitive explanation of why the block size matters.

My contribution

I decided to examine how big a difference this block size makes to the safe withdrawal percentage.  Unfortunately, I don’t have the data set of market returns Anarkulova et al. used.  I chose to create a simpler setup designed to isolate the effect of sampling block size.  I also chose to use a fixed retirement length of 40 years rather than try to model mortality tables.

A minor technicality is that when I started a block of returns late in my dataset and needed a block extending beyond the end of the dataset, I wrapped around to the beginning of the dataset.  This isn’t ideal, but it is the same across all my experiments here, so it shouldn’t affect my goal to isolate the effect of sampling block size.

I obtained U.S. stock and bond returns going back to 1926.  Then I subtracted a fixed amount from all the samples.  I chose this fixed amount so that for a 40-year retirement, a portfolio 75% in stocks, and using a 10-year average sampling block size, the 95% safe withdrawal rate came to 2.7%.  The goal here was to use a data set that matches the Anarkulova et al. dataset in the sense that it gives the same safe withdrawal rate.  I used this dataset of reduced U.S. market returns for all my experiments.

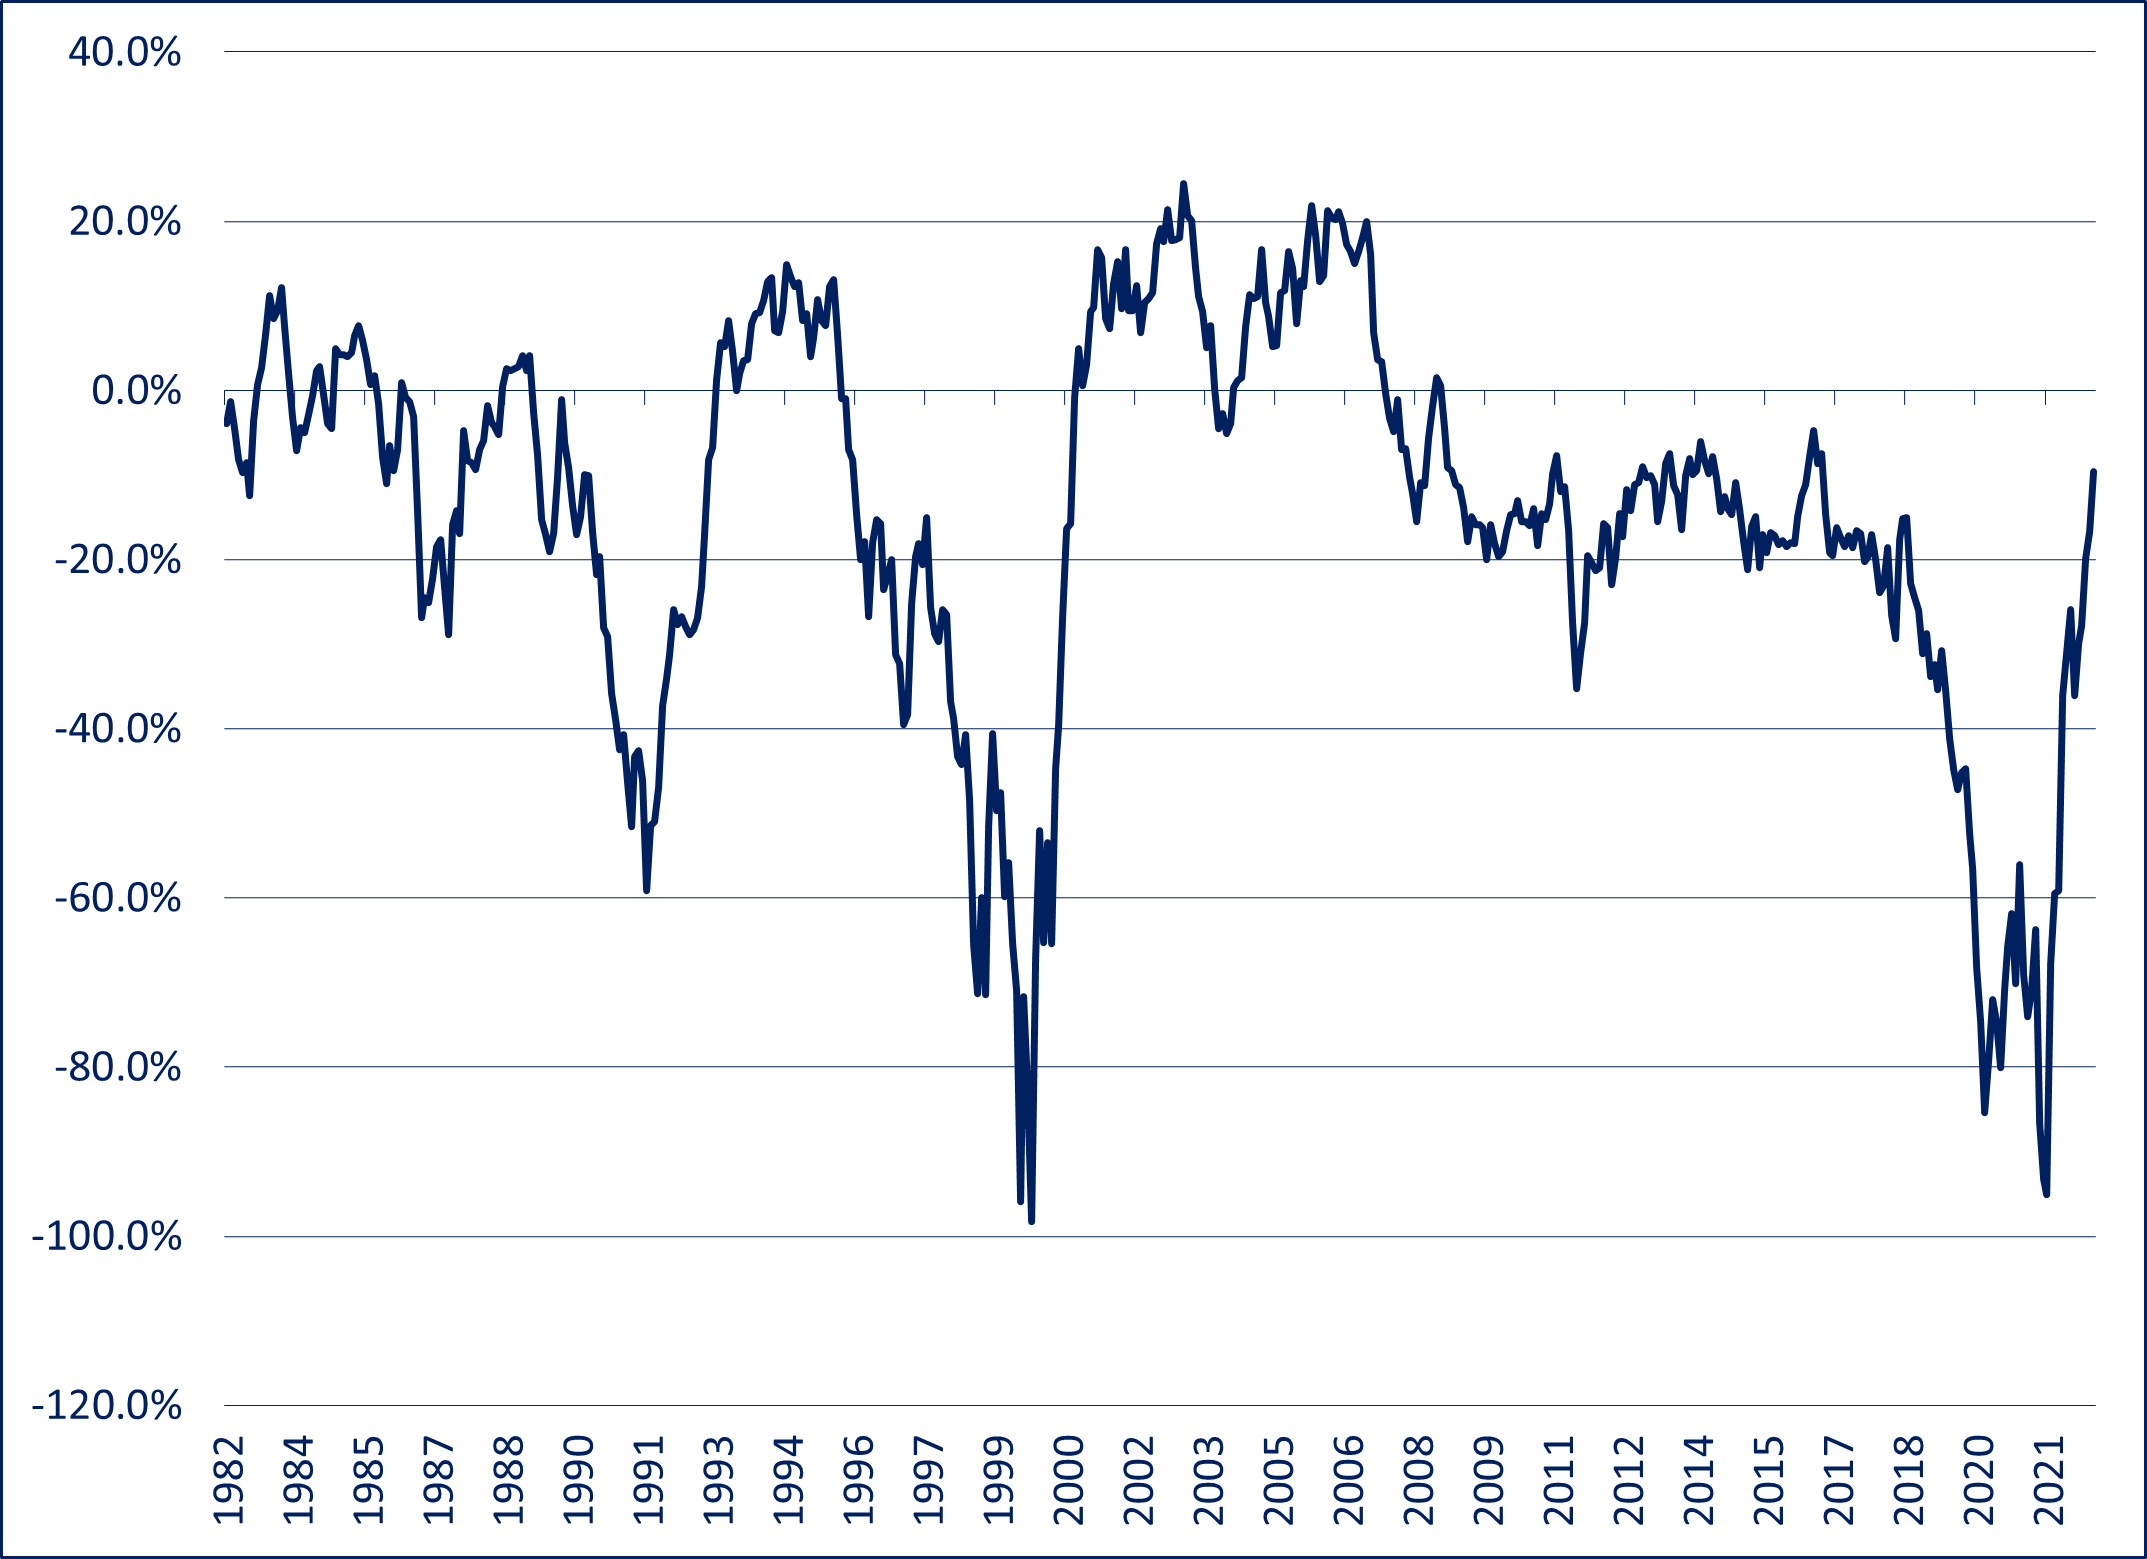
I then varied the average block size from 1 to 25 years, and simulated a billion retirements in each case to find the 95% safe withdrawal rate.  This first set of results was based on investing 75% in stocks.  I repeated this process for portfolios with only 50% in stocks.  The results are in the following chart.

The chart shows that the average sample size makes a significant difference.  For comparison, I also found the 100% safe withdrawal rate for the case where a herd of retirees each start their retirement in a different year of the available return data in the dataset.  In this case, block samples are unbroken (except for wrapping back to 1926 when necessary) and cover the whole retirement.  This 100% safe withdrawal rate was 3.07% for 75% stocks, and 3.09% for 50% stocks.

I was mainly concerned with the gap between two cases: (1) the case similar to the Anarkulova et al. research where the average sampling block size is 10 years and we seek a 95% success probability, and (2) the 100% success rate for a herd of retirees case described above.  For 75% stock portfolios, this gap is 0.37%, and it is 0.32% for portfolios with 50% stocks.

In my opinion, it makes sense to add an estimate of this gap back onto the Anarkulova et al. 95% safe withdrawal rate of 2.7% to get a more reasonable estimate of the actual safe withdrawal rate.  I will explain my reasons for this after the following explanation of why sampling block sizes make a difference.

Why do sampling block sizes matter?

It is easier to understand why block size in the sampling process makes a difference if we consider a simpler case.  Suppose that we are simulating 40-year retirements by selecting two 20-year return histories from our dataset.

For the purposes of this discussion, let’s take all our 20-year return histories and order them from best to worst, and call the bottom 25% of them “poor.”

If we examine the poor 20-year return histories, we’ll find that, on average, stock valuations were above average at the start of the 20-year periods and below average at the end.  We’ll also find that investor sentiment about stocks will tend to be optimistic at the start and pessimistic at the end.  This won’t be true of all poor 20-year periods, but it will be true on average.

When the simulator chooses two poor periods in a row to build a hypothetical retirement, there will often be a disconnect in the middle.  Stock valuations will jump from low to high and investor sentiment from low to high instantaneously, without any corresponding instantaneous change in stock prices.  This can’t happen in the real world. Continue Reading…

All good things must come to an end: There by the grace of Paul Volcker went Asset Prices

Image courtesy Creative Commons/Outcome

By Noah Solomon

Special to Financial Independence Hub

During the OPEC oil embargo of the early 1970s, the price of oil jumped from roughly $24 to almost $65 in less than a year, causing a spike in the cost of many goods and services and igniting runaway inflation.

At that time, the workforce was much more unionized, with many labour agreements containing cost of living wage adjustments which were triggered by rising inflation.

The resulting increases in workers’ wages spurred further inflation, which in turn caused additional wage increases and ultimately led to a wage-price spiral.The consumer price index, which stood at 3.2% in 1972, rose to 11.0% by 1974. It then receded to a range of 6%-9% for four years before rebounding to 13.5% in 1980.

Image New York Times/Outcome

After being appointed Fed Chairman in 1979, Paul Volcker embarked on a vicious campaign to break the back of inflation, raising rates as high as 20%. His steely resolve brought inflation down to 3.2% by the end of 1983, setting the stage for an extended period of low inflation and falling interest rates. The decline in rates was turbocharged during the global financial crisis and the Covid pandemic, which prompted the Fed to adopt extremely stimulative policies and usher in over a decade of ultra-low rates.

Importantly, Volcker’s take no prisoners approach was largely responsible for the low inflation, declining rate, and generally favourable investment environment that prevailed over the next four decades.

How declining Interest Rates affect Asset Prices: Let me count the ways

The long-term effects of low inflation and declining rates on asset prices cannot be understated. According to [Warren] Buffett:

“Interest rates power everything in the economic universe. They are like gravity in valuations. If interest rates are nothing, values can be almost infinite. If interest rates are extremely high, that’s a huge gravitational pull on values.”

On the earnings front, low rates make it easier for consumers to borrow money for purchases, thereby increasing companies’ sales volumes and revenues. They also enhance companies’ profitability by lowering their cost of capital and making it easier for them to invest in facilities, equipment, and inventory. Lastly, higher profits and asset prices create a virtuous cycle – they cause a wealth effect where people feel richer and more willing to spend, thereby further spurring company profits and even higher asset prices.

Declining rates also exert a huge influence on valuations. The fair value of a company can be determined by calculating the present value of its future cash flows. As such, lower rates result in higher multiples, from elevated P/E ratios on stocks to higher multiples on operating income from real estate assets, etc.

The effects of the one-two punch of higher earnings and higher valuations unleashed by decades of falling rates cannot be overestimated. Stocks had an incredible four decade run, with the S&P 500 Index rising from a low of 102 in August 1982 to 4,796 by the beginning of 2022, producing a compound annual return of 10.3%. For private equity and other levered strategies, the macroeconomic backdrop has been particularly hospitable, resulting in windfall profits.

It is with good reason and ample evidence that investing legend Marty Zweig concluded:

“In the stock market, as with horse racing, money makes the mare go. Monetary conditions exert an enormous influence on stock prices. Indeed, the monetary climate – primarily the trend in interest rates and Federal Reserve policy – is the dominant factor in determining the stock market’s major direction.”

To be sure, there are other factors that provided tailwinds for markets over the last 40 years. Advances in technology and productivity gains bolstered profit margins. Limited military conflict undoubtedly played its part. Increased globalization and China’s massive contributions to global productive capacity also contributed to a favourable investment climate. These influences notwithstanding, 40 years of declining interest rates and cheap money have likely been the single greatest driver of rising asset prices.

All Good things must come to an End

The low inflation which enabled central banks to maintain historically low rates and keep the liquidity taps flowing has reversed course. In early 2021, inflation exploded through the upper band of the Fed’s desired range, prompting it to begin raising rates and embark on one of the quickest rate-hiking cycles in history. Continue Reading…

Despite inflation, Canadians still prioritizing retirement and contributing to RRSPs and TFSAs

While the vast majority (87%) of Canadians are worried about rising costs from Inflation, Questrade Leger’s 2023 RRSP Omni report finds that 73% of RRSP owners plan to contribute again this year, and 79% of TFSA holders plan to recontribute. That’s despite the fact 69% fret that inflation will impact their RRSP’s value and 64% worry about the impact on their TFSA’s value.

“The number of Canadians who are saving for retirement remains consistent with previous years,” the report says. “Among those who are saving for retirement, about three-in-five (58%) say they are very worried compared to Canadians who are not saving for retirement. Women are also more likely to be very worried about the costs associated with rising inflation.”

Seven in ten respondents who have RRSPs told the panel they are concerned about the rising costs associated with inflation and a possible recession: 25% indicate that they are very concerned. “A similar trend is observed among those who hold TFSAs for retirement purposes, with almost two-thirds (64%) indicating that they are concerned.”


Worries about inflation and recession “raise questions about the ability of Canadians to control their financial future, especially when it comes to retirement,” the report says. These concerns are most acute for those with an annual income of less than $100,000: “These Canadians are also more likely to agree that they will have to draw upon their savings or investments to cover their expenses in the coming year.”

Less than half are confident about their financial future

Less than half feel they are confident when it comes to their financial future: “Only those making over $60K have confidence in their own financial future despite the current state of the economy.”

The survey seems to imply that Canadians value TFSAs a bit more than RRSPs, based on willingness to max out contribution room of each vehicle. Of course, annual TFSA room only this year moved up to $6500 per person per year, less than a quarter of the maximum RRSP room of $30,780 in 2023, for those with maximum earned income.

Only 29% of RRSP holders plan to maximize their RRSP contribution room in 2023, compared to almost half (46%) who plan to max out their TFSAs. The most enthusiastic TFSA contributors are males and those aged 55 or older.

Given economy, most worry about rising cost of food and everyday items  

Day-to-day living expenses continue to be a concern in the face of rising inflation: 79% worry about rising food prices and 77% rising everyday items. The third major concern (for 45%) is inflation’s impact on savings/investments and fourth (at 30%) is rising mortgage costs. Depending on annual incomes, worry over inflation can centre either on investments or on debt:  those in the middle to upper income brackets ($60K or more) “are much more likely to find the impact on savings / investments and increasing mortgage concerns more worrisome than compared to those who make less than $60K.”

Ability to save impacted by inflation

Three in four (74%) agree that inflation has impacted their ability to save, at least somewhat. And half (47%) have had to draw upon their savings or investments to cover expenses due to rising costs, especially those under 55 and those who are not currently saving for retirement. Many Canadians also agree they will have to draw upon their savings/investments to cover expenses in the coming year (43%). Continue Reading…

How to navigate a coming Worldwide recession

Source: myownadvisor and https://www.thecanadianencyclopedia.ca/en/article/recession

By Mark Seed, myownadvisor

Special to Financial Independence Hub

According to the largest asset manager firm in the world (BlackRock), policymakers will no longer be able to support markets as much as they did during past recessions – so we have been warned – a team of BlackRock strategists led by vice chairman Philipp Hildebrand wrote in a report titled 2023 Global Outlook.

“Recession is foretold as central banks race to try to tame inflation. It’s the opposite of past recessions,” they said. “Central bankers won’t ride to the rescue when growth slows in this new regime, contrary to what investors have come to expect. Equity valuations don’t yet reflect the damage ahead.”

The report went on to say “The old playbook of simply ‘buying the dip’ doesn’t apply in this regime of sharper trade-offs and greater macro volatility. We don’t see a return to conditions that will sustain a joint bull market in stocks and bonds of the kind we experienced in the prior decade.”

I reflected on this report recently. How is an investor to cope?

Well, I think the “old playbook” is actually something I’ve already started to think about for the “new playbook” and maybe you have as well …

  1. Directionally, i.e., longer-term than one year or so, stay with equities. Lots of them. In fact, to be specific, consider infrastructure stocks in particular. BlackRock: “We see some opportunities in infrastructure. From roads to airports and energy infrastructure, these assets are essential to industry and households alike. Infrastructure has the potential to benefit from increased demand for capital over the long term, powered by structural trends such as the energy crunch and digitalization.”
  2. Tactically, i.e., within the next year, if you need that money balance, consider bonds. Yes, consider fixed income again. According to BlackRock: “In fixed income, the return of income and carry has boosted the allure of certain bonds, especially short term. We don’t think leaning into broad indexes or asset allocation blocks is the correct approach. We stay underweight long-term nominal bonds as we see term premium returning due to persistent inflation, high debt loads and thinning market liquidity.” Meaning, if you are going to own some bonds, stay short and own short-duration bonds.

I come back to Ben Carlson’s thesis (that I agree with) after reading this recent BlackRock global outlook report when it comes to bonds. There are absolutely good reasons to own bonds, but it’s more for the near-term variety:

  1. Bonds can help your investing behaviour – helping you ride out stock market volatility – including being strategic to buy more stocks soon.
  2. Bonds can be used to rebalance your portfolio – helping you keep your portfolio aligned to your investing risk tolerance and therefore asset allocation (mix of stocks and bonds).
  3. Bonds can be used for spending purposes – where some fixed income is “king” for major, upcoming, near-term spending.

The main reason I would keep any bonds (and I still don’t have any right now) is if I was saving for a major purchase in a few years (e.g., secondary residence?). Then, I would like rely on some form of fixed income between now and then to help secure that purchase. Otherwise, an interest savings account in the short-term will do that and/or some 1 or 2-year GICs are a great consideration as well as part of any bucket strategy.

Personally, I believe the main role of fixed income in your portfolio is essentially safety – not the investment returns and not the cash flow needs. In other words, if all else fails per se, if/when stocks crash, then bonds should historically speaking offer a flight to safety for preserving principal.

So, they are there for diversification purposes.

As Andrew Hallam, Millionaire Teacher has so kindly put it over the years: when stocks fall hard, bonds act like parachutes for your portfolio. Bonds might not always rise when the equity markets drop. But broad bond market indexes don’t crash like stocks do.

Is that enough to own bonds in your portfolio? Maybe.

For now, I’m going to continue living with stocks: a mix of dividend-paying stocks (including infrastructure stocks that BlackRock likes for the year or so ahead) AND owning low-cost equity ETFs for growth.

I will also grow my cash wedge to my desired safety net by the end of 2023 too. That’s one year’s worth of spending/expenses held in cash that will form Bucket 1 below. That first bucket is an insulator from my dividend and growth equities.

Your mileage may vary. Continue Reading…

TFSA contribution is Job One in 2023 and other inflation-related tax changes to consider


A belated Happy New Year to readers. Today I wanted to start with a reminder that your first Financial New Year’s Resolution should always be to top up your TFSA contribution to your TFSA (Tax-free savings account), which because of inflation has been bumped to $6,500 for 2023. I’ll also link to two useful columns by a financial blogger and prominent media tax expert.

A must read is Jamie Golombek’s article in Saturday’s Financial Post (Dec. 31/2022), titled 11 tax changes and new rules that will affect your finances in 2023. Golombek is of course the managing director, Tax & Estate planning for CIBC Private Wealth.

He doesn’t lead with the TFSA but does note that the cumulative TFSA limit is now $88,000 for someone who has never contributed to a TFSA. On Twitter there is a community of Canadian financial bloggers who often reveal their personal TFSA portfolios, which tend to be mostly high-yielding Canadian dividend-paying stocks. In some cases, their TFSA portfolios are spinning out as much as $1,000 a month in tax-free income.

On a personal note, my own TFSA was doing nicely until 2022, when it got dragged down a bit by US tech stocks and a token amount of cryptocurrency. Seeing as I turn 70 this year, I’ll be a lot more cautious going forward. I’ll let the existing stock positions run and hopefully recover but my new contribution yesterday was entirely in a 5-year GIC, even though I could find none paying more than 4.31% at RBC Direct, where our TFSAs are housed. (I’d been under the illusion they would by now be paying 5%. I believe it’s still possible to get 5% at independents like Oaken and EQ Bank.)

At my stage of life, TFSA space is too valuable to squander on speculative stocks, IPOs, SPACs or crypto currencies. Yes, if you knew for sure such flyers would yield a quick double or triple, it would be a nice play to “sell half on the double,” but it’s better to place such speculations in non-registered accounts, where you can at least offset capital gains with tax-loss selling. So for me and I’d suggest others in the Retirement Risk Zone, it’s interest income and Canadian dividend income in a TFSA and nothing else.

Inflation and Tax Brackets

Back to Golombek and inflation. Golombek notes that in November 2022, the Canada Revenue Agency said the the inflation rate for indexing 2023 tax brackets and amounts would be 6.3%:

“The new federal brackets are: zero to $53,359 (15 per cent); more than $53,359 to $106,717 (20.5 per cent); more than $106,717 to $165,430 (26 per cent); more than $165,430 to $235,675 (29 per cent); and anything above that is taxed at 33 per cent.”

Basic Personal Amount

The Basic Personal Amount (BPA) — which is the ‘tax-free’ zone that can be earned free of any federal tax — rises to $15,000 in 2023, as legislated in late 2019. Note Golombek’s caveat that higher-income earners may not get the full, increased BPA but will still get the “old” BPA, indexed to inflation, of $13,521 for 2023.

RRSP limit: The RRSP dollar limit for 2023 is $30,790, up from $29,210 in 2022.

OAS: Golombek notes that the Old Age Security threshold for 2023 is $86,912, beyond which it begins to get clawed back.

First Home Savings Accounts (FHSA). Golombek says legislation to create the new tax-free FHSA was recently passed, and it could be launched as soon as April 1, 2023. This new registered plan lets first-time homebuyers save $40,000 towards th purchase of a first home in Canada: contributions are tax deductible, like an RRSP. And it can be used in conjunction with the older Home Buyers’ Plan.

3 investing headlines to ignore this year

Meanwhile in the blogosphere, I enjoyed Robb Engen’s piece at Boomer & Echo, which ran on January 1st: 3 Investing Headlines To Ignore This Year. Continue Reading…