Inflation

Inflation

Subsidizing China’s Superpower aspirations

By Jeff Weniger, WisdomTree Investments
Special to the Financial Independence Hub
 
Christine Lagarde, head of the International Monetary Fund (IMF), has warned that China’s Belt and Road Initiative, the potentially multitrillion-dollar network of roads, rails, pipelines and other infrastructure across Eurasia, risks saddling unstable governments with unpayable debt. Because of the IMF’s concerns, it plans to fund the China-IMF Capacity Development Center (CICDC) to train the Chinese to minimize the headaches in this century’s Marshall Plan. If all goes according to plan, the Belt and Road Initiative will connect land- and sea-based trading routes to cement China as the center of global commerce in a decade or two.

While China appears to be ascending into world superpower status sometime in the coming decades, a $100 investment in “global” equities allocates just $3.51 to the country if we track an index like the MSCI All Country World Index (ACWI).1 That’s not far from Canada’s weight, and it seems remarkably low for a country that is going head-to-head with the U.S. on the global stage.

It was only last year that MSCI added Chinese A-shares, companies listed in Shanghai and Shenzhen, to its MSCI Emerging Markets Index. That is late for an economy whose size surpassed the U.S. in 2014, at least on a purchasing power parity (PPP) basis (see figure 1).

Figure 1: China & U.S. Share of Global GDP

China and U.S. Share of Global GDP

Covering China, wherever the listing

While some Chinese companies are available only in Shanghai or Shenzhen, others are listed solely in Hong Kong. Still others have American depositary receipts (ADRs) or are traded in Singapore.

Our TSX-listed exchange-traded fund, WisdomTree ICBCCS S&P China 500 Index ETF (CHNA.B), tracks the ICBCCS S&P China 500 Index, covering stocks in all those bourses. Its index is currently over 50% in local A-shares. MSCI, by contrast, is only starting to add A-shares securities up to a 5% inclusion factor in 2018, a small starting point. It’s high time China has its own S&P 500, especially if President Xi Jinping has anything to say about it.

Going Out

Deng Xiaoping, ruler of China from 1978 to 1989, famously advised his country to “hide your strength, bide your time.” China’s great goal for the last four decades — development, development, development — was to happen quietly, with fingers crossed that the U.S., Japan and Western Europe wouldn’t get too frightened. Continue Reading…

Thinking about retirement? Here are 2 two key income sources to expect

By Scott Ronalds

Special to the Financial Independence Hub

If you’re at the point where you’re starting to think seriously about retirement, you’re probably wondering how much money you’re going to need to enjoy life after work, and where it’s going to come from.

Everybody’s wants and needs are different, so there’s no magic number as to how much you should have saved by a certain age. Plus, the face of retirement has changed significantly, with many people working part-time into their seventies and eighties, and others hanging it up in their fifties.

That said, by making a few assumptions, we can give you a rough estimate of what you can expect from government sources and your portfolio when you decide to retire.

The basics

To keep it simple, we’ll use a scenario which assumes you’re 65 and plan to fully retire from your job this year. A few other assumptions:

  • You don’t have a pension plan with your employer.
  • You’re eligible for full Canada Pension Plan (CPP) and Old Age Security (OAS) benefits.
  • You have an RSP that you plan to convert to a RIF this year, and you plan to take the minimum required payments (which will start next year) from your account. (Note: you aren’t required to convert your RSP to a RIF until the calendar year you turn 71, but you can convert at any age before 71 if you choose).
  • You don’t have any other investments or sources of income.

First off, let’s look at what you’ll get from the government. You can expect monthly CPP payments of roughly $1,114 ($13,370/year) and OAS payments of about $578 ($6,936/year). In total, you can plan on collecting about $1,690 a month, or just over $20,000 a year. These amounts are indexed to inflation. You can decide to defer taking CPP benefits until you’re older, or take them earlier, in which case your benefits will be increased or decreased, respectively. You can also defer taking OAS to receive a larger monthly benefit.

More than likely, this isn’t going to cover your living expenses or fund the lifestyle you want in retirement. So you’re going to need to rely on your portfolio to cover the shortfall.

RIFing it

Converting your RSP to a RIF means your minimum withdrawal next year will be equivalent to 4.0% of your portfolio’s year-end market value. This figure is based on your age, 65, at the end of the current calendar year. Continue Reading…

Forget the Trade War, already: China is cutting Taxes

By Jeff Weniger, WisdomTree Investments

Special to the Financial Independence Hub

The market’s obsession with trade wars may finally be exhausted and priced in. Move on to the next market mover: massive Chinese tax cuts, which should aid the WisdomTree ICBCCS S&P China 500 Index ETF (CHNA.B), our tracker exchange-traded fund for the country.

Sure, China exported US$457 billion (C$597 billion) of goods and services to the U.S. in the year through June, and some fraction of those exports is at risk from a deterioration in Sino-U.S. relations. But engage a drastic scenario: lop off US$200 billion or US$300 billion from that figure. Even if that happened, most of that sum wouldn’t even disappear; it would be sold elsewhere, maybe inside China, at concessionary prices. But even suspending logic and having it all vanish, is it really doomsday for China’s US$14.1 trillion economy (US$25.2 trillion at purchasing power parity)? We don’t want to minimize the importance of trade conflicts, but the airtime given this topic is hysterical.

When Obama was in office, many conservatives and free market acolytes convinced themselves he would destroy the U.S. economy, so they ignored massive fiscal and monetary stimulus — the data — and missed the equity bull market. Emotions ruled; logic lost.

Now it’s happening with Trump. Among some investors, emotions are defeating data. The recent Bank of America Merrill Lynch fund manager survey pointed to a trade war as the market’s biggest risk. Some investors so badly wish Trump to fail that, like conservatives during the Obama years, positive news is simply ignored. Forget Japan’s major trade deal with the EU, ink still wet. Forget Trump’s meeting with Jean-Claude Juncker, European Commission president, where they agreed to work toward zero tariffs. The end is near!

Astute investors need a sober, facts-based thesis.

A Thesis without Emotion

A more realistic take on matters is that China finds itself isolated, unable to pair with Moscow in a two-country geostrategic counterbalance to the West. This forces Beijing to backtrack on intellectual property theft, inordinately high tariff levels, state subsidies and dumping because of its weak bargaining hand.

The pain must be offset, so Beijing gives the market that for which it aches: trillions of dollars in tax cuts at the business, product and personal income tax levels. Yes, Trump’s ability to stir the pot is important, but mathematics matters.

Chinese equities are the play here.

Bold actions

We calculate that many Chinese will see their personal income tax liability fall by half or more, effective January 1, 2019. Add to this our estimate of nearly US$500 billion in value-added tax cuts over the next decade, with still-in-the-works business tax relief on top, which would be another US$132 billion to $138 billion if activity grows at a pace of 6% to 7%. For perspective, Beijing’s Lehman-era US$586 billion spending package, hypothesized by some to be the reason the Global Financial Crisis ended, is smaller than 2018’s total announced tax cuts, if we calculate them over several years. This is this year’s big story.

Income Tax Scenarios: Implications for everyday Chinese

The proposed personal income tax code changes are staggering (figure 1). Exemptions and the minimum bounds for the 10%, 20% and 25% brackets are set to gap higher, while tuition, medical and mortgage deductions add to the savings.

Figure 1: China Personal Income Tax Code 
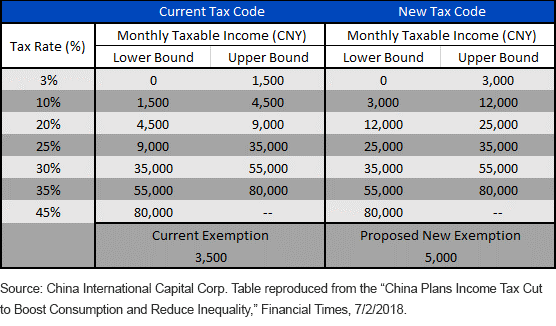
If these become law in October and are implemented in January, someone making CNY15,000 per month (C$2,906), a wage that is common in a city like Shanghai, where 2017 median monthly income is $2,048, would see their monthly taxes cut by CNY1,080 (C$209).1The person making half that amount, or CNY7,500 per month, which is short of the metropolitan median, would save about C$500 per year on an income of C$17,437. This is serious.

Chinese Equity Valuations

With many Chinese equity markets hammered this year, the S&P China 500 Index’s forward P/E multiple has fallen to 11.7, a sharp discount to the S&P/TSX Composite Index of Canadian equities (P/E of 15.8).2  Continue Reading…

Retired Money: How to beat the banks at their own game

My latest MoneySense column reviews the new book by ex banker Larry Bates, titled Beat the Bank. As the headline suggests, it’s all about how to beat the banks at their own game, which ironically can mean owning the big bank stocks themselves! The full column can be retrieved by clicking on the highlighted text here:  Tips for DIY investors on beating the Big Five banks.

The formal launch date for the book is this Thursday: September 13, 2018. I first met Bates over lunch in March as his manuscript was nearing completion, where he expounded on what he called the “two Bay Streets.” Old Bay Street and its secrets are the focus of chapters 4 and 5, and New Bay Street is chapter 6.

Old Bay Street is not the investor’s friend

Most experienced investors will have encountered Old Bay Street at some point. This is the traditional investment industry: the commission-based mutual fund and brokerage industry, insurance company reps, investment “specialists” in the bank branches and various salespeople who call themselves “advisors.”

New Bay Street = Discount Brokerage, ETFs & fee-for-service planners

The New Bay Street includes providers of low-cost index funds or Exchange-traded Funds (ETFs) or online robo-advisers that automate the purchase and rebalancing of ETFs along with setting asset allocation.

At 62, Bates is well into his own “Victory Lap,” leaving employment for self-employment. Actually, his New Bay Street model isn’t all that new, as it describes models similar to what I myself described back in 1998 in my own financial book, Findependence Day. My version consists of buying ETFs at a discount brokerage and using a fee-for-service financial planner. The same year, similar principles were also described in Stop Buying Mutual Funds!, by Mark Heinzl, now a Globe & Mail stock market columnist.

Dinosaur banks have the lowest T-REX scores

Bates has fashioned something he calls T-REX scores  This is an acronym for Total Return Efficiency Index Score. A T-REX score of 100% would be paying absolutely no fees at all, no matter how long your time horizon.

Mutual funds with 2% annual fees would have T-REX scores of 54% over 20 years and true fees of 46%, but the longer you hold, the worse the performance; thus, over 40 years the T-REX would be 41% and the true fee 59%. Fees of 3% inflict even more damage. This is the basis for his statement that long-term customers of Old Bay Street lose half their money to fees. You can find more at his website at www.larrybates.ca.

The pure DIY model of buying individual stocks or bonds at a discount broker yields the highest scores: a T-REX of 96 to 99%. (Remember, the higher the better, with 100 being perfect).

Continue Reading…

New mandatory risk rating is misleading Canadian investors

By Nick Barisheff (Sponsor Content)

Canadian securities regulators may be putting investors at risk. They implemented a new mandatory risk weighting system in September 2017 based on 10-year Standard Deviation. Every Canadian mutual fund and exchange-traded fund (ETF) must now include a risk rating based on the following:

Before implementing this policy, the Ontario Securities Commission (OSC) asked for submissions from the industry. These can be viewed here.

Over 50 submissions were received (mine included.) and out of those, three warned about the deficiency that Standard Deviation does not differentiate between upside and downside volatility.

Scott C. Mackenzie of Morningstar made a particularly succinct comment:

“A conservative investor’s portfolio that is missing a key sector or asset class, essential for prudent diversification (and risk reduction), may demand the inclusion of a small amount of a concentrated sector mutual fund or ETF. A single measure risk score for such a vehicle may be higher than recommended for the investor and they are consequently dissuaded from incorporating it. The irony and potential downside is that the risk of the conservative portfolio may actually be higher than otherwise would have been had the investor included the diversifying investment. “Diversification as a risk-reduction activity is a sensible approach, practiced by many, and supported by decades of investment research.” http://www.osc.gov.on.ca/documents/en/Securities-Category8-

Comments/com_20140312_81-324_mackenzies.pdf

There are two major flaws with the methodology:

  1. It does not differentiate between Standard Deviation and Downside Deviation; and
  2. It measures individual portfolio components rather than the overall Standard Deviation of the entire portfolio.

This policy will not protect investors from experiencing losses, but may prevent investors from structuring portfolios for reduced volatility, optimal performance and effective diversification. The resulting reduction in investment demand in sector funds will result in a negative impact for many Canadian public companies.

The overall weakness of this approach is best exemplified by the fact that Bernie Madoff’s fund had the lowest Standard Deviation in the industry for over 30 years – yet investors lost most of their money.

David Ranson of H.C. Wainwright & Co. published a report entitled “Why Standard Deviation Won’t Serve to Classify the Risk of a Portfolio.” This report details why Standard Deviation is a poor and overly simplistic approach to measuring the risk of a portfolio.

“The riskiness of an investment product cannot be represented by the Standard Deviation (volatility) of its historical returns, or by any other single statistic … On a real risk scale, cash could be assessed as risky and gold as safe.” 

http://bmg-group.com/wp-content/uploads/2017/12/why-standard-

deviation-wont-serve-to-classify-the-risk-of-a-portfolio.pdf

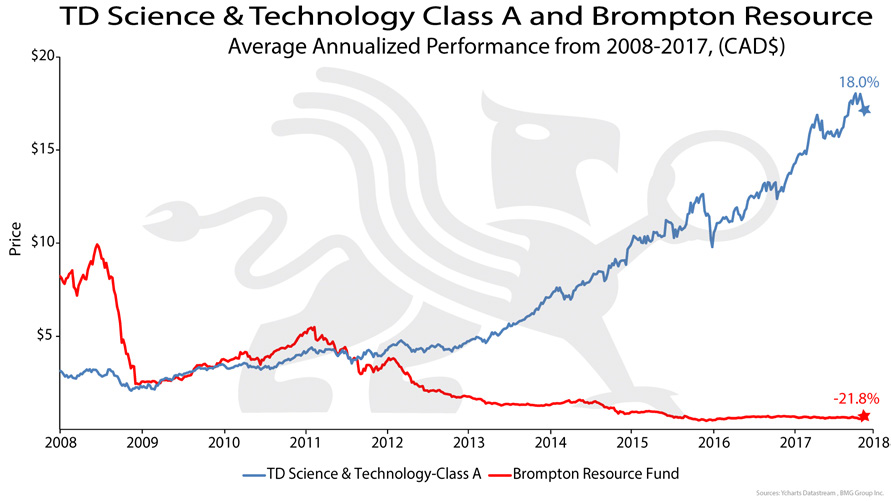
As an example of how flawed this policy is, Morningstar Canada lists 9,412 equity classes of mutual funds. Of these,1,932* have 10-year performance histories. The best-performing fund is the TD Science and Technology Fund, which achieved an 18.00% 10-year annualized return net of MER. A $10,000 investment in 2007 would now be worth $66,554*.

On the other side of the performance scale is the Brompton Resource Fund. It ranks as 1,932*(last) in performance and has experienced a-21.8% annual decline over the same 10-year period. A $10,000 investment ten years ago would now be worth only $643*.

*As of July 18, 2018

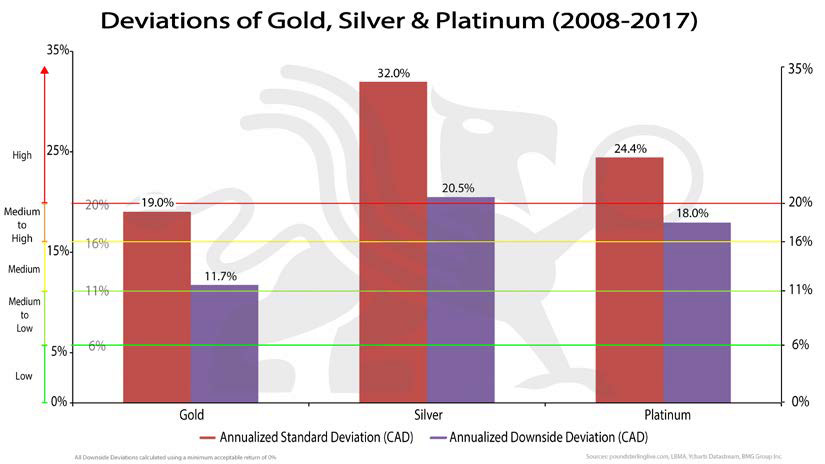
The 10-year (2008-2017) Standard Deviation for the TD Science and Technology Fund is 17.7% (MEDIUM to HIGH RISK) and for the Brompton Resources Fund it is 29.57% (HIGH RISK). However, the Downside Deviation is 10.6% (LOW to MEDIUM RISK) for the TD Fund and 25.7% (HIGH RISK) for Brompton Fund.

It should be obvious, even to the unsophisticated investor, that the risk of these funds that are at opposite ends of the performance spectrum is not similar.

This flawed methodology is more pronounced when it comes to physical bullion funds such as the BMG Funds. According to this methodology, the Standard Deviation for gold results in a MEDIUM to HIGH risk rating. Silver and platinum would be rated HIGH RISK.

This new risk rating methodology is in direct contradiction to the suggested risk rating for gold established by the Basel Committee on Banking Supervision (BCBS). BCBS brings together regulators from 28 countries, and establishes rules governing the appropriate level of capital for banks. The current version of these rules, known as Basel III, is a key element of the international regulatory reform agenda put in motion following the global financial crisis of 2008. During the 2008 financial crisis, gold was used in international settlements as a zero-risk asset after many decades of being sidelined in the monetary system. Gold’s old emergency usefulness resurfaced, albeit behind closed doors, at the Bank of International Settlements (BIS) in Basel,Switzerland. Continue Reading…